Learn how to build custom reports tailored to your needs.
Initialize Custom Report Project Structure
Prerequisites
- NodeJS LTS installed in your computer
- JavaScript knowledge
- Vue framework knowledge
Getting Started
Navigate to the directory of your choice and follow the steps.
Install the package globally via npm:
npm install -g @leanix/reporting-cli
Initialize a new project by running the following command and answering the questionnaire. For this tutorial we will be using the vue template:
npm init lxr@latest
After this command, you should end up with the following project structure:
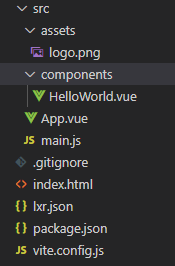
Adjust the report boilerplate source code
We need to make some modifications in our project's boilerplate code. We start by deleting the unnecessary files:
- src/assets/logo.png
- src/components/HelloWorld.vue
Then we add TailwindCSS, a CSS framework that provide several utility classes that we use during our tutorial for styling it. For that we follow the official installation guide and perform the following steps:
-
Install Tailwind and its peer-dependencies using npm:
npm install -D tailwindcss@latest postcss@latest autoprefixer@latest -
Next, generate your tailwind.config.js and postcss.config.js files:
npx tailwindcss init -p -
In your tailwind.config.js file, configure the purge option with the paths to all of your pages and components so Tailwind can tree-shake unused styles in production builds:
// tailwind.config.js module.exports = { purge: ['./index.html', './src/**/*.{vue,js,ts,jsx,tsx}'], darkMode: false, // or 'media' or 'class' theme: { extend: {}, }, variants: { extend: {}, }, plugins: [], } -
Additionally, ensure your CSS file is being imported in your ./src/main.js file
// src/main.js import { createApp } from 'vue' import App from './App.vue' import 'tailwindcss/tailwind.css' createApp(App).mount('#app') -
Finally, adjust the ./src/App.vue file and set the template and script tags as follows:
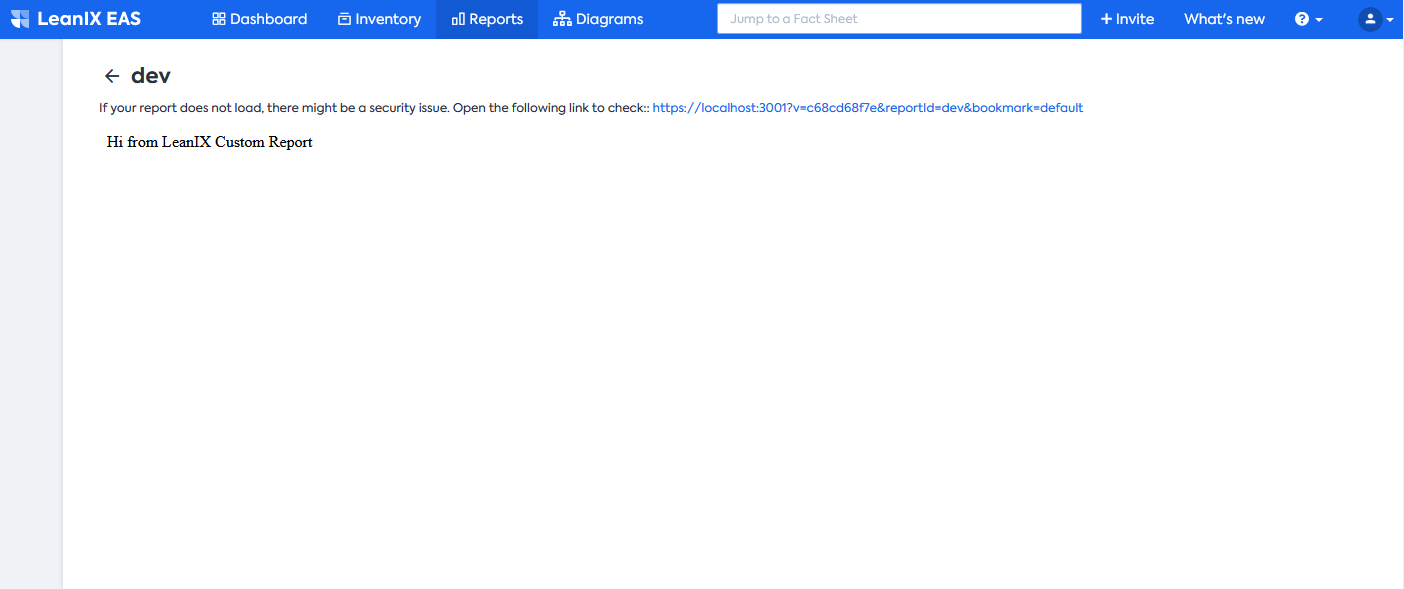
<template> <!-- we'll use this template tag for declaring our custom report html --> <div>Hi from LeanIX Custom Report</div> </template> <script setup> // all the state variables and business logic will be declared here </script> -
You may now start the development server now by running the following command:
npm run dev
SSL Certificate
When you run npm run dev, a local webserver is hosted on localhost:3000 that allows connections via HTTPS. But since just a development SSL certificate is created the browser might show a warning that the connection is not secure. You could either allow connections to this host anyways, or create your own self-signed certificate.
If you decide to add a security exception to your localhost, make sure you open a second browser tab and point it to https://localhost:3000. Once the security exception is added to your browser, reload the original url of your development server and open the development console.
Your should see a screen similar to the one below. Notice that our report loads, and is showing the message we defined inside the template tag of the App.vue file.
You can proceed with building the functionalities that you need in the report.
Files in the Project Structure
lxr.json
The lxr.json file stores your workspace-relevant credentials. This file contains specific configuration for developing, testing and uploading your report. It is not meant to be tracked by version control, since it may contain user specific API Tokens. The file should be encoded in utf-8 to be processable by the reporting-cli.
Proxy Server
If you are operating behind a proxy simply add the "proxyURL" attribute to the lxr.json file as follows:
{
  "host": "app.leanix.net",
  "apitoken": "AAAAAAAAACqEXDDubry64H95SKYPjJTBKNFhkYD8kSCL",
  "proxyURL": "<add your proxy url here>"
}
Host
If you have implemented SSO the host should be the domain for your workspace. The domain is visible in the url for your workspace.
If you are a US or EU customer and you do Not have SSO enabled. The host can be any of the following us.leanix.net, eu.leanix.net, or app.leanix.net. In order to determine which is the correct option, please look at the url for your workspace.
Self Created Certificate
If you have created your own certificate you can add the certificate and private key files to the lxr.json configuration file of your generated project:
{
  "host": "app.leanix.net",
  "apitoken": "Jw8MfCqEXDDubry64H95SKYPjJTBKNFhkYD8kSCL",
  "ssl": {
    "cert": "/path/to/cert",
    "key": "/path/to/key"
  }
}
IE11 or MS Edge
For Windows users using IE11 or Microsoft Edge, follow these instructions.
Local Port
By default the local dev server is hosted on port 8080. You can change that in your lxr.json via the "localPort" setting:
{
  "host": "app.leanix.net",
  ...
  "localPort": "4200"
}
package.json
This file contains information about your project. When uploading the report into LeanIX some of the information is used when displaying your report to the user.
Example package.json:
{
  "name": "leanix-quality-chart-report",
  "version": "1.0.0",
  "author": "LeanIX GmbH",
  "description": "This report shows the overall quality of your Fact Sheets per Fact Sheet type",
  "leanixReport": {
    "id": "net.leanix.qualitychart",
    "title": "Quality Chart",
    "documentationLink": "https://dev.leanix.net/example-docs",
    "defaultConfig": {
      "factSheetTypes": ["Application"]
    }
  }
}
Special Characters
ReportId may only consist of the following characters: 'a-z', '0-9', '.', '_'. It may also not end with a '.'. or ",".
Description of the properties that we extract from package.json when uploading your report to LeanIX:
- name: Name for your report project
- version: Version of your report as displayed in workspace admin
- author: Creator of the report (optional, do not use any special characters)
- description: Description of your reports use case (optional)
- leanixReport: Additional properties used by LeanIX
id: Unique ID for your report, we encourage you to follow Java package naming convention to force
uniqueness(https://docs.oracle.com/javase/tutorial/java/package/namingpkgs.html)
Note: the very last part of the id parameter is the one being used in the reporting menu. Please make sure it is unique so that it does not overwrite another report.
-title: Title for your report that is displayed in the GUI (optional)
-documentationLink: Link to a documentation of your report (optional)
-defaultConfig: Default configuration object, that can be adapted by the user (optional if your report
is not configurable)
src/index.html
This file is initially loaded by the LeanIX reporting framework and is hence the starting point for the execution of your report within the users browser.
src/index.js
This file is the starting point for bundling JavaScript into one file. You can use the import statement (https://developer.mozilla.org/de/docs/Web/JavaScript/Reference/Statements/import) in order to split up your project into multiple files. We use webpack 3.x under the hood to bundle your project.
Core functionality of the reporting framework
In this section, you will get an overview of the key functionalities of the LeanIX Reporting Framework. As the standard reports are based on the same functionality, it is mandatory that all custom reports follow the same pattern to unify the user experience.
Filterable Fact Sheet information
You can configure the framework to fetch certain information of the Fact Sheets contained in a workspace. You can apply filters to the set of Fact Sheets as you do it in the LeanIX Inventory.

In this example, we simply specify that we want to have the attributes displayName, type and description of Fact Sheets. The Reporting Framework will display GUI elements that allow the user to filter the set of Fact Sheets. Whenever the filter is changed by the user the callback function is invoked with the new set of data. Inside the callback, we create HTML based on the new data and display the generated HTML inside the body element.
import '@leanix/reporting';

lx.init()
.then(function (setupInfo) {
  var config = {
    facets: [{
      key: 'main',
      attributes: ['displayName', 'type', 'description'],
      callback: function (data) {
        console.log(data);
        var html = '';
        for (var index = 0; index < data.length; index++) {
          var fs = data[index];
          html += '<div>' + fs.displayName + '</div>';
        }
        document.body.innerHTML = html;
      }
    }]
  };
  lx.ready(config);
});
Custom Dropdowns
You can configure the framework to display custom dropdowns to the user and inform you if they change the selection.
The custom dropdown, named "SORT" can be seen below:
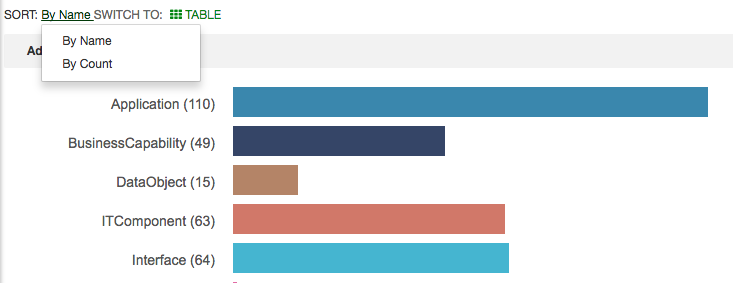
This example shows how to use custom dropdowns:
import '@leanix/reporting';

lx.init()
.then(function (setupInfo) {
  var config = {
    menuActions: {
      customDropdowns: [{
        id: 'SORT_DROPDOWN',
        name: 'SORT',
        entries: [
          {
            id: 'SORT_BY_NAME',
            name: 'By Name',
            callback: () => {
              console.log('Sort by name...');
            }
          },
          {
            id: 'SORT_BY_DATE',
            name: 'By Date',
            callback: () => {
              console.log('Sort by date...');
            }
          }
        ]
      }]
    }
  };
  lx.ready(config);
});
Views
You can use view information in your report, which allows you to classify Fact Sheets based on their attributes. The framework will display a dropdown menu with all available views for a specific Fact Sheet type. Whenever the user selects one of these views, the framework will pass the new view information down into your report, so that you can work with that information in your visualization.
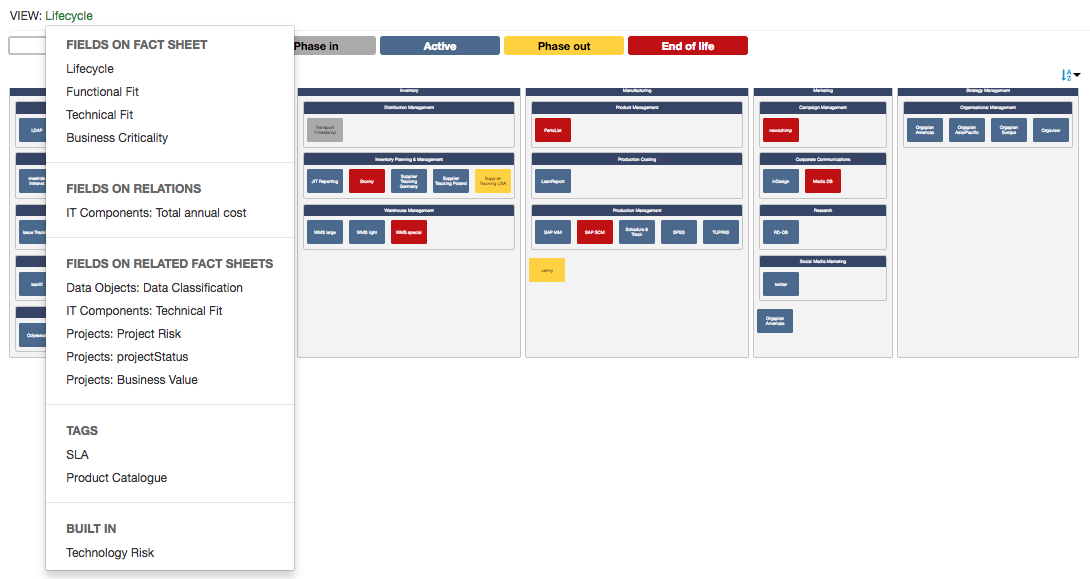
In this example we register a reportViewCallback with the config object. This tells the framework that we are interested in receiving view information. The framework will then show a dropdown to the user that allows him/her to select a view. The available views are determined by the reportViewFactSheetType.
The example code will log the background color for each Fact Sheet that is contained in the view information. In a real world scenario you would use these colours in the visualization of the report.
import '@leanix/reporting';

lx.init()
.then(function (setupInfo) {
  var config = {
    reportViewFactSheetType: 'Application',
    reportViewCallback: function (data) {
      // Build map from ledgendItem id to the item itself
      var ledgendItemMap = {};
      data.legendItems.forEach(item => { ledgendItemMap[item.id] = item; });

      // Print mappings
      data.mapping.map(fsMapping => {
        var ledgendItem = ledgendItemMap[fsMapping.legendId];
        console.log(`${fsMapping.fsId}: ledgendId=${fsMapping.legendId};bgColor=${ledgendItem.bgColor}`);
      });
    }
  };
  lx.ready(config);
});
Sample Report
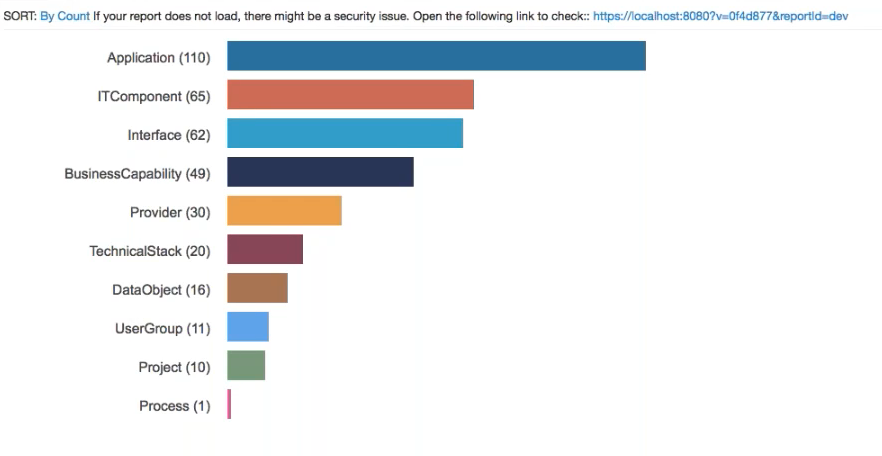
The purpose of this segment is to provide a developer with an idea of how custom reports are usually structured. The example used is the default bootstrap report, which is explained in the How to build custom reports section of our documentation. The outcome of the report is going to be a report showing all Fact Sheets sorted by count (see below).
General concepts of web development are not going to be inside the scope of this section.
There are a number of steps required in the development process:
A. Define which functionality of the Reporting Framework you require
B. Fetching the data from the LeanIX application
C. Transform the data according to the desired result
D. Define how the transformed data is to be displayed
Review framework functionalities
To ensure consistency and make it easier to build reports the LeanIX Reporting Framework offers a set of functionalities that are useful for building reports. We therefore advise getting an overview of the functionalities of the Reporting Framework before getting into the development of the report.
Fetch data
The report config is the central element of each report. It defines the interaction between the report and the main application. At this point, you have the possibility of requesting data from your LeanIX workspace. There is also the possibility of directly interacting with the GraphQL API, but we recommend to request data from your LeanIX workspace directly.
createConfig() {
    return {
      menuActions: {
        customDropdowns: this.createDropdownConfig()
      },
      facets: [{
        key: 'main',
        attributes: ['displayName', 'type', 'description'],
        callback: function (data) {
          this.data = data;
          this.groups = _.groupBy(data, 'type');
          this.render();
        }.bind(this)
      }]
    };
  }
The following code snippet highlights the interaction between framework and report. The customDropdown interface signals to the main application to enable the dropdown menu, the logic for the dropdown comes from the report though.
createDropdownConfig() {
    return [{
      id: ID_SORTING_DROPDOWN,
      name: 'SORT',
      entries: [
        {
          id: ID_SORTING_BY_NAME,
          name: 'By Name',
          callback: () => {
            this.sorting = ID_SORTING_BY_NAME;
          this.render();
          }
        },
        {
          id: ID_SORTING_BY_COUNT,
          name: 'By Count',
          callback: () => {
            this.sorting = ID_SORTING_BY_COUNT;
            this.render();
          }
        }
      ]
    }];
  }
Transform data and decide on a visualization
While usually logic and rendering are separate functions, in the following simple example they are in one function. Here you can see, how the fetched and grouped data is sorted and then passed to the HTML segment of the report.
render() {
    var fsTypes = _.keys(this.groups).sort(this.getSortComparer());
    var html = '<table>';
    for (var i = 0; i < fsTypes.length; i++) {
      html += this.getHtmlForFsTypeBar(fsTypes[i])
    }
    html += '</table>';
    html += '<div id="clickOutput"></div>';

    document.getElementById('report').innerHTML = html;

    $('.bar').on('click', (event) => {
      this.handleBarClick(event);
    });
  }
As a result, this example report shows a bar of each Fact Sheet type, sorted by count.
