
Learn how to use facets to filter data when building custom reports.
Overview
Fact sheets form the backbone of SAP LeanIX, serving as the primary source of information about your IT landscape. The ability to generate reports over various types of fact sheets offers organizations the flexibility to gain deeper insights into their IT environment.
Much like the inventory, custom reports in SAP LeanIX offer built-in capabilities to leverage existing filtering mechanisms. This allows for a more thorough and detailed overview of your IT landscape.
Facets are essential tools that provide granular control over the fact sheets retrieved. They offer the capability to create additional callbacks, serving custom business logic when filter changes occur. By using facets, you can not only refine the data you're pulling but also dynamically respond to changes in your selection criteria. This allows for more robust, responsive reporting that can adapt to your unique business needs.
In this tutorial, you'll learn how to create a report using the facet filtering feature of the LeanIX Reporting Framework. This report calculates the count of fact sheets and the average completion ratio for each fact sheet type defined in your workspace.
By the end of this tutorial, you'll be able to use facets in the LeanIX Reporting Framework to filter data when creating custom reports.
Prerequisites
Before you start, do the following:
- Get admin access to your SAP LeanIX workspace.
- Obtain an API token by creating a technical user. For more information, see Technical Users.
- Create a project skeleton structure using the scaffolder of the LeanIX Reporting CLI. To learn more, see Setting Up Your Custom Reports Project.
This tutorial assumes you have basic knowledge of:
- JavaScript
- Reports in SAP LeanIX
Step 1: Navigate to the Project Directory
To get started, navigate to the directory of your project skeleton using the following command:
cd custom-reports-demo
Step 2: Create a Custom Report Module
Create a new JavaScript module named facets.js in the src directory and insert the following code into it. This module exports the FactSheetCompletionReport class, which retrieves workspace data using facet filters.
/**
 * Tutorial: Using Facets
 */
export class FactSheetCompletionReport {
  /**
   * Create a FactSheetCompletionReport instance.
   * @param {Object} setup - The setup configuration.
   */
  constructor(setup) {
    this.setup = setup;
  }

  /**
   * Calculate the average completion for each Fact Sheet of a specific type.
   * @param {Array} factSheets - The fact sheets to calculate average completion for.
   * @return {string} The average completion as a percentage string.
   */
  calculateFactSheetCompletion(factSheets) {
    const averageSum = factSheets.reduce((sum, { completion }) => sum + completion.completion,0);
    const averageCompletion = averageSum ? (averageSum / factSheets.length) * 100 : 0;
    return `${averageCompletion.toFixed(2)}%`;
  }

  /**
   * Create a configuration object according to the reporting frameworks specification.
   * @return {Object} The configuration object.
   */
  createConfig() {
    return {
      facets: [{
        key: 'main',
        attributes: ['completion { completion }'],
        callback: this.render.bind(this)
      }]
    };
  }

  /**
   * Render the data returned from the request.
   * Create a div element and render the `averageCompletion` and the `factSheetCount`.
   * @param {Array} data - The data to render.
   */
  render(data) {
    // Calculate the total number of Fact Sheets returned.
    const factSheetCount = data.length;
    // Calculate the average completion percentage for the Fact Sheets returned
    const averageCompletion = this.calculateFactSheetCompletion(data);

    // Create main HTML container
    const container = document.createElement('div');
    container.classList.add('grid', 'grid-cols-2', 'gap-2')

    // Create and append fact sheet count HTML element
    const factSheetCountDiv = this.createDiv(`<p class="text-center"><strong>Fact Sheet Count</strong></p><p class="text-center">${factSheetCount}</p>`);
    container.appendChild(factSheetCountDiv);

    // Create and append average completion HTML element
    const averageCompletionDiv = this.createDiv(`<p class="text-center"><strong>Average Completion</strong></p><p class="text-center">${averageCompletion}</p>`);
    container.appendChild(averageCompletionDiv);

    // Clear existing content and append the new content
    const report = document.getElementById('report');
    report.innerHTML = '';
    report.appendChild(container);
  }

    /**
   * Create a div with specific styling applied.
   * @param {data} - The data to render within the div element.
   * @return {HTMLElement} The fact sheet div.
   */
  createDiv(data) {
      // Create main div for the fact sheet
      const itemDiv = document.createElement('div');
      itemDiv.classList.add('rounded-lg', 'p-2', 'bg-gray-200');
      itemDiv.innerHTML = data;
      return itemDiv;
  }
}
This sample script employs facet filtering to calculate the count of fact sheets and the average completion score for each fact sheet type. It displays a basic div element that includes the number of fact sheets of each type and the average completion score for each fact sheet type.
Step 3: Import Facets into the Main Module
Open the generated index.js file of your project skeleton and replace the code with the following:
// Importing '@leanix/reporting' makes the `lx` object globally available.
import '@leanix/reporting';
// Import CSS assets for the custom report.
import './assets/main.css';
// Import our custom report module.
import { FactSheetCompletionReport } from './facets.js'

/**
 * Initialize the LeanIX reporting framework and create the report.
 *
 * The `lx.init()` method signals the reporting framework to begin report initialization.
 * It returns a promise, which gets resolved once the initialization process is complete.
 */
lx.init().then((setup) => {
  // Once initialization completes, we receive a `setup` object with LeanIX
  // data for our report. Next, we construct the report object and configure it.
  const report = new FactSheetCompletionReport(setup);
  const config = report.createConfig();

  // Pass the finalized configuration object to `lx.ready()` function,
  // notifying LeanIX that our report is prepared to receive and process data.
  lx.ready(config);
});
Step 4: Start the Development Server
Once you've imported FactSheetCompletionReport into the main module, you can start the development server. Run the following command:
npm start
A new tab opens in your browser displaying your custom report in the Reports section within your SAP LeanIX environment. If the tab doesn't open, the command provides a link that you can copy and then paste into the address bar of your browser.
The following image shows the outcome of the script used in this tutorial.
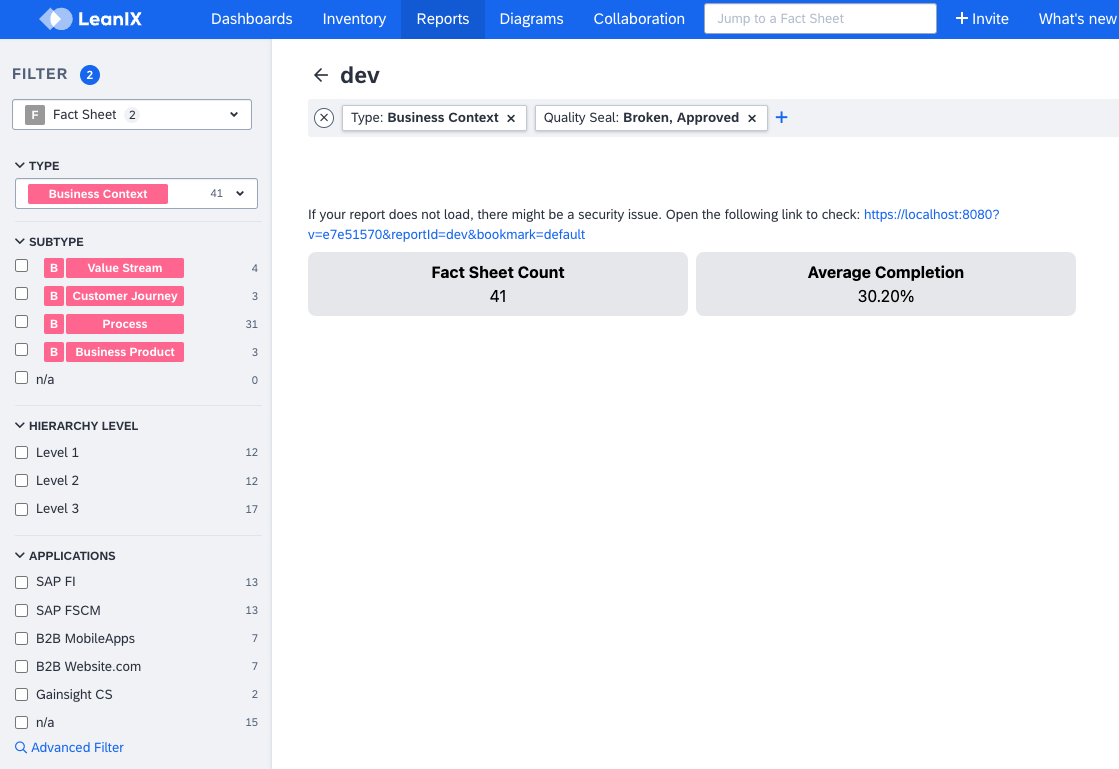
Custom Report That Shows the Fact Sheet Count and the Average Completion Score
Step 5: Use Filters in the Filter Sidebar
Filters located in the filter sidebar within the Reports section of the SAP LeanIX user interface enable you to customize the data shown in your custom reports. By using these filters, you can dynamically modify the data that populates your custom report, thereby ensuring that the report accurately represents the insights you're seeking.
Experiment with these filters to see how they impact the data shown in your custom report.
Summary
In this tutorial, we explored how to use facets in the LeanIX Reporting Framework to filter data when creating a custom report. You learned how to:
- Use the
attributesfield within facets to extract thecompletionattribute from thecompletionobject of fact sheets - Calculate the average completion score for each fact sheet type, which is important for data analysis
- Use filters located in the filter sidebar within the Reports section of the SAP LeanIX user interface, which enables you to interact with the data available in the LeanIX Reporting Library, allowing for dynamic data manipulation