
Learn how to use GraphQL queries when creating custom reports.
Overview
GraphQL provides a high degree of flexibility, enabling you to customize queries to meet your exact requirements and retrieve specific data without over-fetching or under-fetching. When integrated with the LeanIX Reporting Library, it facilitates the creation of custom reports that are both efficient and tailored to your unique needs.
In this tutorial, you'll learn how to create a custom report using GraphQL queries with the LeanIX Reporting SDK. Specifically, we'll use the lx.executeGraphQL method, which allows you to run custom GraphQL queries directly. This report calculates the count of fact sheets and the average completion ratio for each fact sheet type defined in your workspace.
Prerequisites
Before you start, do the following:
- Get admin access to your SAP LeanIX workspace.
- Obtain an API token by creating a technical user. For more information, see Technical Users.
- Create a project skeleton structure using the scaffolder of the LeanIX Reporting CLI. To learn more, see Setting Up Your Custom Reports Project.
This tutorial assumes you have basic knowledge of:
- JavaScript
- GraphQL
- SAP LeanIX GraphQL API
- Reports in SAP LeanIX
Step 1: Navigate to the Project Directory
To get started, navigate to the directory of your project skeleton using the following command:
cd custom-reports-demo
Step 2: Create a Custom Report Module
Create a new JavaScript module named graphql.js in the src directory and insert the following code into it. This module exports the FactSheetCompletionReport class, which retrieves workspace data using facet filters.
/**
 * Tutorial: Using GraphQL
 */
export class GraphQLFactSheetCompletionReport {
  /**
   * Create a GraphQLFactSheetCompletionReport instance.
   * @param {Object} setup - The setup configuration.
   */
  constructor(setup) {
    this.setup = setup;
  }

  /**
   * Calculate the average completion for each Fact Sheet of a specific type.
   * @param {Array} factSheets - The fact sheets to calculate average completion for.
   * @return {string} The average completion as a percentage string.
   */
  calculateFactSheetCompletion(factSheets) {
    const average = (factSheets.reduce((sum, edge) => sum + edge.node.completion.completion, 0) / factSheets.length) * 100;
    return `${average.toFixed(2)}%`;
  }

  /**
   * Create a configuration object according to the reporting frameworks specification.
   * @return {Object} The configuration object.
   */
    createConfig() {
      return {
        facets: [{
          facetFiltersChangedCallback: this.createReport.bind(this)
        }]
      };
    }

  testme(filter) {
    console.log(filter);
  }
  /**
   * Retrieves GraphQL data from the LeanIX GraphQL API and generates the report.
   * @returns {Promise<void>}
   */
  async createReport(filters) {
    // Extract filters with default values if not provided
    const {
      facets: facetFilters = [],
      fullTextSearchTerm: fullTextSearch = '',
      directHits = [],
    } = filters;

    // Build GraphQL filters, handling potential undefined values
    const qlFilters = {
      facetFilters: facetFilters?.length > 0 ? facetFilters : undefined,
      fullTextSearch: fullTextSearch?.trim() ? fullTextSearch : undefined,
      ids: directHits.length > 0 ? directHits.map(({ id }) => id) : undefined,
    };
    // Define the GraphQL query
    const query = `
    query allFactSheetsQuery($filter:FilterInput!){
      allFactSheets(filter:$filter) {
        edges {
          node {
            name
            completion {
              completion
            }
          }
        }
      }
    }`;
    // Execute the GraphQL query and await the response
    const response = await lx.executeGraphQL(query, qlFilters ? { filter: qlFilters } : {});
    // Render the data (assuming 'render' is a method that handles rendering)
    this.render(response?.allFactSheets?.edges);
  }

  /**
   * Render the data returned from the request.
   * Create a div element and render the `averageCompletion` and the `factSheetCount`.
   * @param {Array} data - The data to render.
   */
  render(data) {
    // Calculate the total number of Fact Sheets returned.
    const factSheetCount = data.length;
    // Calculate the average completion percentage for the Fact Sheets returned
    const averageCompletion = this.calculateFactSheetCompletion(data);

    // Create main HTML container
    const container = document.createElement('div');
    container.classList.add('grid', 'grid-cols-2', 'gap-2')

    // Create and append fact sheet count HTML element
    const factSheetCountDiv = this.createDiv(`<p class="text-center"><strong>Fact Sheet Count</strong></p><p class="text-center">${factSheetCount}</p>`);
    container.appendChild(factSheetCountDiv);

    // Create and append average completion HTML element
    const averageCompletionDiv = this.createDiv(`<p class="text-center"><strong>Average Completion</strong></p><p class="text-center">${averageCompletion}</p>`);
    container.appendChild(averageCompletionDiv);

    // Clear existing content and append the new content
    const report = document.getElementById('report');
    report.innerHTML = '';
    report.appendChild(container);
  }

  /**
 * Create a div with specific styling applied.
 * @param {data} - The data to render within the div element.
 * @return {HTMLElement} The fact sheet div.
 */
  createDiv(data) {
    // Create main div for the fact sheet
    const itemDiv = document.createElement('div');
    itemDiv.classList.add('rounded-lg', 'p-2', 'bg-gray-200');
    itemDiv.innerHTML = data;
    return itemDiv;
  }
}
This script uses GraphQL queries to fetch data from your SAP LeanIX workspace, which is then used to calculate the count of fact sheets of the specified type and the average completion score of the associated child fact sheets. After completing this tutorial, you'll see that the outcome aligns perfectly with the result that we achieved using facets available within the LeanIX Reporting SDK. To learn more about using facets, see Filtering in Custom Reports.
It's important to highlight a significant difference between GraphQL queries and facet filters available within the LeanIX Reporting SDK.
When using GraphQL, it's necessary to incorporate the facetFiltersChangedCallback callback to ensure that the retrieved data reflects the selected filters. This callback is triggered every time a user interacts with filters in the filter sidebar within the Reports section.
In contrast, when using facet filters, this functionality is automatically handled by the LeanIX Reporting Library, requiring no additional implementation on your end. This distinction underlines the added layer of manual intervention required when using GraphQL, even though it provides more granular control over data retrieval.
Step 3: Import GraphQLFactSheetCompletionReport into the Main Module
Open the generated index.js file of your project skeleton and replace the code with the following:
// Importing '@leanix/reporting' makes the `lx` object globally available.
import '@leanix/reporting';
// Import CSS assets for the custom report.
import './assets/main.css';
// Import our custom report module.
import { GraphQLFactSheetCompletionReport } from './graphql.js'

/**
 * Initialize the LeanIX reporting framework and create the report.
 *
 * The `lx.init()` method signals the reporting framework to begin report initialization.
 * It returns a promise, which gets resolved once the initialization process is complete.
 */
lx.init().then((setup) => {
  // Once initialization completes, we receive a `setup` object with LeanIX
  // data for our report. Next, we construct the report object and configure it.
  const report = new GraphQLFactSheetCompletionReport(setup);
  const config = report.createConfig();

  // Pass the finalized configuration object to `lx.ready()` function,
  // notifying LeanIX that our report is prepared to receive and process data.
  lx.ready(config);
  // Since we are using GraphQL queries we need to manuall call for the data.
  report.createReport();
});
A notable difference compared to facet filtering is the need to manually invoke the retrieval of the initial data set using report.createReport(). In contrast, when using facet filtering, the initial data fetching is automatically handled by the LeanIX Reporting Library. This distinction highlights the greater control you have with manual calls, but also the added responsibility to ensure the proper initiation of data retrieval.
Step 4: Start the Development Server
Once you've imported GraphQLFactSheetCompletionReport into the main module, you can start the development server. Run the following command:
npm start
A new tab opens in your browser displaying your custom report in the Reports section within your SAP LeanIX environment. If the tab doesn't open, the command provides a link that you can copy and then paste into the address bar of your browser.
The following image shows the outcome of the script used in this tutorial.
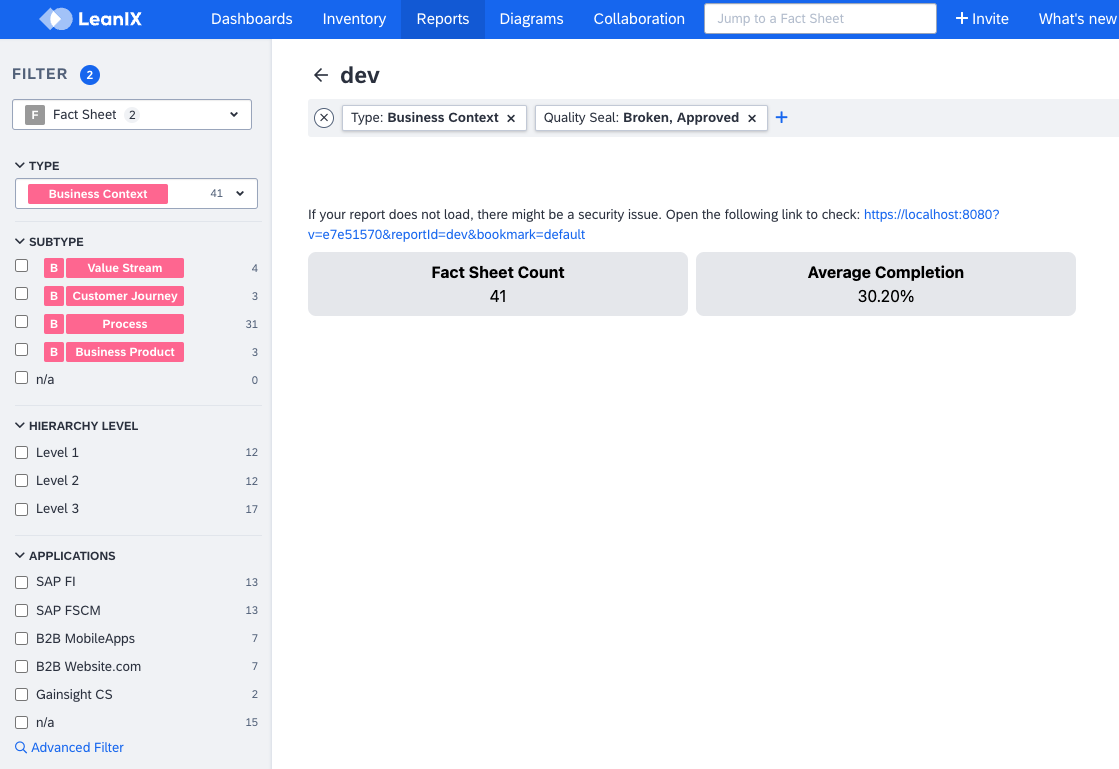
Custom Report That Shows the Fact Sheet Count and the Average Completion Score
Summary
In this tutorial, we explored how to use GraphQL queries when creating a custom report. You learned how to:
- Use the
lx.executeGraphQLmethod of the LeanIX Reporting Library, which enables you to run custom GraphQL queries - Calculate the average completion score for each fact sheet type, which is important for data analysis