
Learn how to create a custom matrix report showing the lifecycle phases of application fact sheets.
Overview
By visualizing the lifecycle phases of application fact sheets through a matrix report, you can identify outdated technologies, plan upgrades, and manage risks related to obsolete systems.
In this tutorial, you'll learn how to create a custom matrix report showing the lifecycle phases of application fact sheets along with their start dates.
To build a lifecycle matrix report, we'll use the facet filter data fetching interface provided by the LeanIX Reporting Library. We'll use the fixedFactSheetType attribute to limit data to the Application fact sheet type.
To visually differentiate the various application lifecycle phases, we'll extract the color code associated with each phase from the setup object of the workspace view model. This enables us to assign unique color codes to each phase, enhancing the visual clarity and interpretability of our application lifecycle matrix.
Prerequisites
Before you start, do the following:
- Get admin access to your SAP LeanIX workspace.
- Obtain an API token by creating a technical user. For more information, see Technical Users.
- Create a project skeleton structure using the scaffolder of the LeanIX Reporting CLI. To learn more, see Setting Up Your Custom Reports Project.
This tutorial assumes you have basic knowledge of:
- JavaScript
- Reports in SAP LeanIX
Step 1: Navigate to the Project Directory
To get started, navigate to the directory of your project skeleton using the following command:
cd custom-reports-demo
Step 2: Create a Custom Report Module
Create a new JavaScript module named matrixReport.js in the src directory and insert the following code into it. This module exports the MatrixReport class, which retrieves workspace data using facet filters.
// Importing '@leanix/reporting' makes the `lx` object globally available
// `lx` provides the core API to the LeanIX custom reporting library.
import "@leanix/reporting";

export class ApplicationMatrixReport {
  /**
   * Initializes the ApplicationMatrixReport class.
   * Restricts the report to the Application Fact Sheet type, retrieves
   * the data and loops over each application fact sheet to generate
   * a matrix report of the lifecycle phases and the relevant dates.
   * @param {Object} setup - The setup configuration.
   */
  constructor(setup) {
    this.setup = setup;
    this.applicationLifecyclePhases = {};
    this.translations = [];
    this.baseUrl = this.setup.settings.baseUrl;
    this.fsType = "Application";
    this.reportContainer = null;
    this.retrieveApplicationViewModel();
    this.gridCols = Object.keys(this.applicationLifecyclePhases).length + 1;
    this.setupMatrixGrid();
  }

  /**
   * Create a div with given content and classes
   * @param {string} content - The text content of the div
   * @param {string[]} classes - The class or classes to add to the div
   * @returns {HTMLDivElement} The created div
   */
  createDiv(content = null, classes = []) {
    const div = document.createElement("div");
    if (content) {
      div.textContent = content || null;
    }
    div.classList.add(...classes);
    return div;
  }

  /**
   * Sets up the grid container for the application report.
   * This function clears the existing content within the provided data container element,
   * creates a new div element for the report, appends it to the data container,
   * and then calls the `createMatrixHeader` function to generate the header row.
   */
  setupMatrixGrid() {
    const dataContainer = document.getElementById("report");
    dataContainer.innerHTML = "";
    this.reportContainer = this.createDiv();
    dataContainer.appendChild(this.reportContainer);
    this.createMatrixHeader(this.reportContainer);
  }

  /**
   * Retrieves the view model for the Application Fact Sheet, this includes
   * the `bgColor` and `color` properties which are going to be used later.
   */
  retrieveApplicationViewModel() {
    const applicationLifecyclePhases =
      this.setup.settings.viewModel.factSheets.find(
        ({ type }) => type === this.fsType
      );
    this.applicationLifecyclePhases =
      applicationLifecyclePhases.fieldMetaData.lifecycle.values;
  }

  /**
   * Creates a configuration object according to the reporting
   * frameworks specification.
   */
  createConfig() {
    return {
      facets: [
        {
          key: 1,
          fixedFactSheetType: this.fsType,
          attributes: [
            "name",
            "type",
            "lifecycle {asString phases {phase startDate}}",
          ],
          callback: this.render.bind(this),
        },
      ],
    };
  }

  /**
   * Translate the lifecycle phase of an application
   * @param {string} lifecyclePhase - The lifecycle phase to translate
   * @returns {string} The translated lifecycle phase, or 'n/a' if the translation doesn't exist
   */
  translateLifecyclePhase(lifecyclePhase) {
    return (
      lx.translateFieldValue(this.fsType, "lifecycle", lifecyclePhase) ?? "n/a"
    );
  }

  /**
   * Create the matrix header and append it to the given container
   * @param {HTMLElement} dataContainer - The container to append the header to
   */
  createMatrixHeader(dataContainer) {
    // Create a `div` element for the lifecycle report header.
    const matrixHeaderGrid = this.createDiv(null, [
      "grid",
      `grid-cols-${this.gridCols}`,
      "gap-4",
      "sticky",
      "top-0",
    ]);
    // Create an empty div for the Application name column
    matrixHeaderGrid.appendChild(
      this.createDiv("Application Name", [
        "font-lg",
        "font-bold",
        "text-center",
        "p-1",
        "bg-neutral-300",
        "rounded-md",
      ])
    );
    // Loop through the lifecycle phases and create the headers
    Object.keys(this.applicationLifecyclePhases).forEach((lifecycle) => {
      const lifeCycleDiv = this.createDiv(
        this.translateLifecyclePhase(lifecycle),
        [
          "font-lg",
          "font-bold",
          "text-center",
          "p-1",
          `bg-[${this.applicationLifecyclePhases[lifecycle].bgColor}]/90`,
          "rounded-md",
        ]
      );
      // Add the lifecycle phase column div
      matrixHeaderGrid.appendChild(lifeCycleDiv);
    });
    // Append the header grid to the container
    dataContainer.appendChild(matrixHeaderGrid);
  }

  /**
   * Create a matrix of applications and their lifecycle phases
   * @param {HTMLElement} reportContainer - The container to append the matrix to
   * @param {Array} applications - The list of applications to include in the matrix
   */
  createMatrix(reportContainer, applications) {
    applications.forEach((application) => {
      const applicationContainer = this.createDiv(null, [
        "grid",
        `grid-cols-${this.gridCols}`,
        "gap-4",
        "my-2",
      ]);
      applicationContainer.appendChild(this.createDiv(application.name));
      this.renderLifecyclePhases(application, applicationContainer);
      reportContainer.appendChild(applicationContainer);
    });
  }

  /**
   * Render the lifecycle phases of an application
   * @param {Object} application - The application to render the phases for
   * @param {HTMLElement} applicationContainer - The container to append the phases to
   */
  renderLifecyclePhases(application, applicationContainer) {
    Object.keys(this.applicationLifecyclePhases).forEach((lifecycle) => {
      const phaseObj = application?.lifecycle?.phases.find(
        (phase) => phase.phase == lifecycle
      );
      const phaseStartDate = phaseObj?.startDate;
      const startDateDiv = this.createDiv(phaseStartDate || "n/a", [
        "font-semibold",
        "text-center",
        "p-1",
        "rounded-md",
      ]);
      if (phaseStartDate) {
        startDateDiv.classList.add(
          `bg-[${this.applicationLifecyclePhases[lifecycle].bgColor}]/50`
        );
      } else {
        startDateDiv.classList.add("bg-neutral-200");
      }
      applicationContainer.appendChild(startDateDiv);
    });
  }

  /**
   *
   * Renders the matrix table of the report.
   */
  render(data) {
    this.createMatrix(this.reportContainer, data);
  }
}
The script shows how to use facet filtering to retrieve fact sheets of the Application type. We also retrieve the lifecycle object. Within this object, we access the asString attribute that represents the current lifecycle phase. Additionally, we obtain the application lifecycle phases along with their corresponding startDate, which indicates the start dates of each phase.
Step 3: Import Facets into the Main Module
Open the generated index.js file of your project skeleton and replace the code with the following:
// Importing '@leanix/reporting' makes the `lx` object globally available
import '@leanix/reporting';
// Import css assets for the custom report.
import './assets/main.css';
// Import our custom report module.
import { ApplicationMatrixReport } from './matrixReport.js';

// Invoke the `lx.init()` method to signal the reporting framework to begin
// report initialization.
// `init()` returns a promise, which gets resolved once the initialization
// process is complete.
lx.init().then(function (setup) {
  // Once initialization completes, we receive a `setup` object with LeanIX
  // data for our report. Next, we construct the report object and configure it.
  let report = new ApplicationMatrixReport(setup);
  let config = report.createConfig();

  // Pass the finalized configuration object to `lx.ready()` function,
  // notifying LeanIX that our report is prepared to receive and process data.
  lx.ready(config);
});
Step 4: Update HTML Content
To ensure that the matrix report is rendered properly, incorporate additional HTML elements into the structure of your custom reports project. To do that, open the index.html file within your project directory and replace the pregenerated HTML content with the following:
<!DOCTYPE html>
<html>
  <head>
    <meta charset="utf-8" />
    <meta name="viewport" content="width=device-width, initial-scale=1" />

    <meta name="application-name" content="LeanIX Custom Report Demo" />
    <meta name="description" content="This is a custom reports demo" />
    <meta name="author" content="LeanIX" />
    <title>Application Lifecycle Matrix Report</title>
  </head>
  <body>
    <div class="container mx-auto text-md text-gray-800">
      <!-- report container -->
      <div id="report"></div>
    </div>
  </body>
</html>
Step 5: Start the Development Server
Once you've updated HTML content, you can start the development server. Run the following command:
npm start
A new tab opens in your browser displaying your custom report in the Reports section within your SAP LeanIX environment. If the tab doesn't open, the command provides a link that you can copy and then paste into the address bar of your browser.
The following image shows the outcome of the script used in this tutorial.
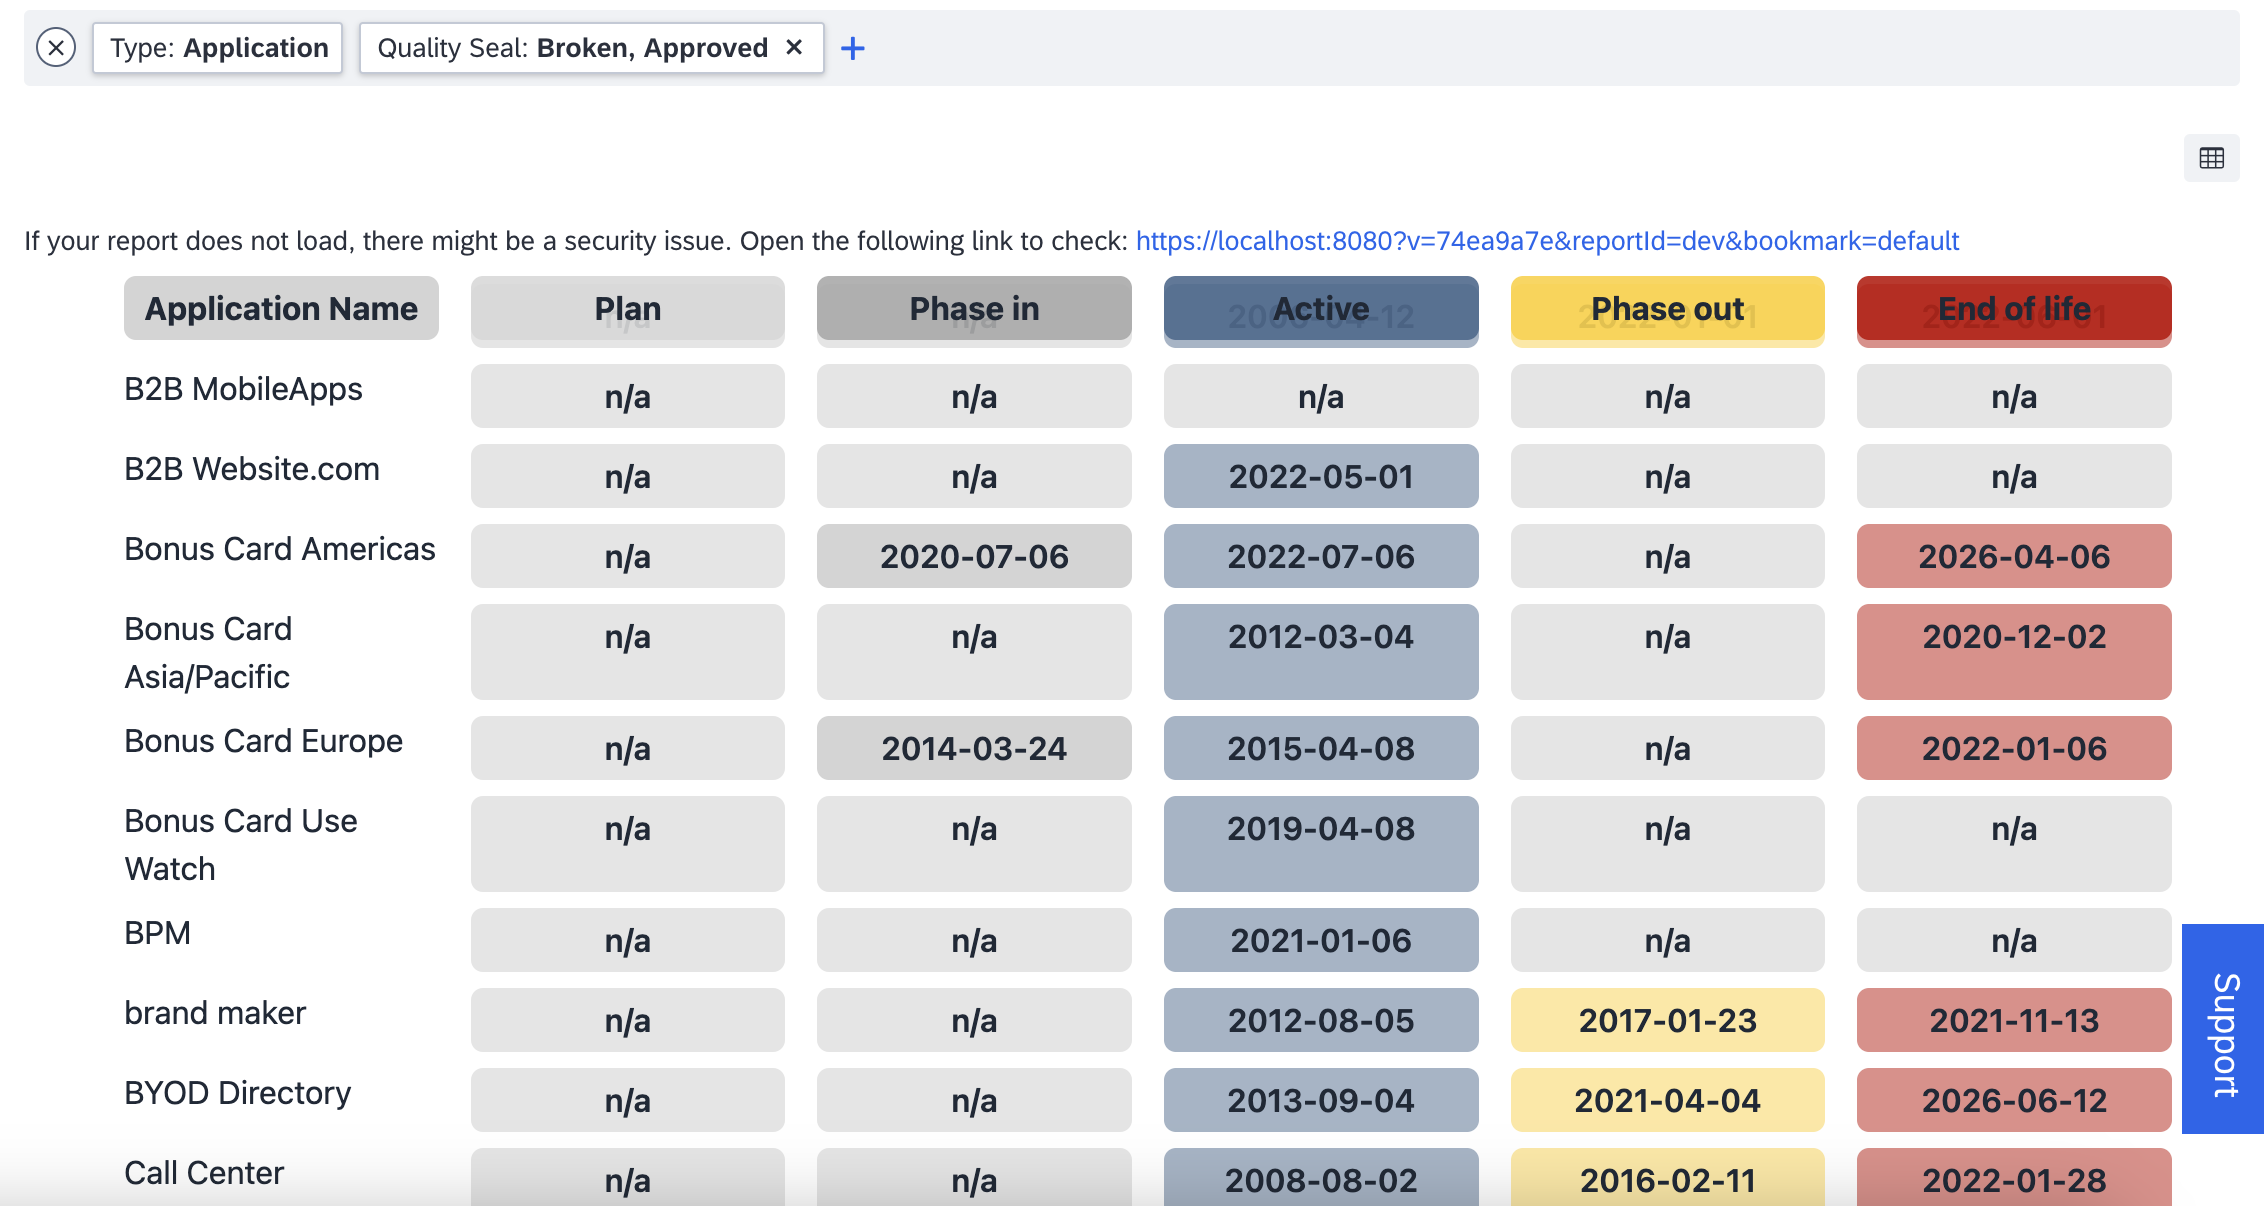
Custom Lifecycle Matrix Report for Application Fact Sheets
Summary
This tutorial provided detailed guidance on how to create a custom matrix report showing the lifecycle phases of application fact sheets. You learned how to:
- Use the fixedFactSheetType option to restrict data retrieval to a specific fact sheet type
- Use the
setupobject that contains information about your workspace and meta model configuration - Incorporate additional HTML elements into the structure of your custom reports project to ensure that your custom report is rendered properly