Former Diagrams Editor
Visualize the data flow between your Applications, Interfaces and the protocols used to exchange data.
Create a new diagram
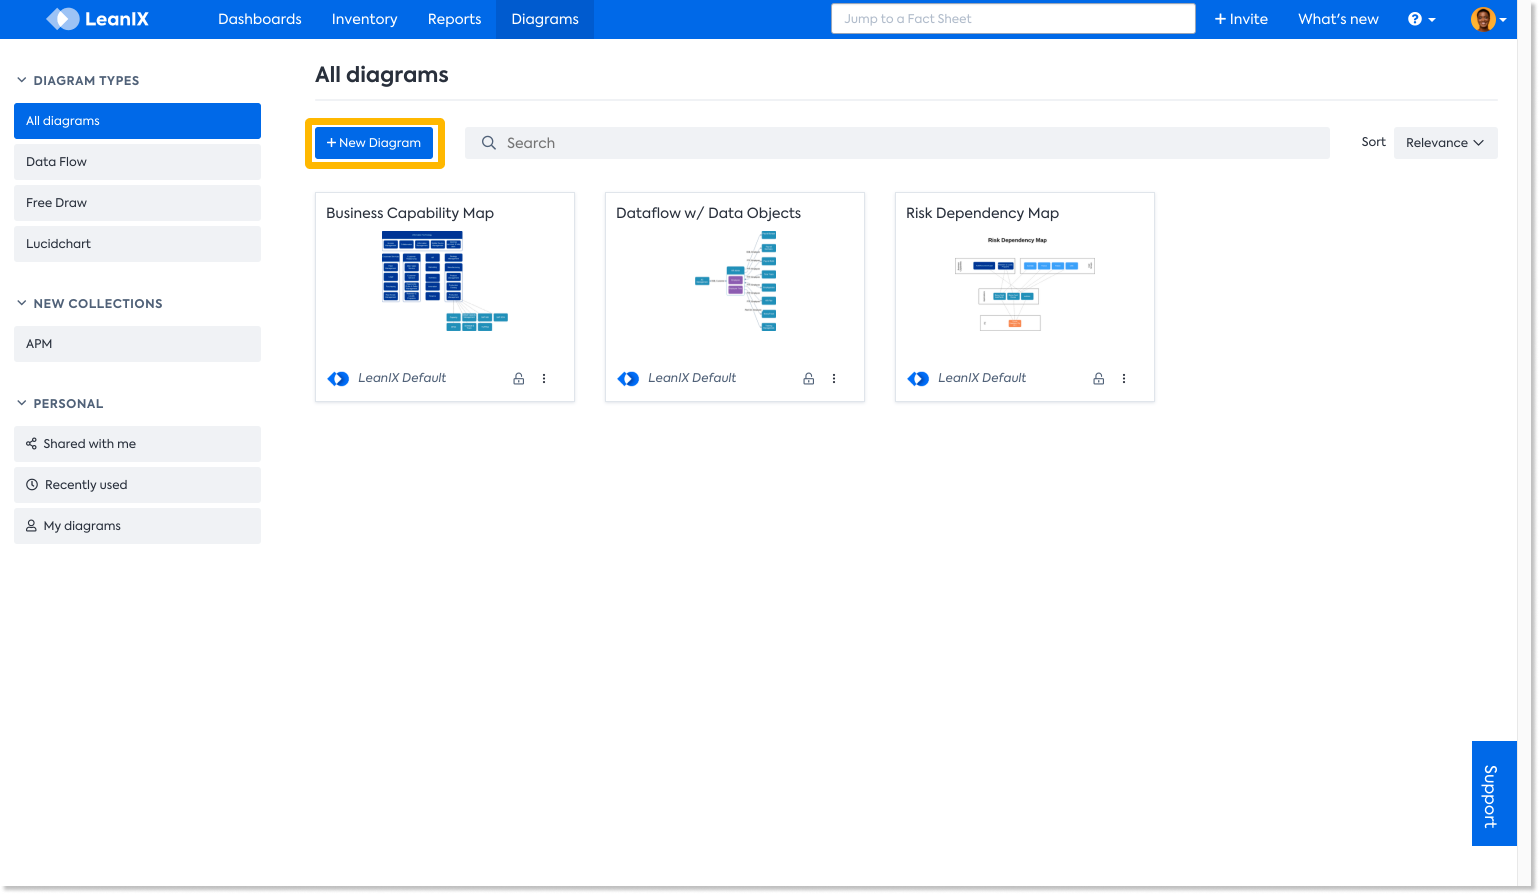
To start creating a new diagram, select the Diagrams tab, go to Create new diagram and choose a diagram type.
Information
Admins can utilize the Collections feature to better manage the groups of diagrams on the left navigation panel. The Collections feature introduces individual categories among reports and diagrams. Check out the Collections page on how to manage these categories.
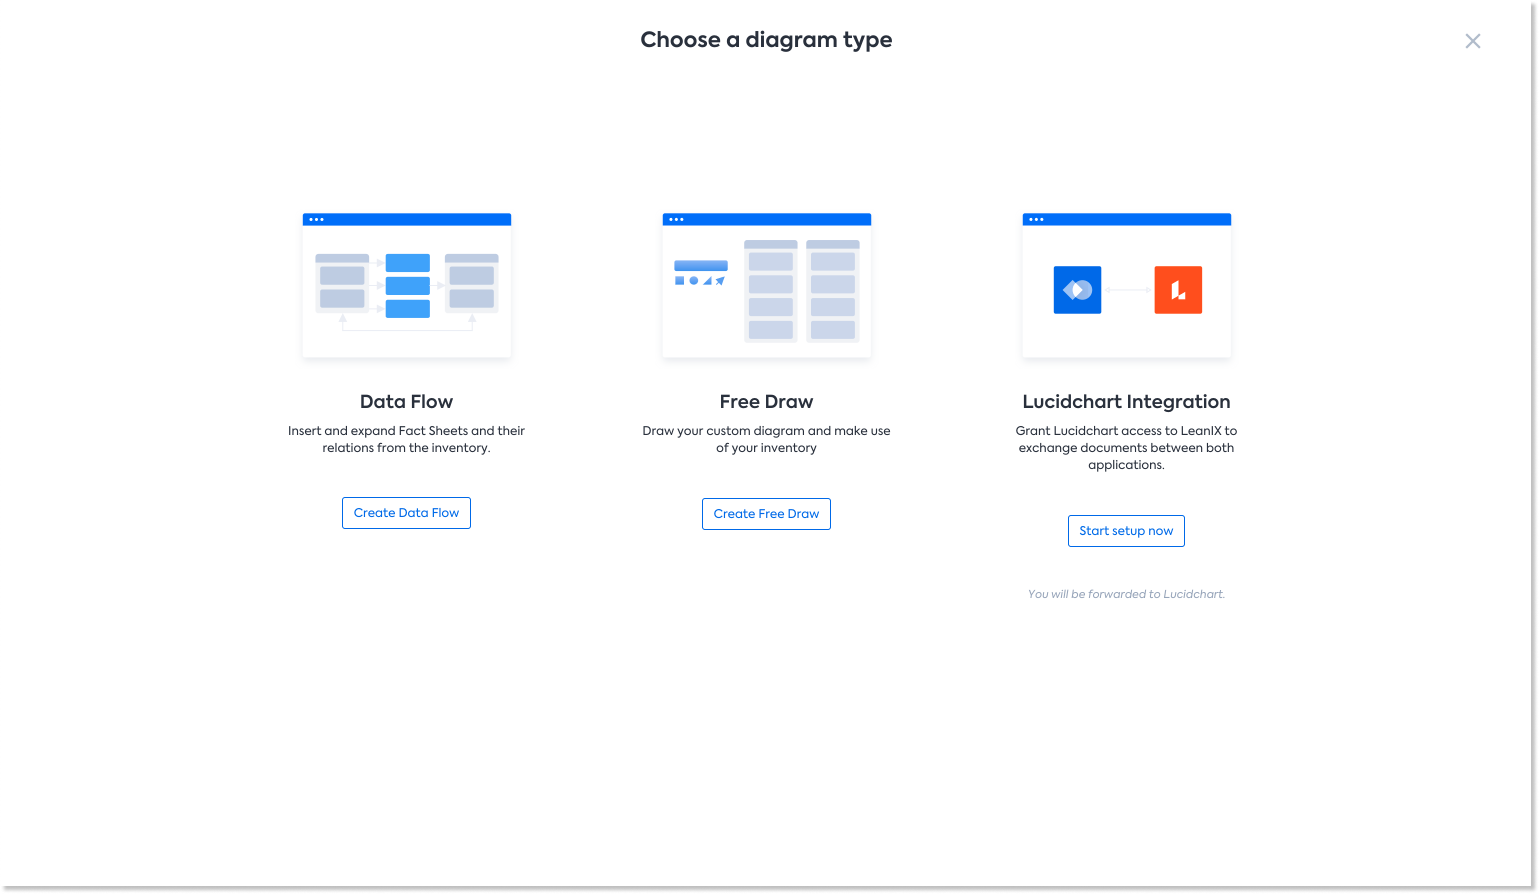
There are three types of diagrams that allow you to visualize your data flow:
-
With Free Draw you can draw your custom report and make use of live data from your Inventory.
-
A Data Flow diagram is a way to insert and expand applications and traverse their interfaces to understand the flow of data in your environment.
-
If you already have a Lucidchart account, you are able to create a new diagram using this integration and link it automatically back to LeanIX.
Data Flow Diagrams automatically add the respective parents of added Fact Sheets
To simplify the usage of Data Flow diagrams, the upper hierarchies of Application Fact Sheets (parents) are automatically included when adding a Fact Sheet. This saves time when trying to display the data flow between related Applications and helps to fully expose hierarchies and connections. You may also notice that dragging Fact Sheets around is more rigid than in the Free Draw, this again was intentionally added to support a clear structure in Data Flow diagrams.
Note: You can also save diagrams for permanent use (see section "Save Diagrams- Do not lose your changes). Please note that a diagram always represents the view when it was saved "last-time-saved view". This might differ from a current view of the architecture, if changes to the architecture happened after the diagram was saved (see below "Check for updates" how to refresh the view).
Free Draw
Fact Sheet and Relation Creation are only available in Free Draw
Although we envision enabling the creation of Applications and Interfaces directly from the Data Flow diagram as well, this is currently not yet available.
In Free Draw diagrams, you can use any of the available shapes to create new Fact Sheets and/or link any of the shapes in the diagram to existing Fact Sheets in your Inventory.
Creating New Fact Sheets Using Shapes
- Left-click or drag-and-drop any shape from the side panel into the canvas.
- Right-click on the shape, and select "Create new Fact Sheet" > select the Fact Sheet type you would like to convert your shape to
- Edit the shape text. The text that you provide within the shape will serve as the new Fact Sheet name.
Information
Note, that a default naming scheme will be applied to the shapes if no custom name is provided (i.e. "User Group 1", "User Group 2", "User Group 3", etc.)
-
To add your newly created Fact Sheet to the Inventory, click the "Updates" link in the top right corner. Then click "Add".
-
New Fact Sheet has now been added to the Inventory and a confirmation message will now display.
After the Fact Sheet has been added to the Inventory, you can navigate to it in LeanIX by right-clicking it and clicking "Open Fact Sheet".
Linking Shapes to Existing Fact Sheets in the Inventory
- In the "Free Draw" diagram of choice, right-click on any of the shapes in the diagram.
- Select "Link to Fact Sheet"
- From the explorer, select a Fact Sheet that you would like to, and hit "Insert selected".
Be careful with linking shapes to the existing Fact Sheets
Please note that after a shape has been linked to a Fact Sheet, there will be no visual indicator provided to alert you that this shape is linked. Therefore, make sure that your shapes are labeled appropriately.
Creating Relations Between Fact Sheets
If you have more than one Fact Sheet in the diagram, you can establish relations between them by joining them with any connector shape (e.g. arrows, dotted lines, etc.)
Types of connections
The type of connections that you will be able to establish between Fact Sheets will depend on the types of Fact Sheets that you are trying to connect.
Listed below are some examples of the types of relations that can be established when joining different types of Fact Sheets:
Connecting Business Capabilities with Applications:
- Requires
- Requires by
- Business Capability to Application
Connecting Business Capabilities with User Groups:
- Requires
- Requires by
Connecting Business Capabilities with Processes:
- Requires
- Requires by
- Business Capability to Process
Updates with Inventory
In this section, we outline a few points about the kinds of behaviors to expect when trying to sync your Free Draw diagrams with the Inventory data.
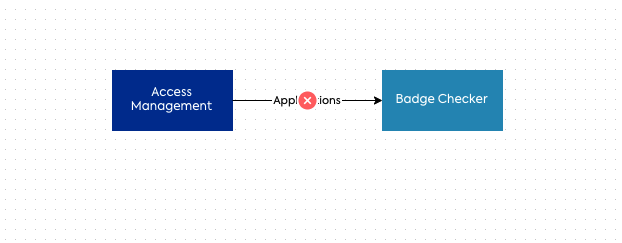
- Removing a Fact Sheet from the Inventory: if a Fact Sheet has been removed from the Inventory but is still being referenced in a diagram, an icon will appear on the Fact Sheet to inform you of this (see screenshot below). Make sure to update your diagram via the "Updates" link if this happens.

- Removing relations from the inventory: if Relations are being deleted from the Inventory, they will be marked for removal in the diagram as well (see screenshot below).
-
Deleting a Fact Sheet from a diagram: will not automatically remove the Fact Sheet from the LeanIX Inventory. If you wish to remove this Fact Sheet completely, please open it in the Inventory, and delete it from there.
-
Removing a connection between Fact Sheets: does not automatically update relations between the Fact Sheets at the Fact Sheet level. To update the relations at the Fact Sheet level, you have to manually navigate to the desired Fact Sheet(s) and remove any unwanted relations.
-
Fact Sheet appearance in the diagram: names and Fact Sheet colors are automatically updated with the information from the inventory. This also applies to the Views. If you have applied a view to the diagram, e.g. Lifecycle, and the lifecycle of the Fact Sheet changes in the inventory, the color of the corresponding shape in the diagram is automatically adjusted.
Business Capability report with Free Draw
You can build a custom Business Capability report from scratch using Free Draw
In the "Create new diagram" pop-up scree select "Free Draw".
Click on the blue plus sign to insert elements of your cluster. The Select button can be used to select several Fact Sheets which are already in your diagram to e.g. highlight them.
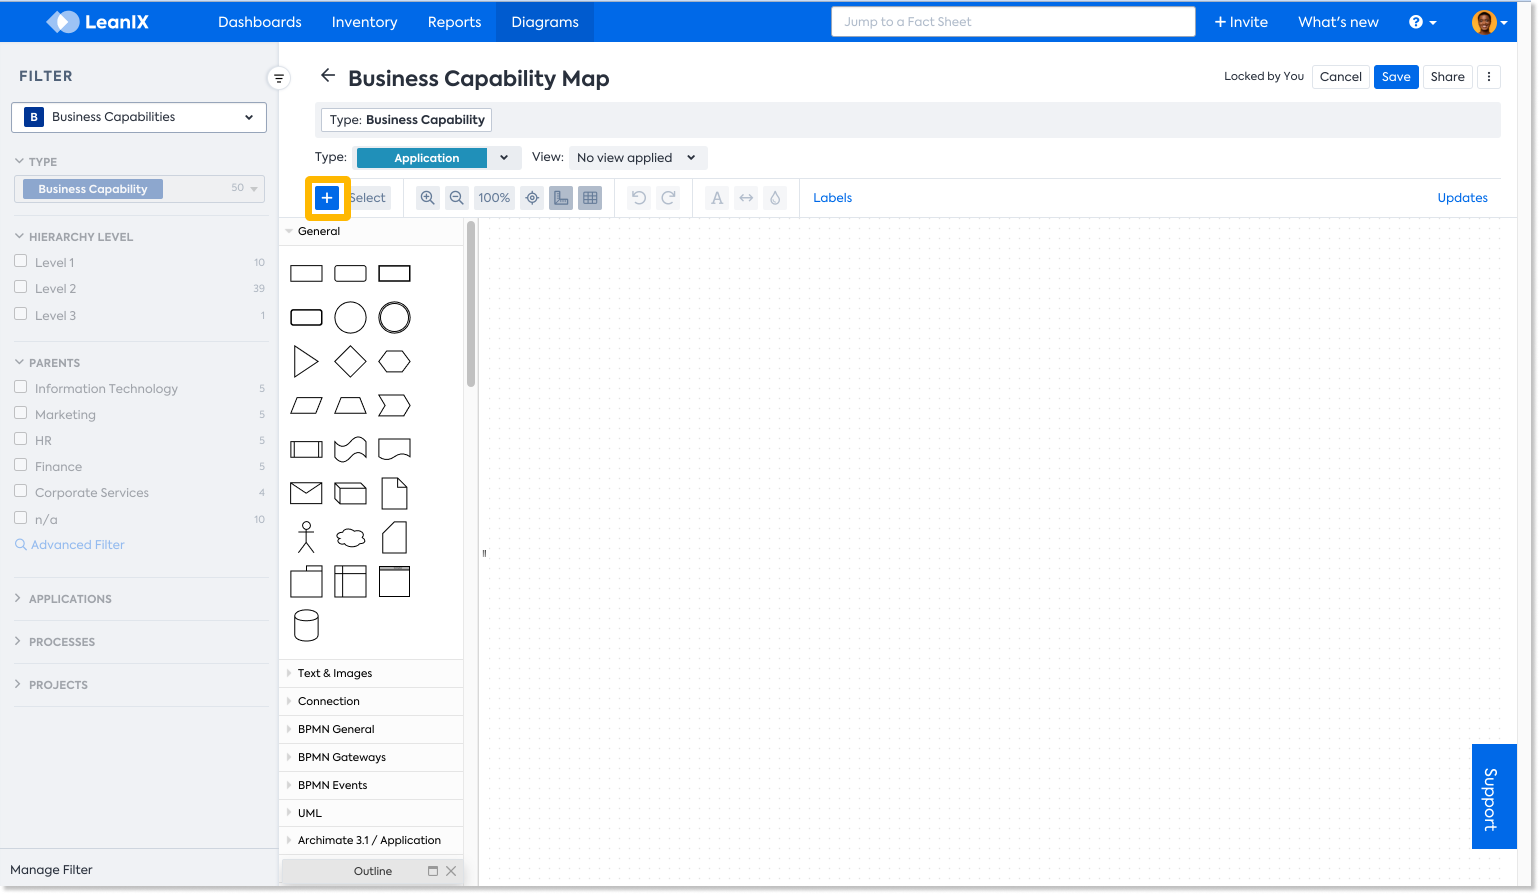
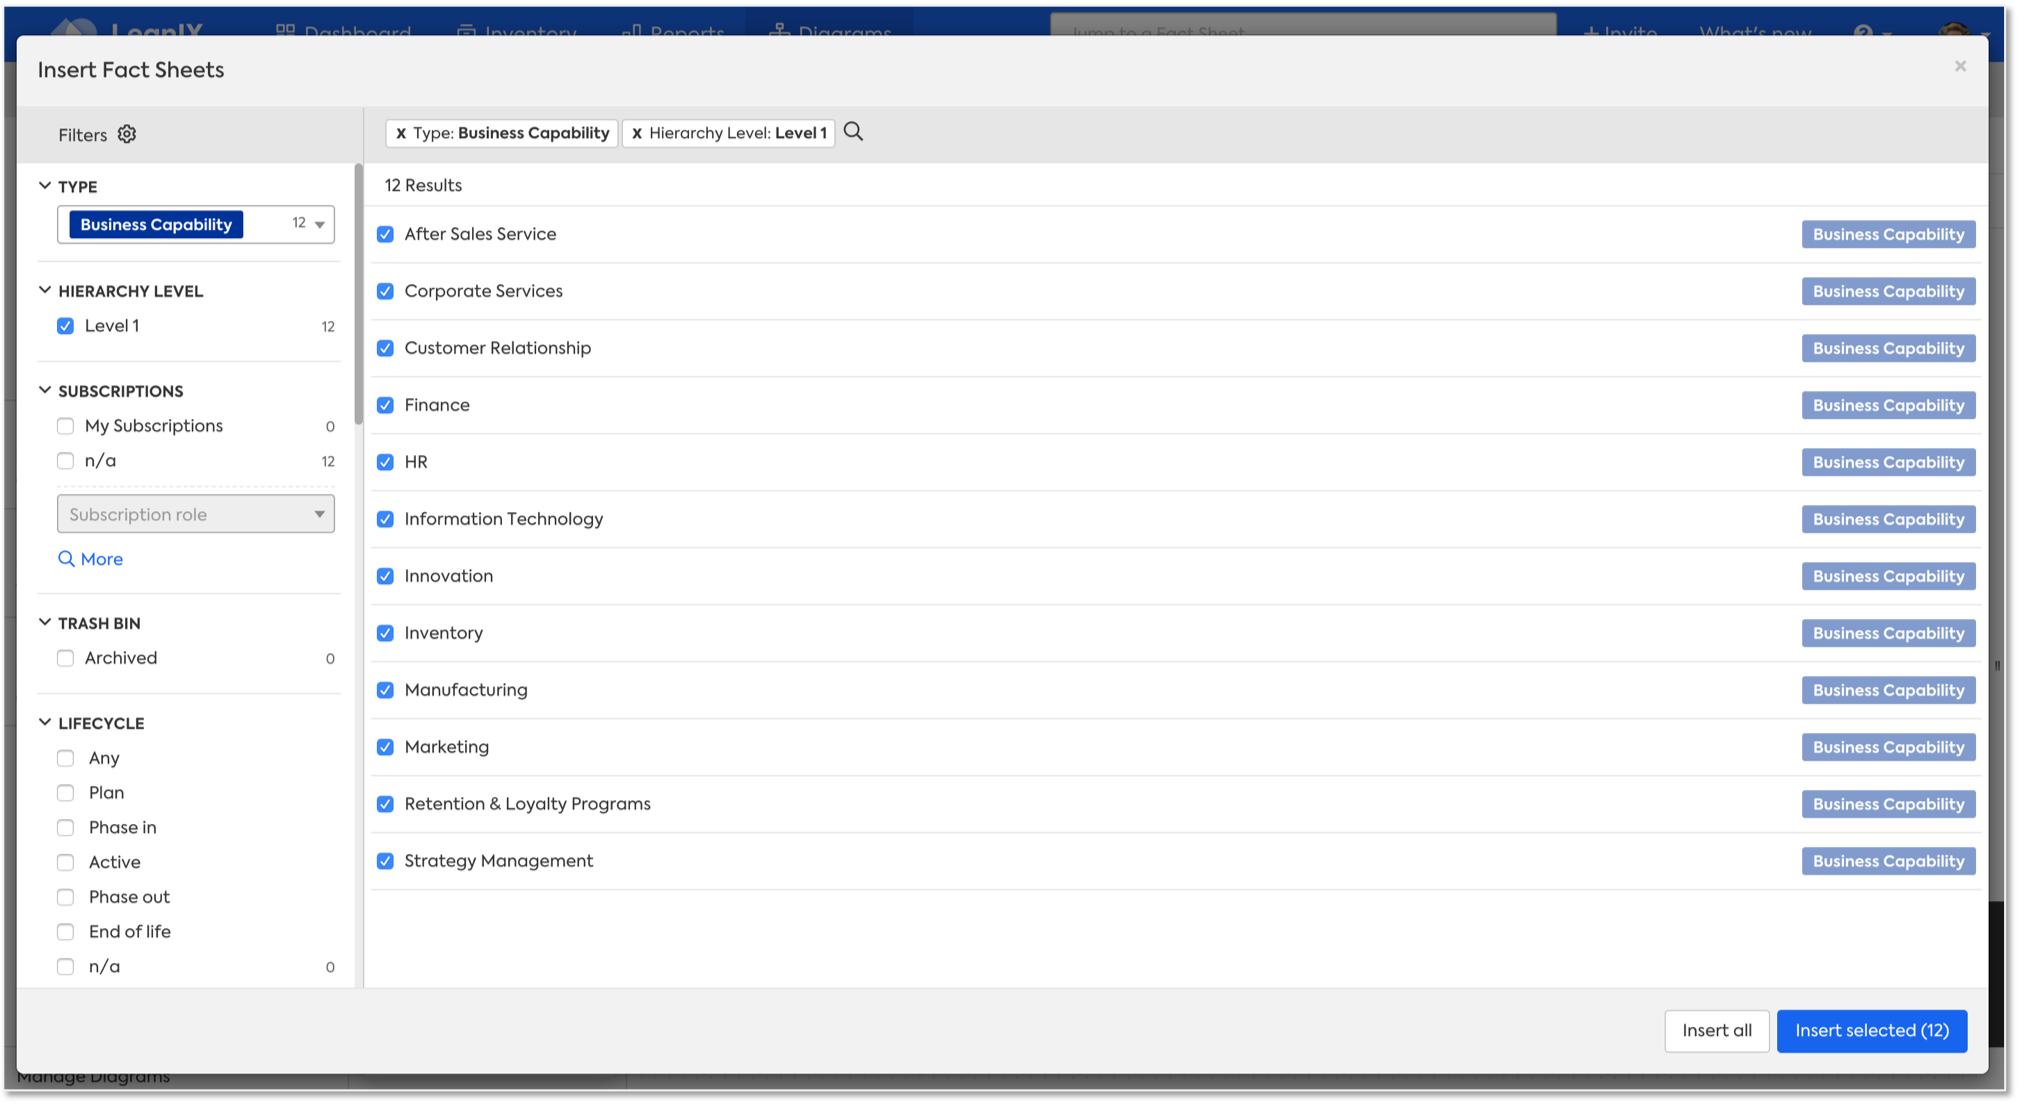
Once you are in the Insert Fact Sheets pop-up window, you can use the Filters function (similar to Inventory) to select the Fact sheets you would like to insert to the report. In this case, we filtered for Business Capability Fact sheet type, Hierarchy Level 1.
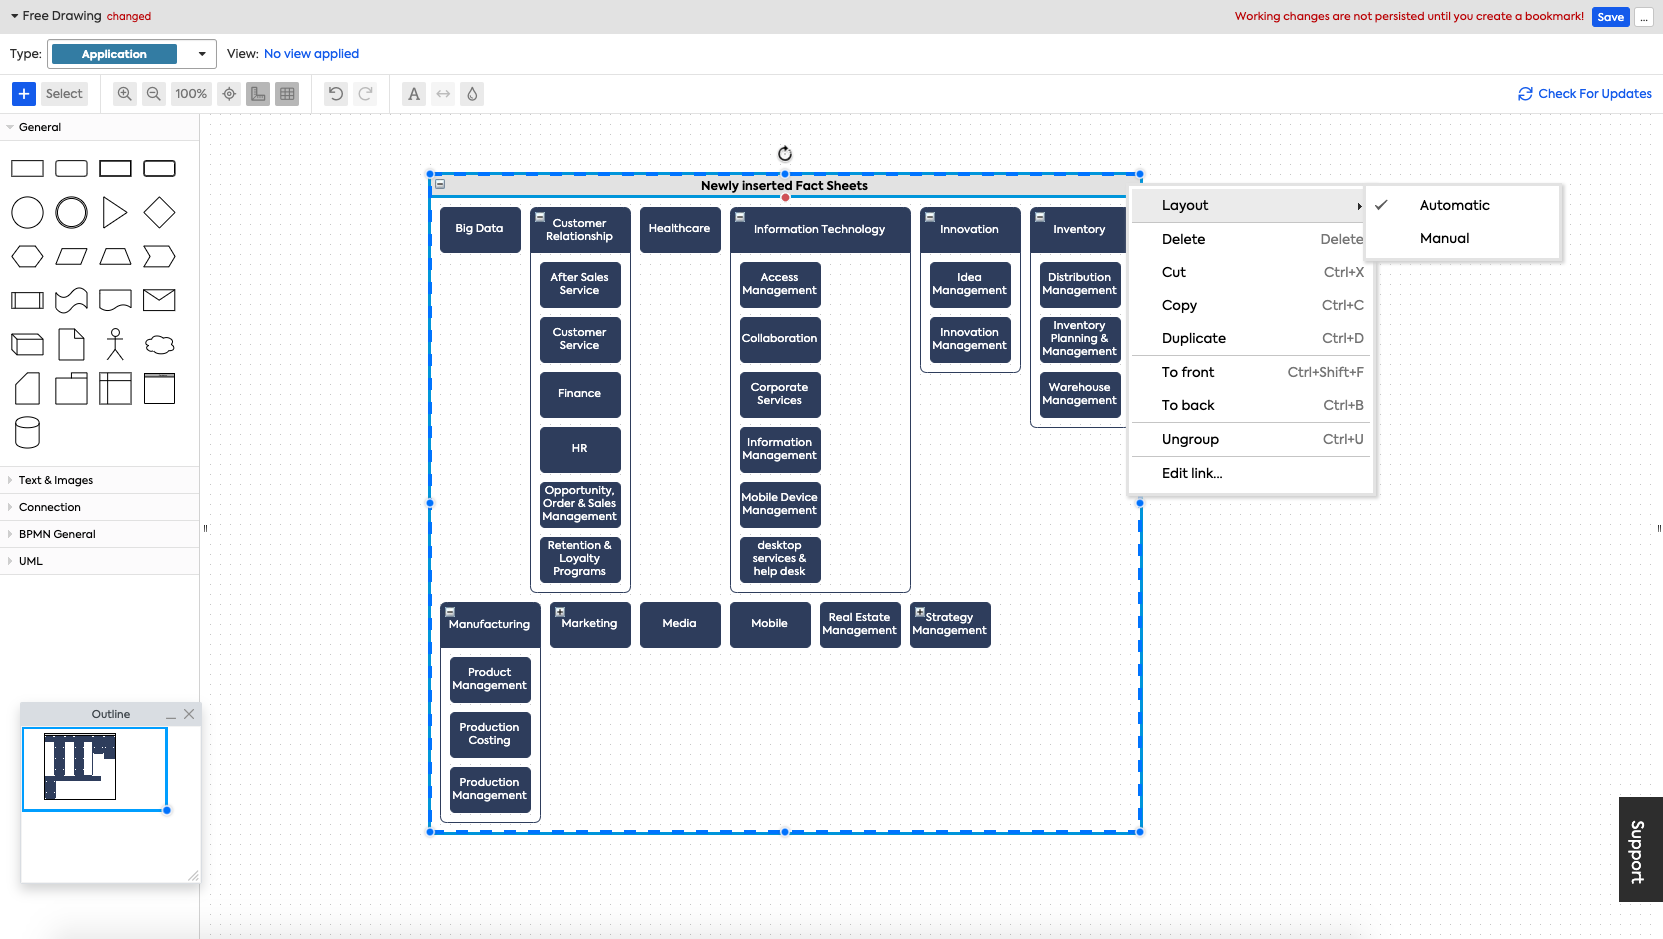
After inserting the Fact Sheets, you have 2 options to arrange the Fact Sheets in your report. Right click on the Newly inserted Fact Sheets container to select Layout options.
Automatic: Fact sheets will be automatically rearranged as you expand the container, you can then drag and drop the individual Fact sheet to create the view you desire.
Manual: Fact sheets will stay where they are, you can drag and drop the individual Fact sheet to create the view you desire.
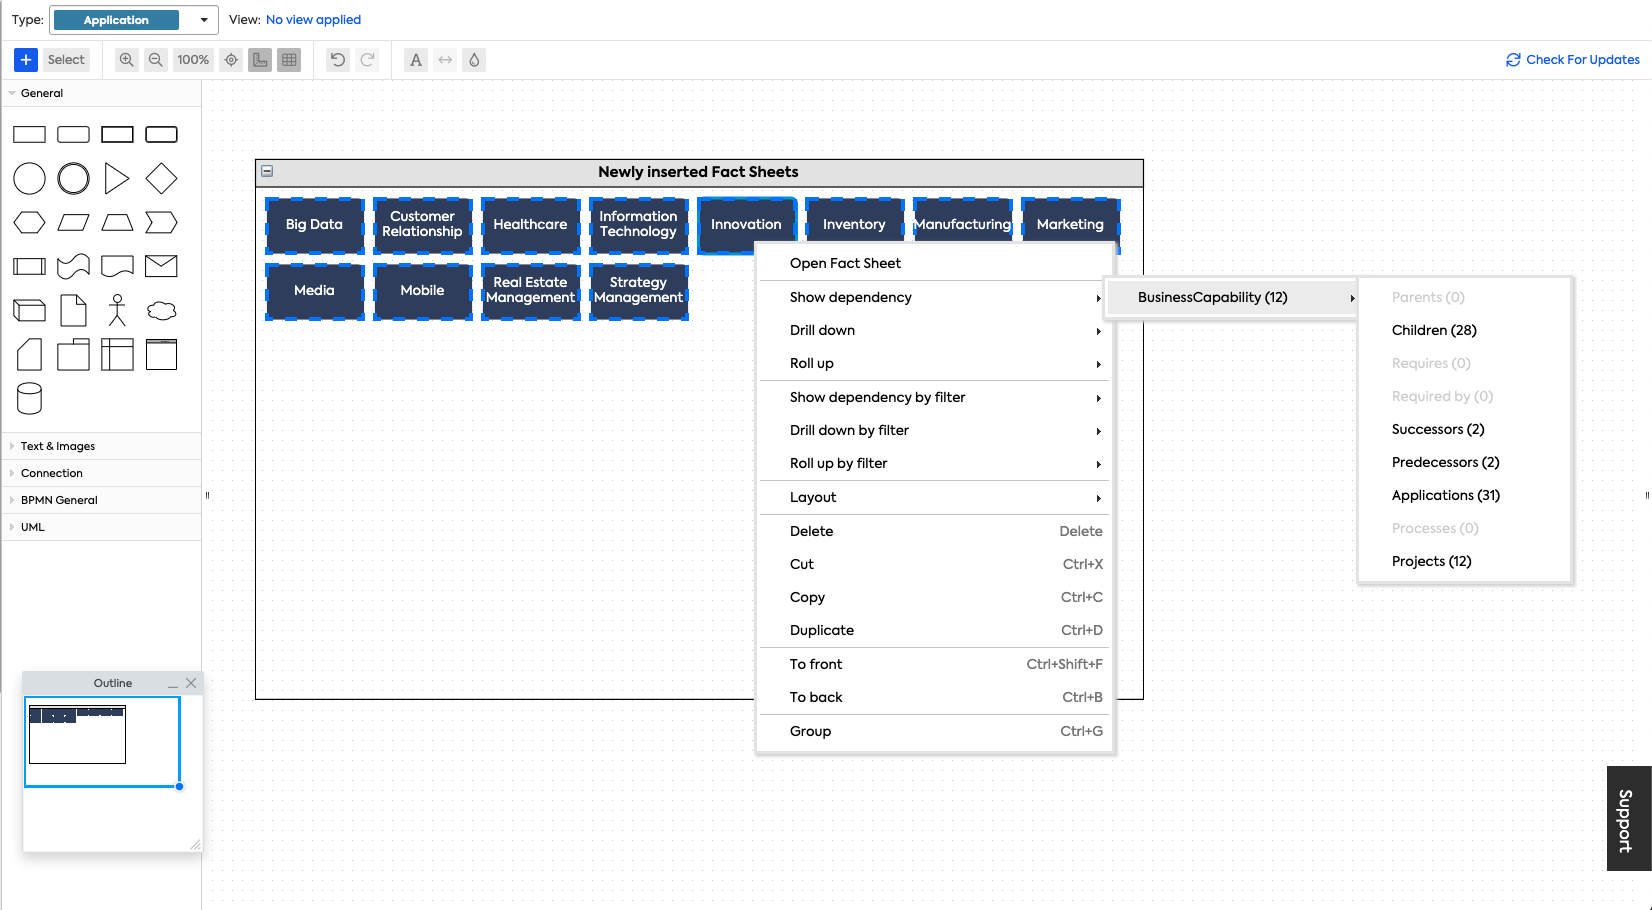
Right click on an individual Fact Sheet to select:
Show Dependency: add Fact Sheet relations as a separate container.
Drill-down: add Fact Sheet relations inside Business Capability factsheet container.
Roll up: add Business Capability Fact Sheet inside Fact Sheet relation container.
We are going to select all Business Capabilities then Right click to select "Drill-down" > "Business Capability" > "Children" option.
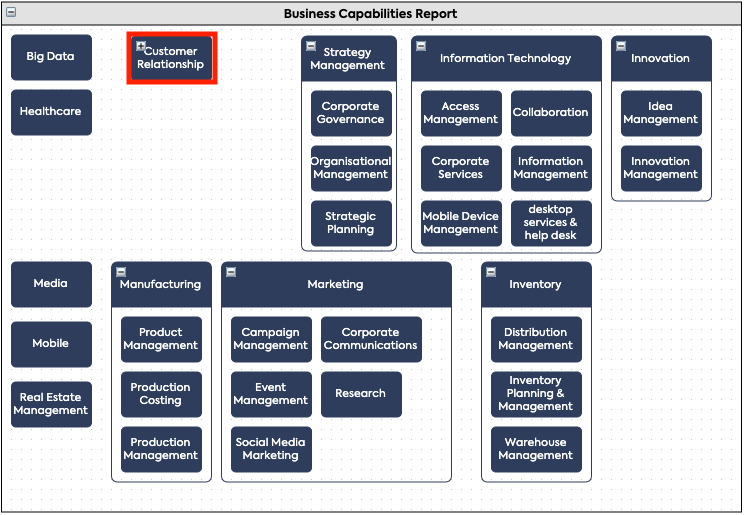
Click on the Plus sign (+) on the top left corner of the Fact Sheet to expand the container to include the Fact Sheet relations. Since we selected "Drill-down" > "Business Capability" > "Children" option in previous step, after you click on the Plus sign, the Customer Relationship Fact Sheet container will expand to include its children Fact Sheetes.
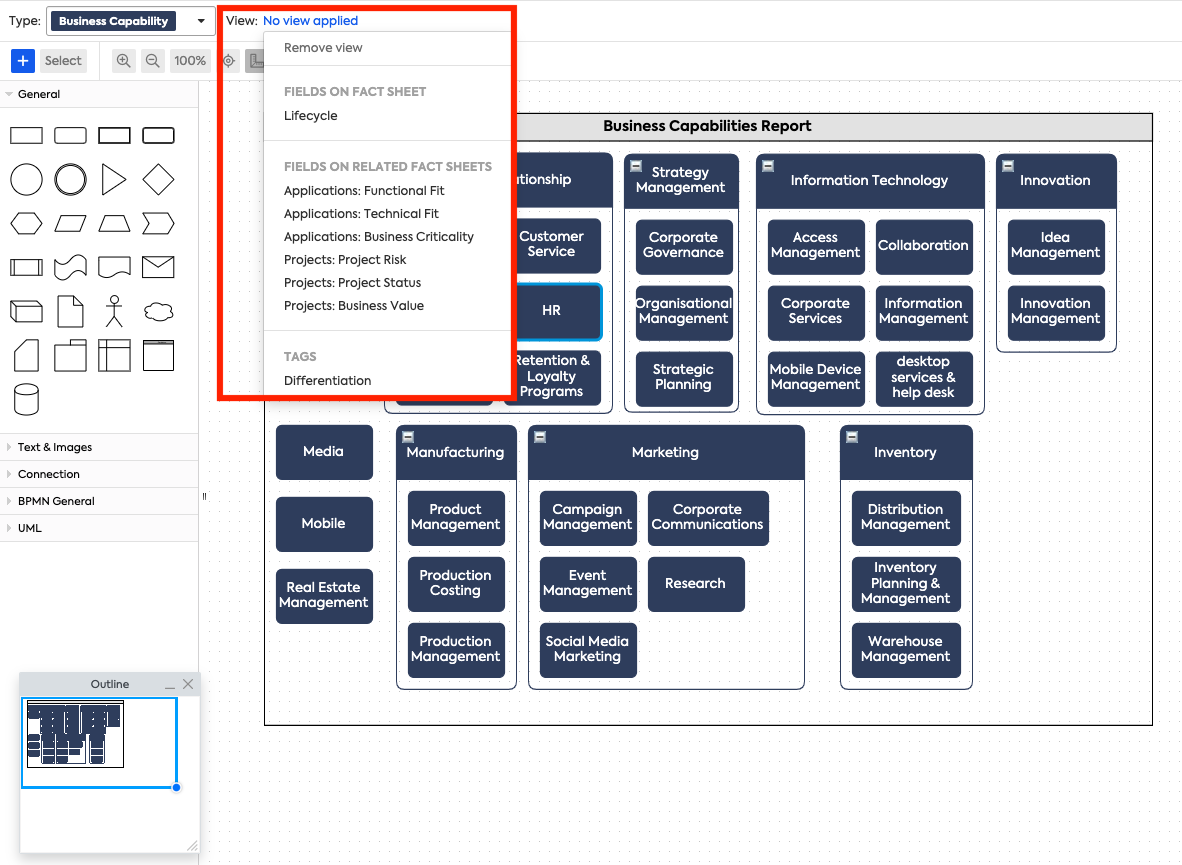
After arranging the Fact Sheets, you can then choose 8 different views based on fields on Fact Sheet, fields on related fact sheets, tags.
Fields on Fact Sheet:
- Lifecycle
Fields on related Fact Sheets:
- Projects: Project Risk
- Projects: Project Status
- Projects: Business Value
- Applications: Functional Fit
- Applications: Technical Fit
- Applications: Business Criticality
Tags:
- Differentiation
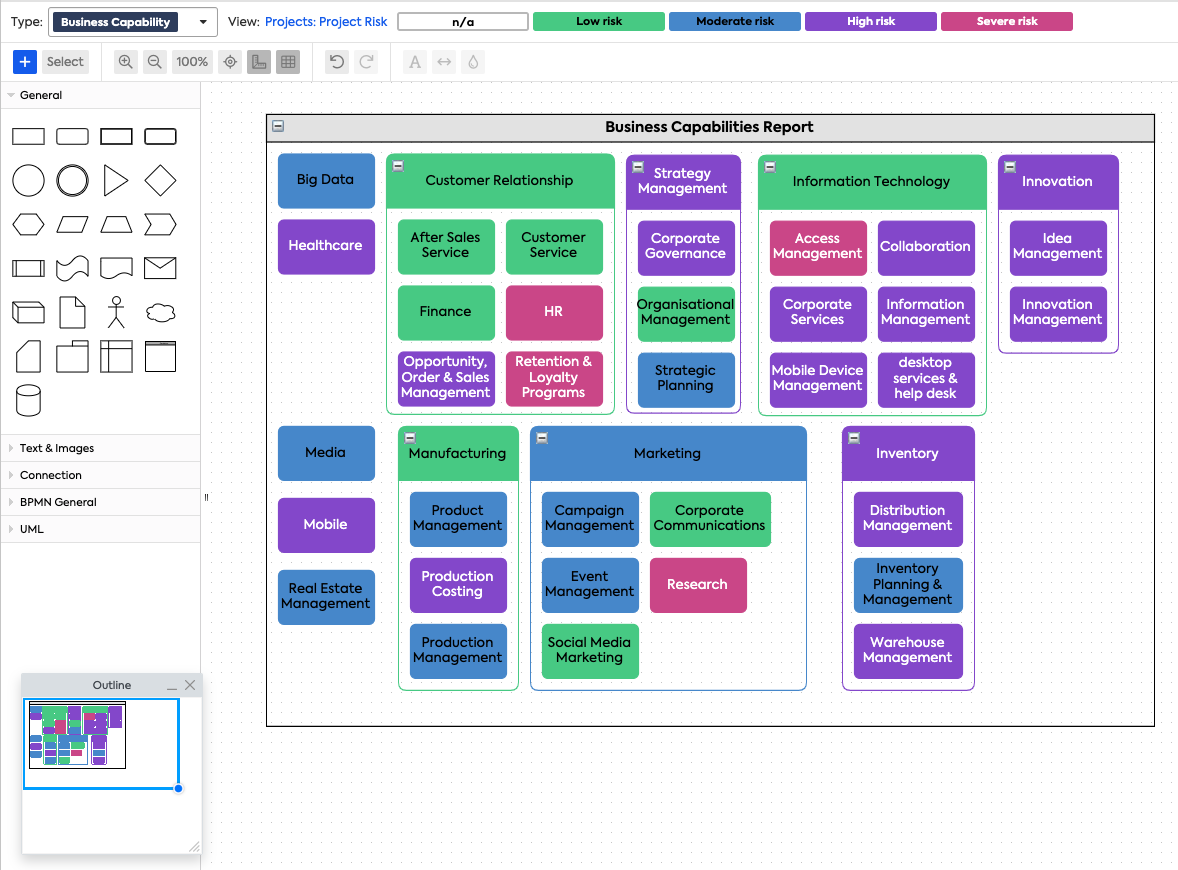
Project Risk view shows you 4 different levels of Risk associated with Projects for the Business Capabilities.
Diagrams do not take into account relations that have a later "Active By" date
Please be aware that you will not be able to see relations that have an "Active By" date that is set beyond the date the diagram is created. This becomes most evident when creating a Data Flow diagram and wondering why only some Interfaces are shown. In that case, double-check if there is a future "Active By" date added for the relation.
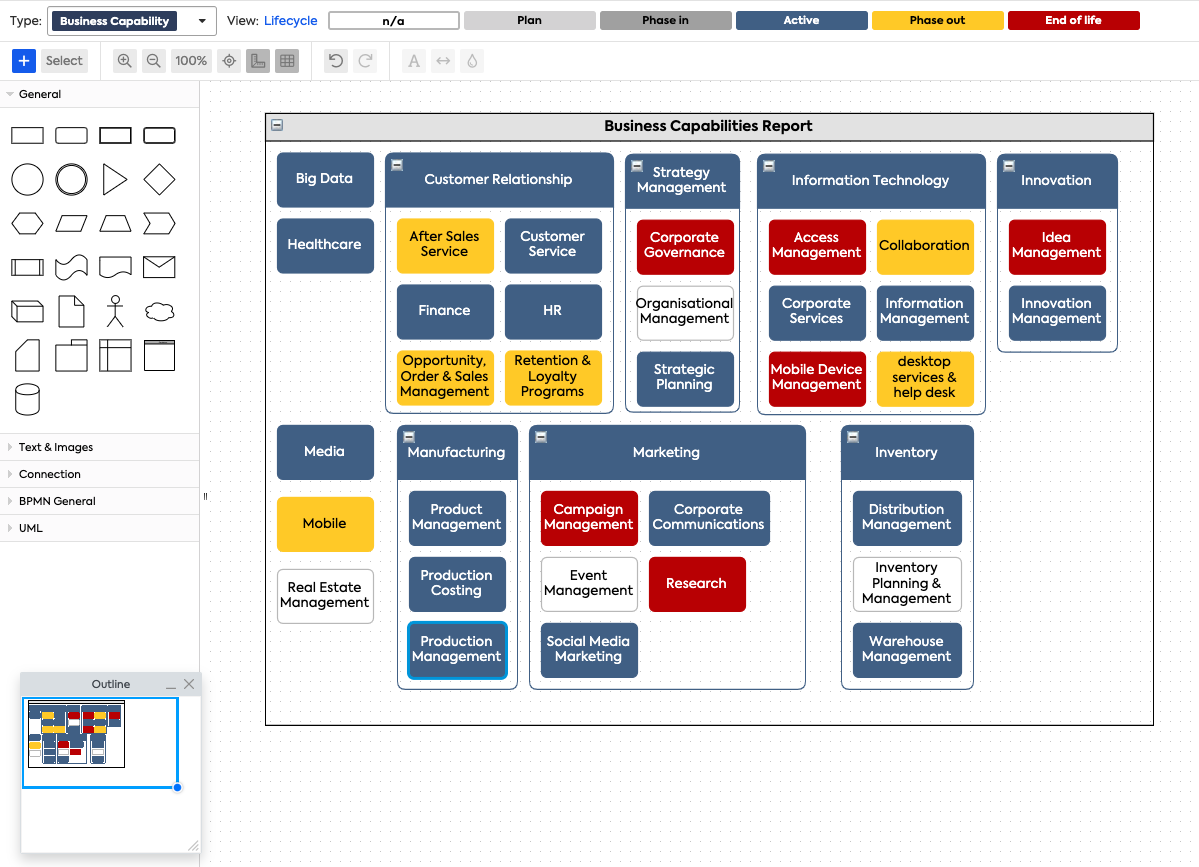
Lifecycle view shows 5 different lifecycle phases of Business Capability Fact Sheet accordingly.
Information
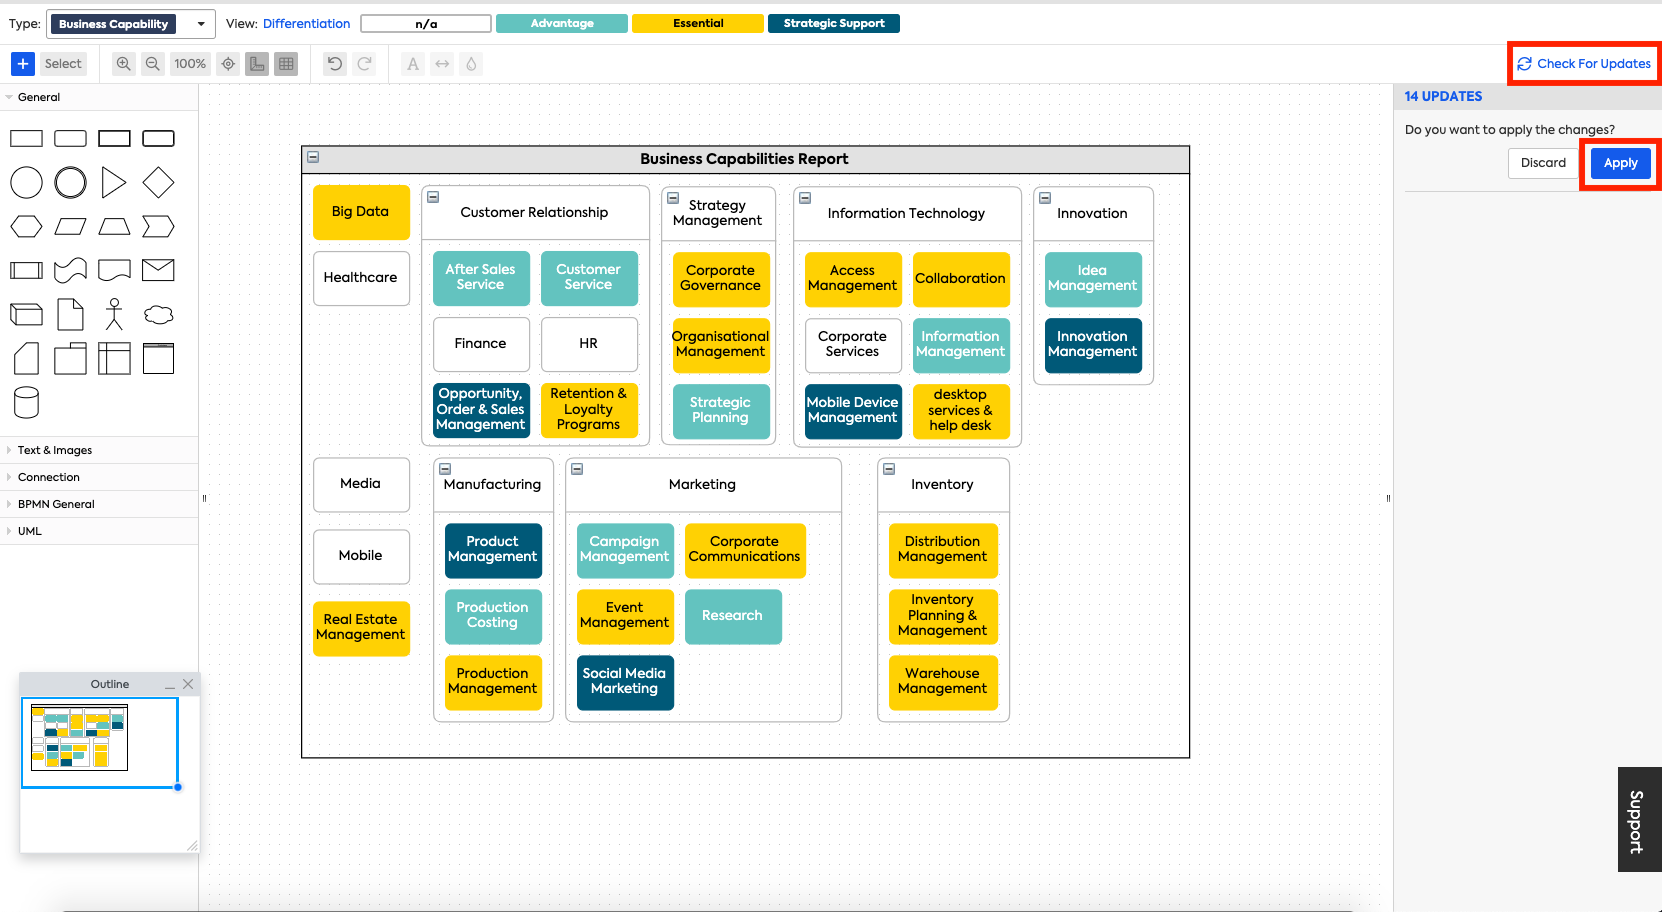
If you make changes to the Fact Sheets that have already been inserted into the diagram, you can select "Check for Updates" to have the updates reflected in your diagram without having to refresh the page.
Considerations when creating a diagram
Please always save the diagram when the text of the items is within the limits, if the text exceeds the size of the box, then the drill-down function may not work properly
Updated 7 months ago
