
Step 2. Enrich Data
Assess and Document the Functional and Technical Fit of Applications
Once you have a clear overview of your applications and business capabilities, the next step is to assess and document the functional and technical fit of your applications. This evaluation allows you to compare their business criticality and how effectively they support your organization's functionality.
Functional Fit
Functional fit measures how well an application aligns with the business requirements, processes, and objectives it is intended to support. It focuses on the utility and relevance of the application from a business perspective.
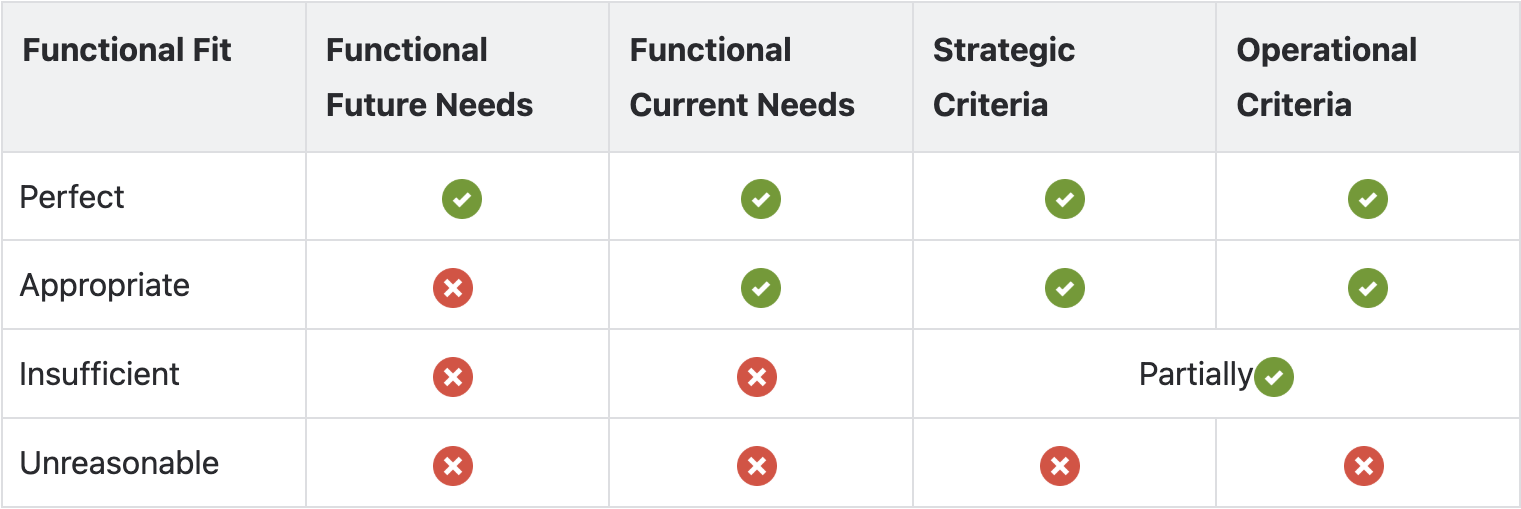
Guidance for assessment:
- Perfect: The application meets all current and future functional needs, as well as all strategic and operational criteria for the organization.
- Appropriate: The application meets all current functional needs and aligns with strategic and operational criteria but does not meet future functional requirements.
- Insufficient: The application does not meet current functional needs.
- Unreasonable: The application does not meet current functional needs, nor does it meet strategic and operational criteria for the organization.
Functional Fit Assessment
Technical Fit
In parallel, assess and document your applications' technical fit. Technical fit evaluates how well an application aligns with your organization's technical and infrastructure standards and how well it adheres to technology strategies, operational policies, and risk management criteria. For example,
- Strategic criteria might include being cloud-native, using specific technologies, or API enablement.
- Operational criteria could involve response time, having high availability, or achieving 99.95% uptime.
- Risk criteria could be needing to have certain controls implemented, avoiding end-of-life status, or having source code and in-house skills.
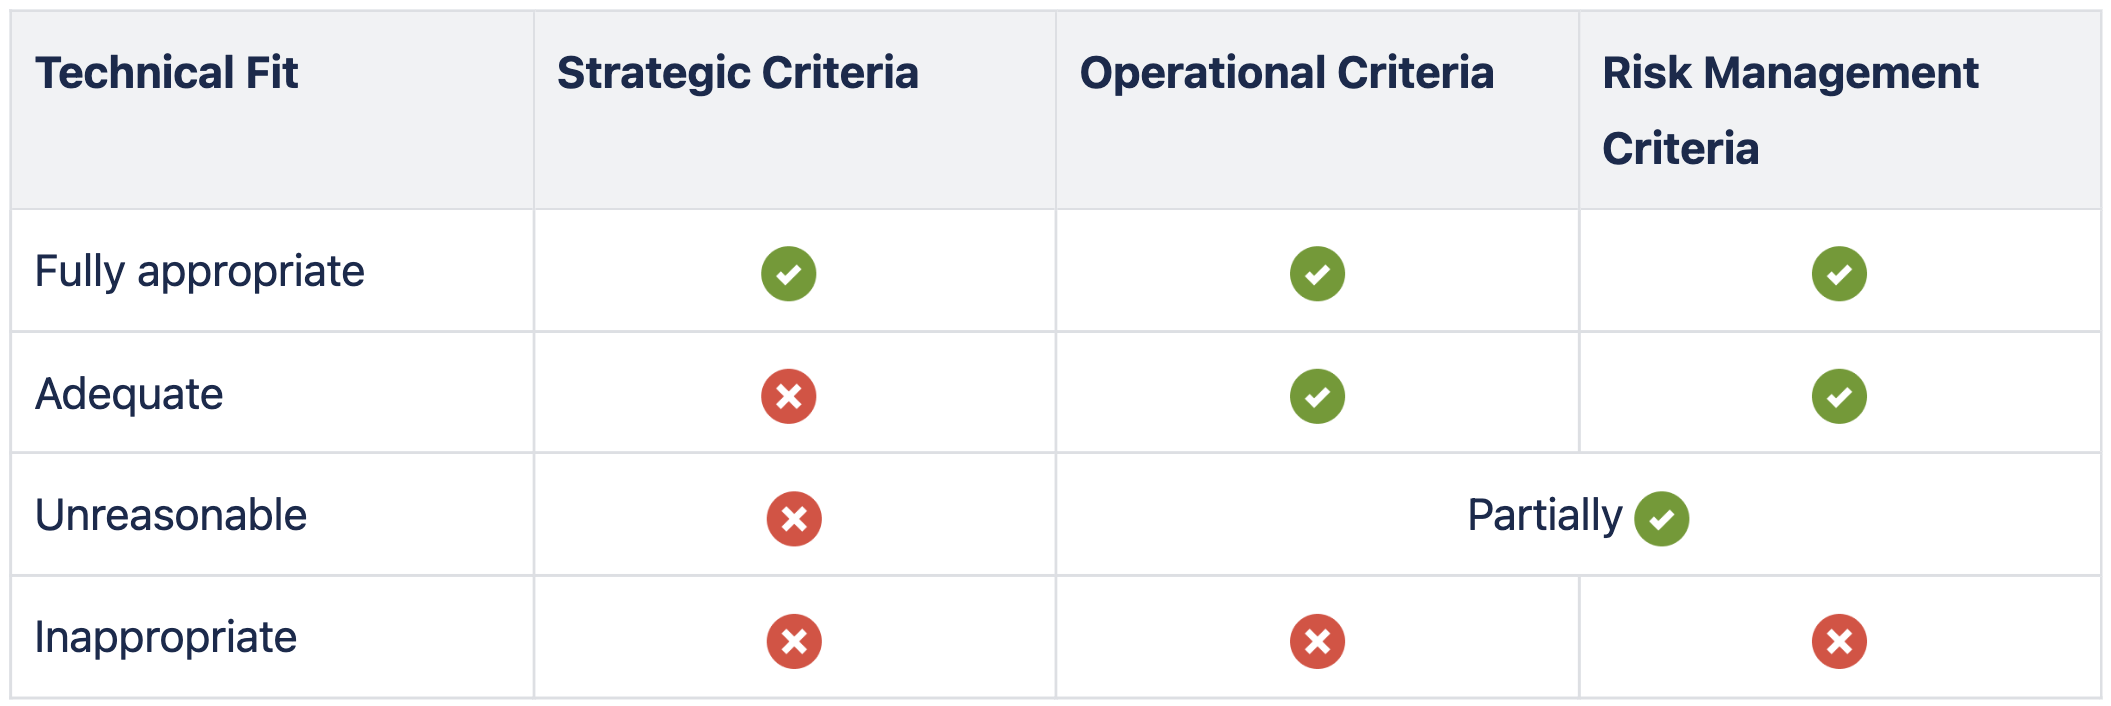
Guidance for assessment:
- Fully appropriate: The application meets all strategic, operational, and risk-related criteria for the organization.
- Adequate: The application meets all current operational and risk-related criteria but falls short of strategic alignment.
- Unreasonable: The application does not fully meet operational or risk-related criteria and is not a strategic choice.
- Inappropriate: The application does not meet strategic, operational, or risk-related criteria.
Technical Fit Assessment
You can document the assessment in the respective fact sheets through inline editing in the inventory or through the import of an Excel file. To learn more, see Bulk Updating Data in Inventory Table View and Importing Fact Sheet Data Through Excel File.
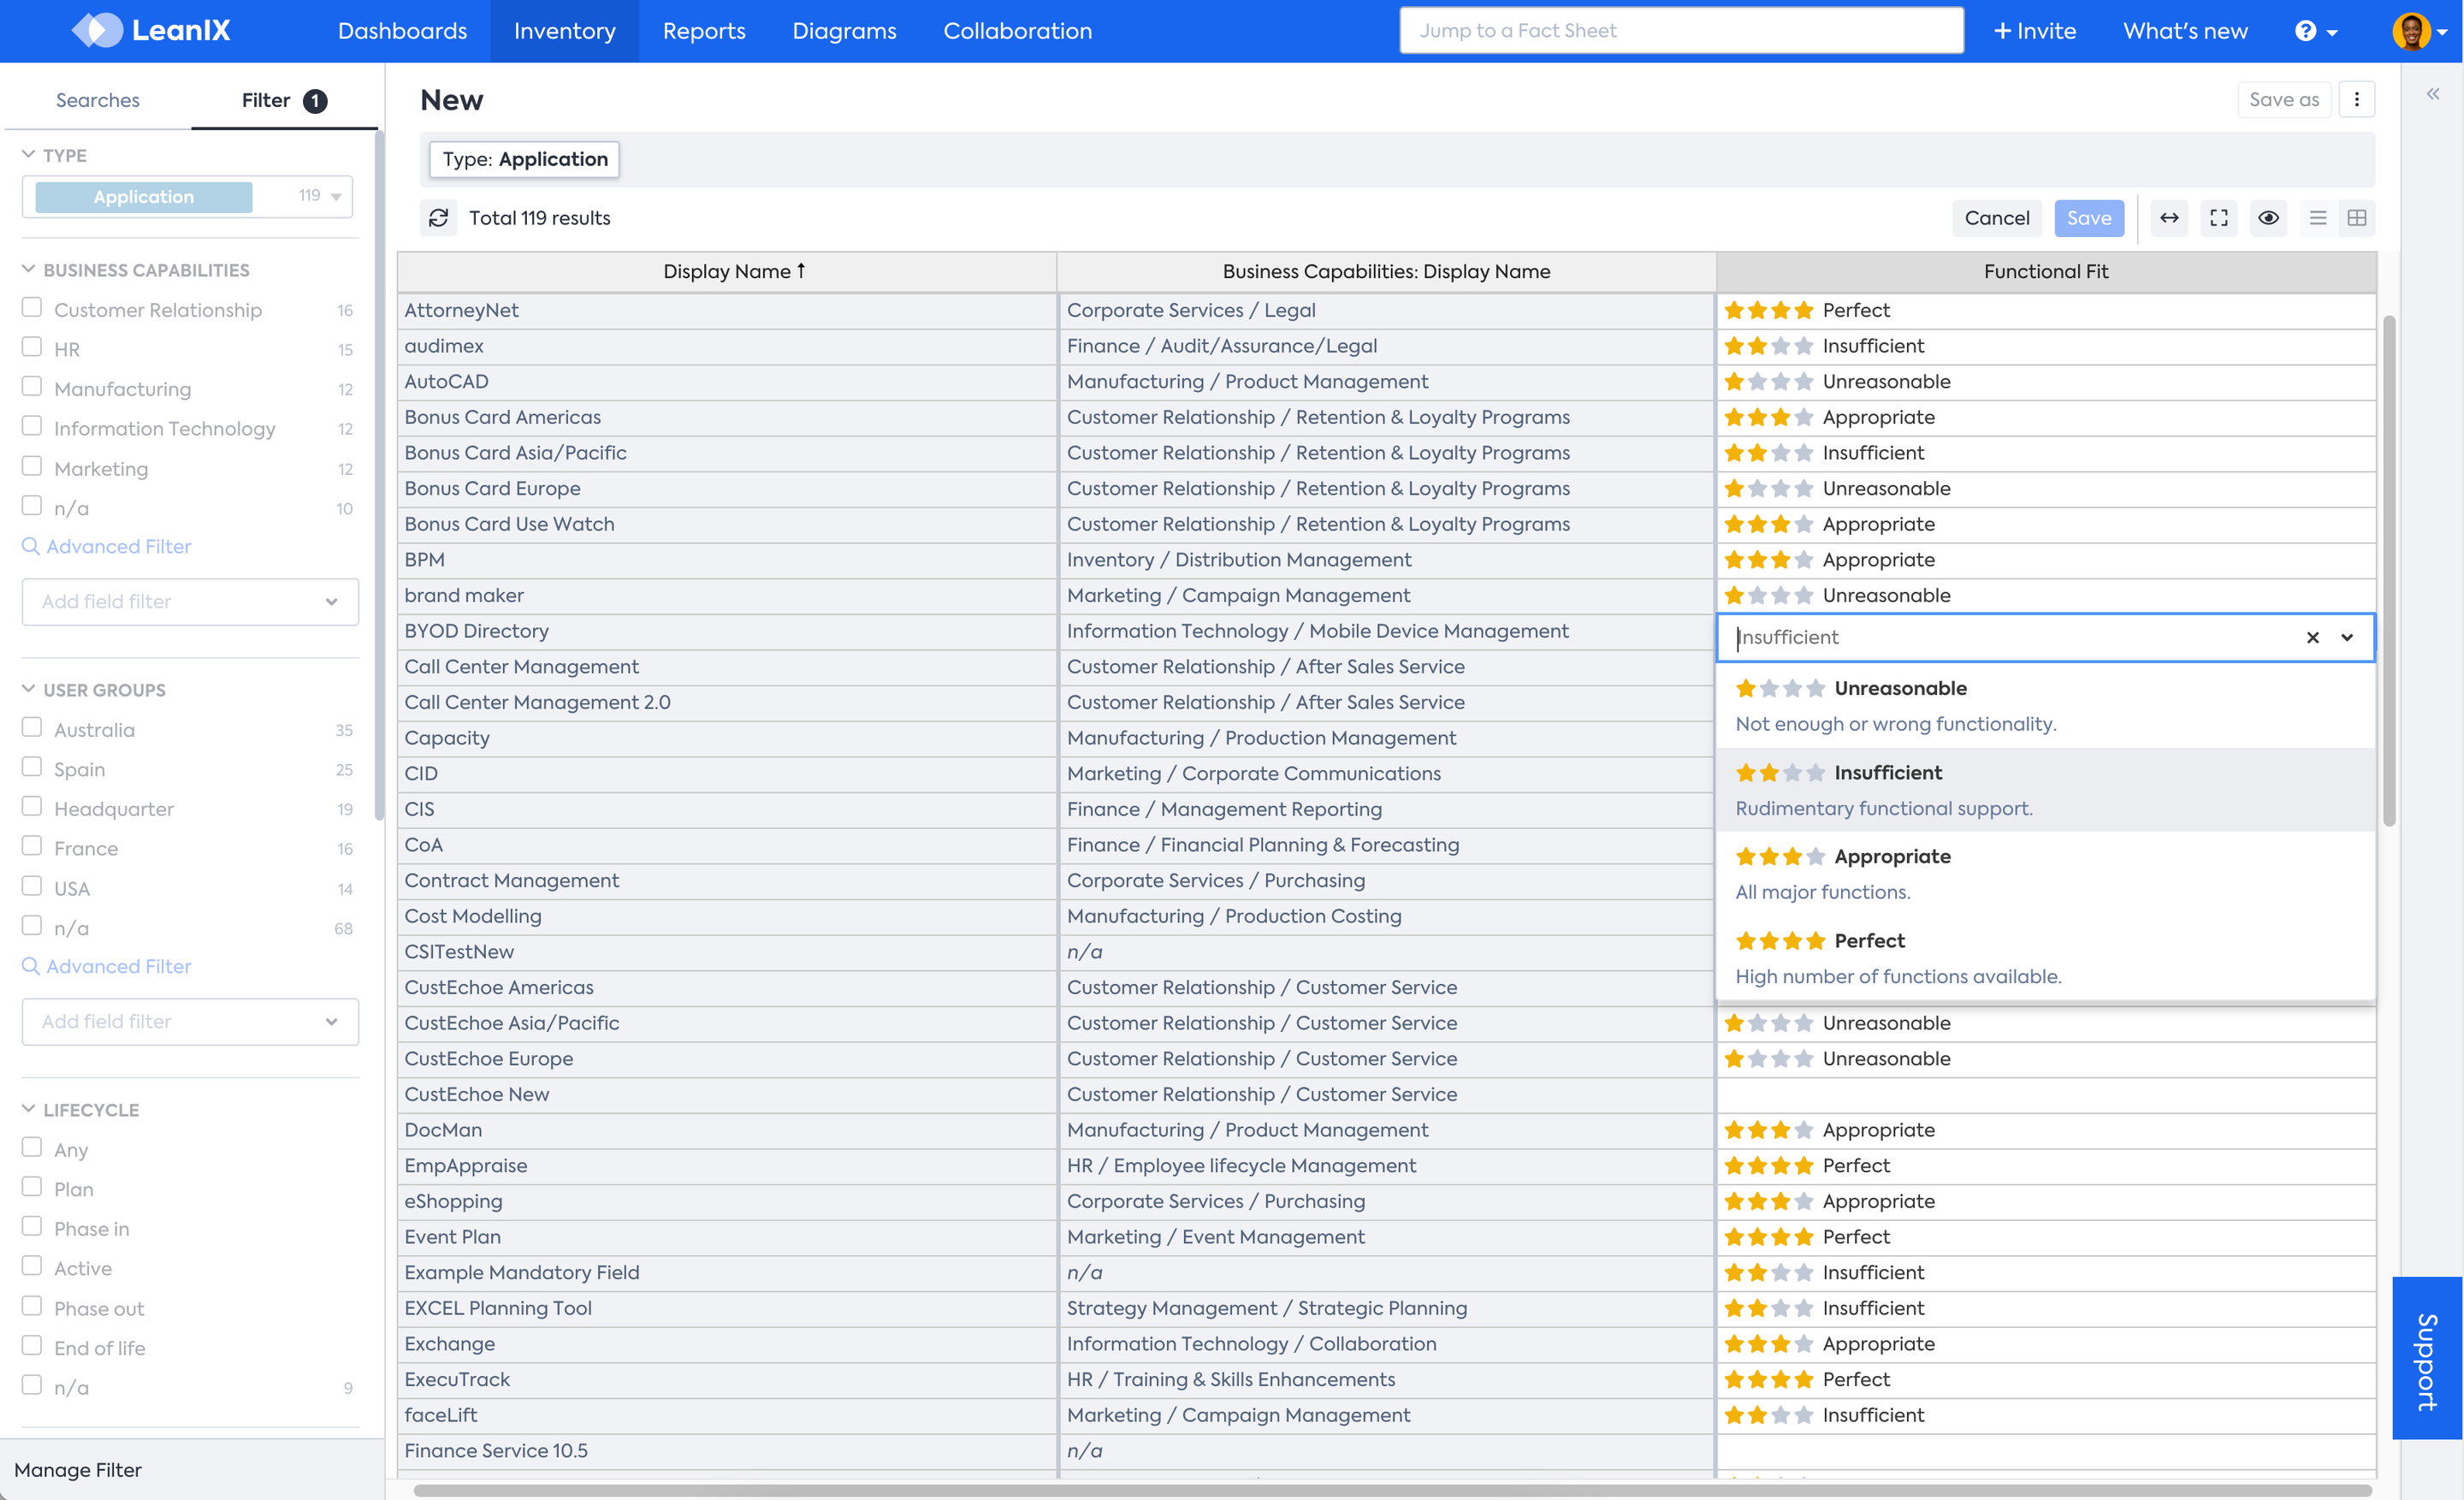
Inline Editing in Table View Mode of Inventory
You can also make use of surveys to ask relevant application owners to assess both the functional fit and business criticality of applications. SAP LeanIX offers free survey templates that you can download from the store and use to collect the required information. To learn more, see Designing a Survey from Existing Survey and Survey Template.
The relevant survey templates are:
- Application Rationalization (TIME): for collecting functional fit information.
- Business Application Criticality Assessment: for assessing the business criticality of applications.
Importing Cost Data
You can now also bring in cost data. This information will feed the reporting and allow you to analyze your application portfolio more in-depth. There are several options to add cost data:
- Get an Excel with finance data from your Finance team, for example, and import this information into SAP LeanIX
- You can manually add costs by inline editing or editing the cost field on an application fact sheet. Therefore, you need to go to the Sourcing section of the application fact sheet and look for the IT Components field to add an existing service from the Inventory or add a new one. You can add the total annual cost in the specific field and save. As a reminder, the out-of-the-box model in SAP LeanIX captures data cost at the IT component level and then aggregates it to give the total cost for the application.
- If exact cost data is unavailable, use tags to represent costs. For example, assign t-shirt sizes (e.g., Small, Medium, Large) to indicate relative cost levels. Add those tags to your applications to provide a simple, scalable way to categorize costs
- Import costs programmatically using a Python script. For more information, see Importing and Updating the Total Annual Costs of Applications.
- Another advanced option is to explore integrations such as Apptio
Next Step
Updated 29 days ago