
Collections
Use collections to arrange dashboards, reports, and diagrams into custom groups.
Overview
Collections allow users to organize dashboards, reports, and diagrams into custom groups. Both admins and users with the appropriate permissions can create and manage collections. Once collections are defined, users can add any number of dashboards, reports, and diagrams to them.
Non-empty collections appear on the left-side panel on the dashboards, reports, and diagrams pages. Collections that contain no items do not appear on the left-side panel. Once users add at least one item to a collection, it becomes visible on the left-side panel of the corresponding page. Subcollections, or collections within other collections, appear as folders.
Collection Groups and Collections on the Reports Page
Collection Structure
Collections are organized in a hierarchical structure:
- Collection group: A container that holds multiple collections. Collection groups appear on the left-side panel as expandable sections.
- Collection: The main organizational unit where dashboards, reports, and diagrams are grouped. Collections appear on the left-side panel within collection groups.
- Subcollection: A further subdivision within a collection. Subcollections do not display on the left-side panel. When a collection is selected, subcollections appear as folders within that collection's page. In the UI, subcollections are referred to as collections.
Permissions
By default, only admins can manage collections and their content. Admins can grant users in other roles the permissions to:
- Administrate: Create and manage collection groups and collections.
- Manage content: Add and remove dashboards, reports, and diagrams within collections.
To modify collection permissions for non-admin roles, navigate to the User Roles and Permissions section of the admin area. For details, see Role-Based Permissions.
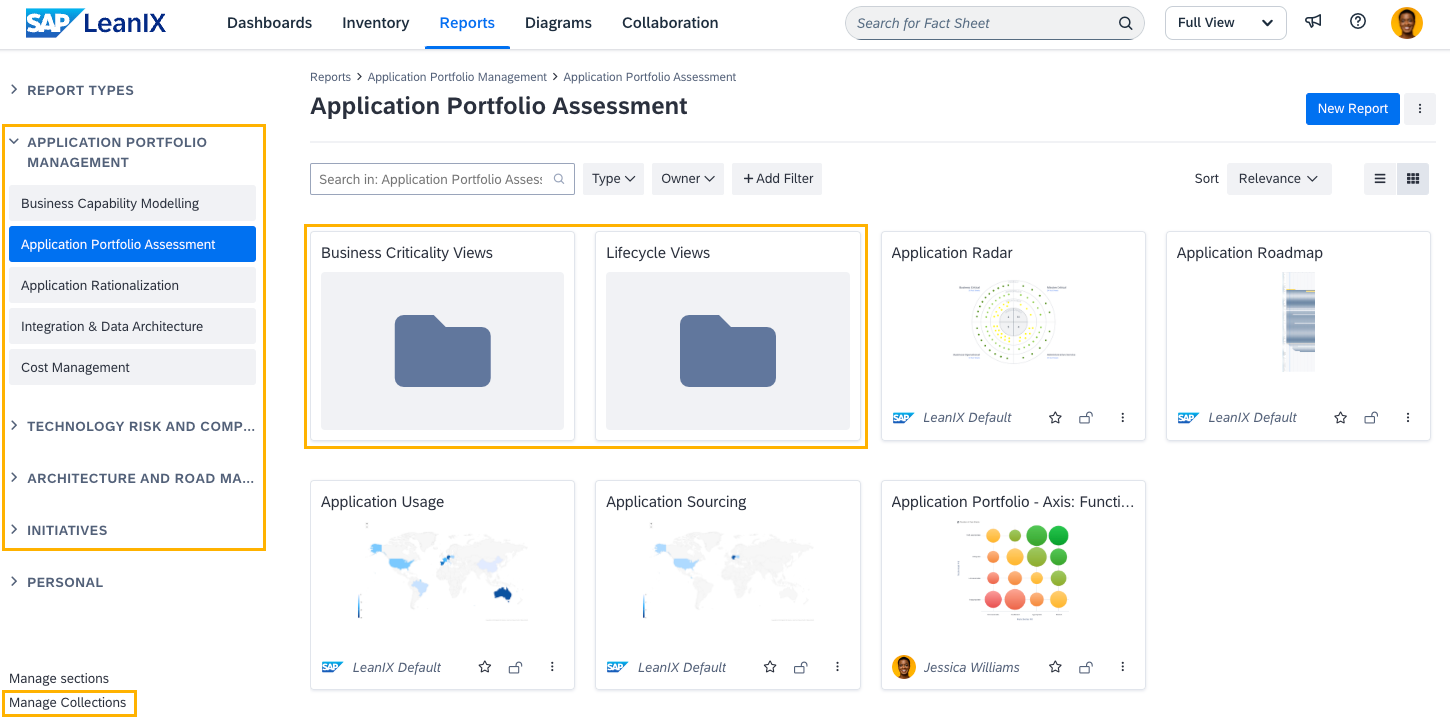
Using Collections
All users can view collections and the items included in them, unless access to specific items is restricted. To open a collection, select it from the left-side panel on the dashboards, reports, or diagrams page. Only non-empty collections are shown. You can navigate between different collections using the breadcrumbs menu at the top of the page.
Navigating Between Collections
Users with the permission to manage content within collections can do the following:
- Add items: You can add an item to multiple collections.
- Move items: Move items between different collections. Use this option to add items to subcollections. You can also drag and drop items to move them.
- Remove items: Removing items from collections doesn’t delete any workspace data.
To perform these actions, click the three-dot icon on an item and use the corresponding options in the context menu.
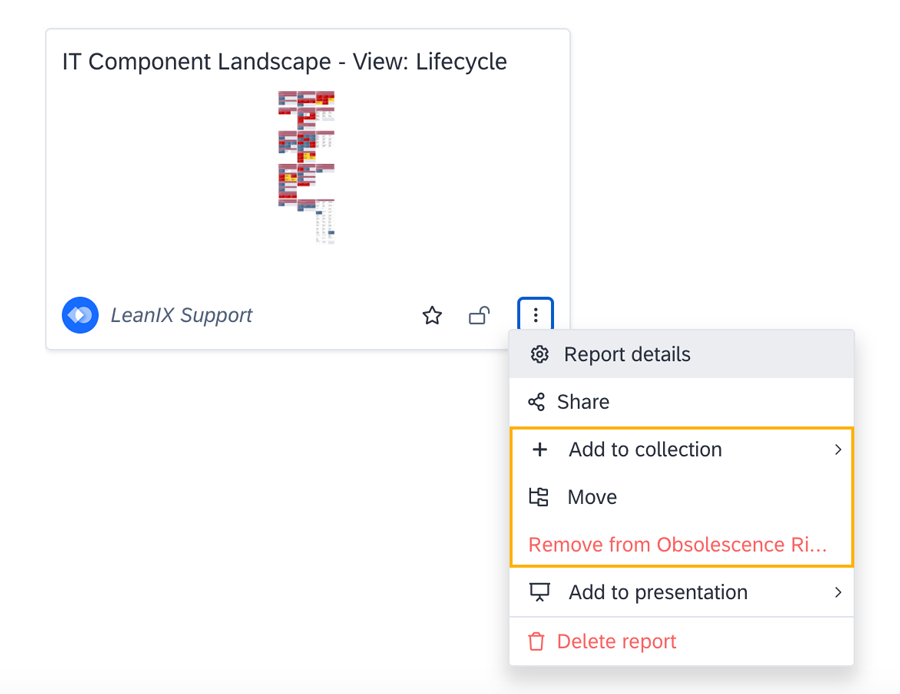
Context Menu Options for Collections on a Report
Managing Collections
Users with the appropriate permissions can create and manage collections. To do this, on the dashboards, reports, or diagrams page, click Manage Collections at the bottom of the left-side panel. In the modal that appears, you can create, edit, reorder, and delete the following:
- Collection groups
- Collections
- Subcollections
Managing Collections in the Manage Collections Modal
You can also open the Manage Collections modal from a collection page. To do this, in the upper-right corner, click the three-dot icon > Edit Collection. To move a collection, click the three-dot icon > Move.
Managing Collections in the Administration Area
Admins can also manage collection groups and collections in the Collections section of the administration area. Here, you can:
- Create, edit, reorder, and delete collection groups and collections. You can add descriptions to collections, which is not possible in the Manage Collections modal.
- Import collections based on SAP LeanIX best practices. For details, see Importing Collections.
To create subcollections, use the Manage Collections modal accessible from the dashboards, reports, and diagrams pages.
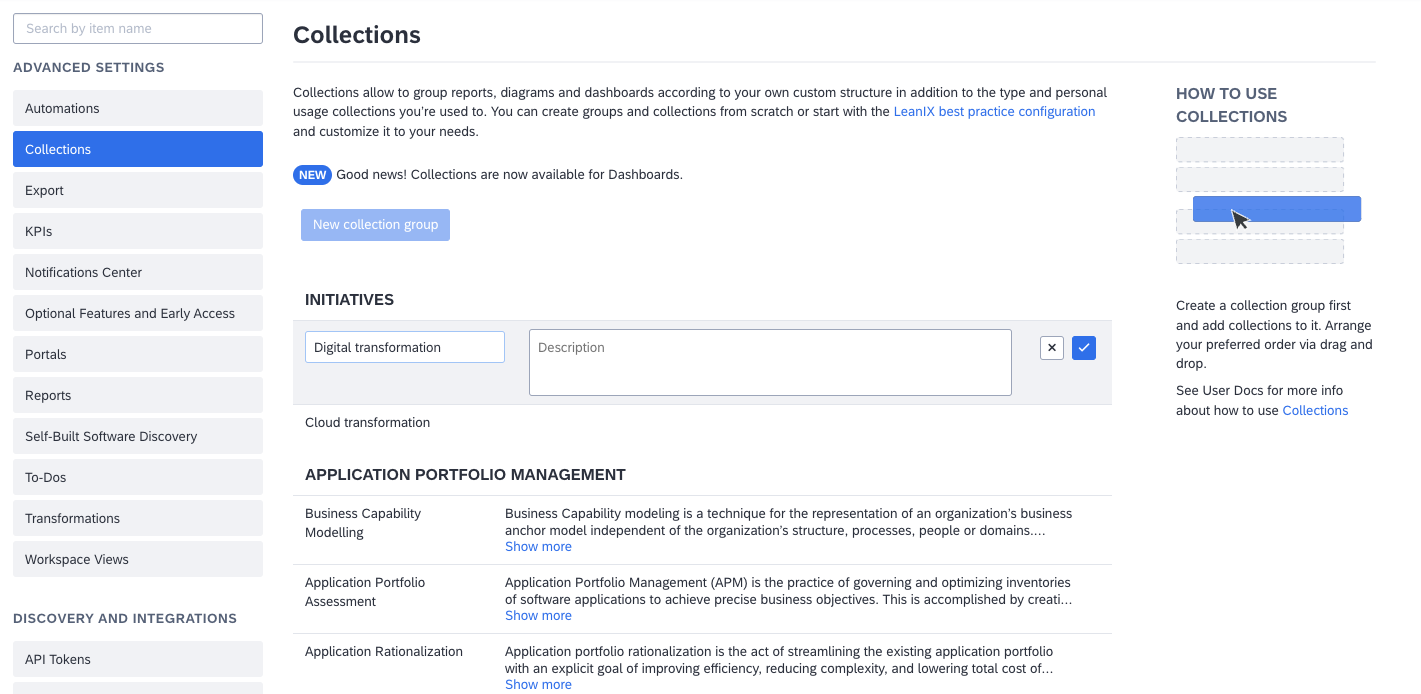
Managing Collections in the Administration Area
Importing Collections
Admins can import collections based on SAP LeanIX best practices. This creates collection groups for each SAP LeanIX product available in the workspace and populates them with collections for common use cases. Relevant reports are automatically added to these collections, but no diagrams are automatically created or added.
To import collections, in the Collections section of the admin area, click Import SAP LeanIX Best Practices.
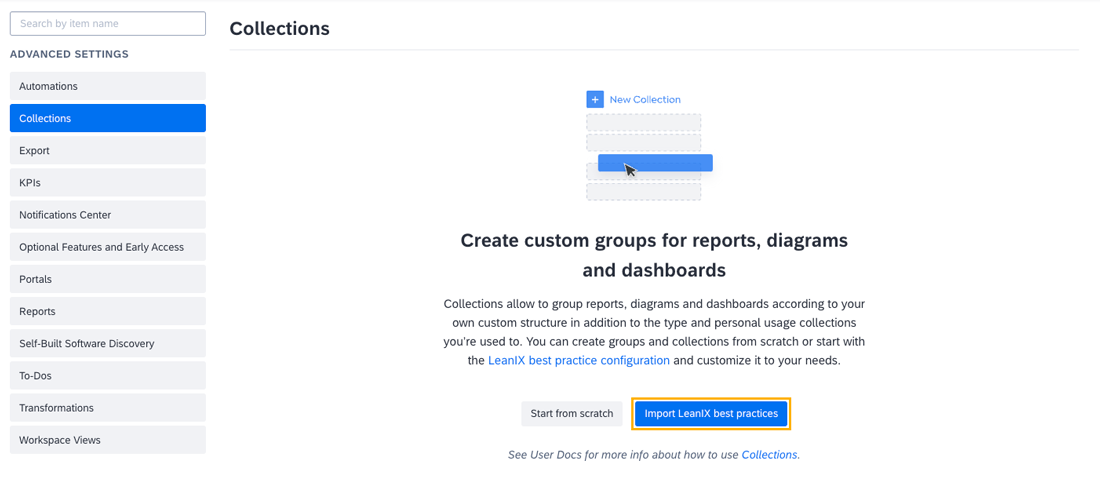
Importing Best-Practice Collections
Best Practice
The table below lists collections available for import. They are based on SAP LeanIX best practices for typical scenarios.
| Collection Group (Product) | Collection (Use Case) | Report | Description |
|---|---|---|---|
| SAP LeanIX Application Portfolio Management | Business Capability Modelling | - | Business capability modeling is a technique for the representation of an organization’s business anchor model independent of the organization’s structure, processes, people, or domains. Business capability models enable the discussion of strategic invest or divest. Business capabilities can serve as the structuring element to uncover redundancies in IT. |
| Business Capability Cost | This report gives you an overview of which business capabilities are supported by which applications and how much this support costs you annually. It helps you understand the cost allocation per business capability and to analyze where costs could be reduced. | ||
| Business Capability Map - View: Lifecycle | The Business Capability Map gives you a hierarchical color-coded overview of your business capabilities. Add filters and switch between different views to drill down until you find what you need, for example, business capabilities that are marked as 'End of Life'. | ||
| Application Portfolio Management | - | Application Portfolio Management is the practice of governing and optimizing inventories of software applications to achieve precise business objectives. This is accomplished by creating transparent overviews of IT application landscapes to evaluate IT costs, standardize software throughout business units and promote agility and innovation. | |
| Application Portfolio - Axis: Functional fit vs. technical fit | The Application Portfolio Report helps you identify applications that need your attention. Add filters and switch between different views to drill down until you find what you need, for example, 'Active' applications that are business critical but have insufficient technical fit. | ||
| Application Landscape - View: Lifecycle | The Application Landscape report gives you a color-coded overview of your IT landscape. Add filters and switch between different views to drill down until you find what you need, for example, applications used by a business capability, process, or user group that are 'End of Life'. | ||
| Application Matrix - View: Lifecycle | The Application Matrix report gives you a color-coded overview of your applications, business capabilities, and user groups. Add filters and switch between different views to drill down until you find what you need, for example, 'Mission Critical' IT components used by specific business capabilities and user groups. | ||
| Application Roadmap - View: Lifecycle | The Application Roadmap gives you a Lifecycle view of 'Planned', 'Phased in', 'Active', or 'Phased out' Applications. You can also apply a drill down, e.g. by 'Children' or 'IT Components', or cluster the Applications by user group, business capability, and more. | ||
| Application Usage | The Application Usage report shows you which applications are used by which user group. Zoom in for a better view of your region of interest. | ||
| Application Sourcing | The Application Sourcing report shows you which IT components are used by which user group. Zoom in for a better view of your region of interest. | ||
| Application Rationalization | - | Application portfolio rationalization is the act of streamlining the existing application portfolio with an explicit goal of improving efficiency, reducing complexity, and lowering the total cost of ownership (TCO) through a myriad of processes. | |
| Application Landscape - View: TIME | The Application Landscape report gives you a color-coded overview of your IT landscape by TIME model classification. | ||
| Application Matrix - TIME | The Application Matrix report gives you a color-coded overview of your IT landscape by TIME model classification. | ||
| Application Lifecycle & Age | The Lifecycle report lets you visualize 'Active' or 'Phased Out' Applications at any point in time, while the Age Structure report shows you how many of the current applications have entered, or will be entering, the status 'Active' each year. | ||
| Application Roadmap | The Application Roadmap gives you a Lifecycle view of 'Planned', 'Phased in', 'Active', or 'Phased out' Applications. You can also apply a drill down, e.g. by 'Children' or 'IT Components', or cluster the applications by user group, business capability, and more. | ||
| Integration & Data Architecture | - | Integration Architecture (IA) is a major part of every company's IT landscape that simplifies the integration of numerous IT components and enables you to trace data flows between applications. | |
| Interface Circle Map | The Interface Circle Map report shows you how different interfaces and applications are linked to each other. Group them alphabetically or by business capabilities and visualize connections between interfaces, provided interfaces, or consumed interfaces. | ||
| Application Landscape - View: Data Classification | The Application Landscape report gives you a color-coded overview of your IT landscape based on the data classification of the underlying data objects. | ||
| Application Matrix - View: Data Classification | The Application Matrix report gives you a color-coded overview of your applications, business capabilities, and user groups based on the data classification of the underlying data objects. | ||
| Cost Management | - | Effectively reduce costs, paving the way for a successful business future. Identify excess funds that could be used elsewhere. | |
| Provider Cost | The Provider Cost report shows you the cost allocation per provider, either as a pie chart or in the table view. | ||
| Business Capability Cost | This report gives you an overview of which business capabilities are supported by which applications and how much this support costs you annually. It helps you understand the cost allocation per business capability and to analyze where costs could be reduced. | ||
| Application Landscape - View: Total annual cost | The Application Landscape report gives you a color-coded overview of your IT landscape based on the aggregated total annual cost of underlying IT components. | ||
| SAP LeanIX Technology Risk and Compliance | Obsolescence Risk Management | - | Obsolescence risk is a factor for all companies. Identify risks associated with running obsolete technology, introduce new technology, or retire existing, legacy applications and IT components. |
| Application Landscape - View: Obsolescence: Aggregated Risk | The Application Landscape report gives you a color-coded overview of your IT landscape based on the aggregated obsolescence risk of all underlying IT components. | ||
| IT Component Landscape - View: Lifecycle | The IT Component Landscape report gives you a color-coded overview of your IT Components. Add filters and switch between different views to drill down until you find what you need, for example, 'Applications: Functional Fit' that use 'End of Life' IT Components. | ||
| IT Component Roadmap | The IT Component Roadmap gives you a Lifecycle view of 'Planned', 'Phased in', 'Active', or 'Phased out' IT Components. You can also apply a drill down, e.g. by 'Children' or 'IT Components' or cluster by Application, User Group, and more. | ||
| Technology Adoption & Standards | - | The use of standardized information technology in large corporations has measurable benefits: reduced training time and costs; lower support and maintenance costs; better bargaining power with a smaller number of vendors; and enhanced communication. Standardization also often goes hand-in-hand with centralization — the process of giving your IT department more control over purchases of hardware and software, as any piece of software equipment added to an IT system requires maintenance, staff training, repairs, patches, upgrades, etc. | |
| IT Component Landscape - View: Lifecycle | The IT Component Landscape report gives you a color-coded overview of your IT Components by lifecycle. | ||
| IT Component Landscape - View: Technical Stack: Resource classification | The IT Component Landscape report gives you a color-coded overview of your IT Components by classification of the underlying resources. | ||
| IT Component Location | The IT Component Location report shows you which IT Components are used by which Country or Location. Zoom in for a better view of your region of interest. | ||
| Provider Portfolio | The Provider Portfolio Report groups Providers according to their 'Criticality' and 'Quality'. It can help you identify Providers that need to be replaced or renewed. | ||
| Vendor Risk Management | - | Vendor risk management (VRM) is the process of ensuring that the use of service providers and IT suppliers does not create an unacceptable potential for business disruption or a negative impact on business performance. | |
| Provider Portfolio | The Provider Portfolio Report groups Providers according to their 'Criticality' and 'Quality'. It can help you identify Providers that need to be replaced or renewed. |
Updated 2 months ago