
Landscape Report
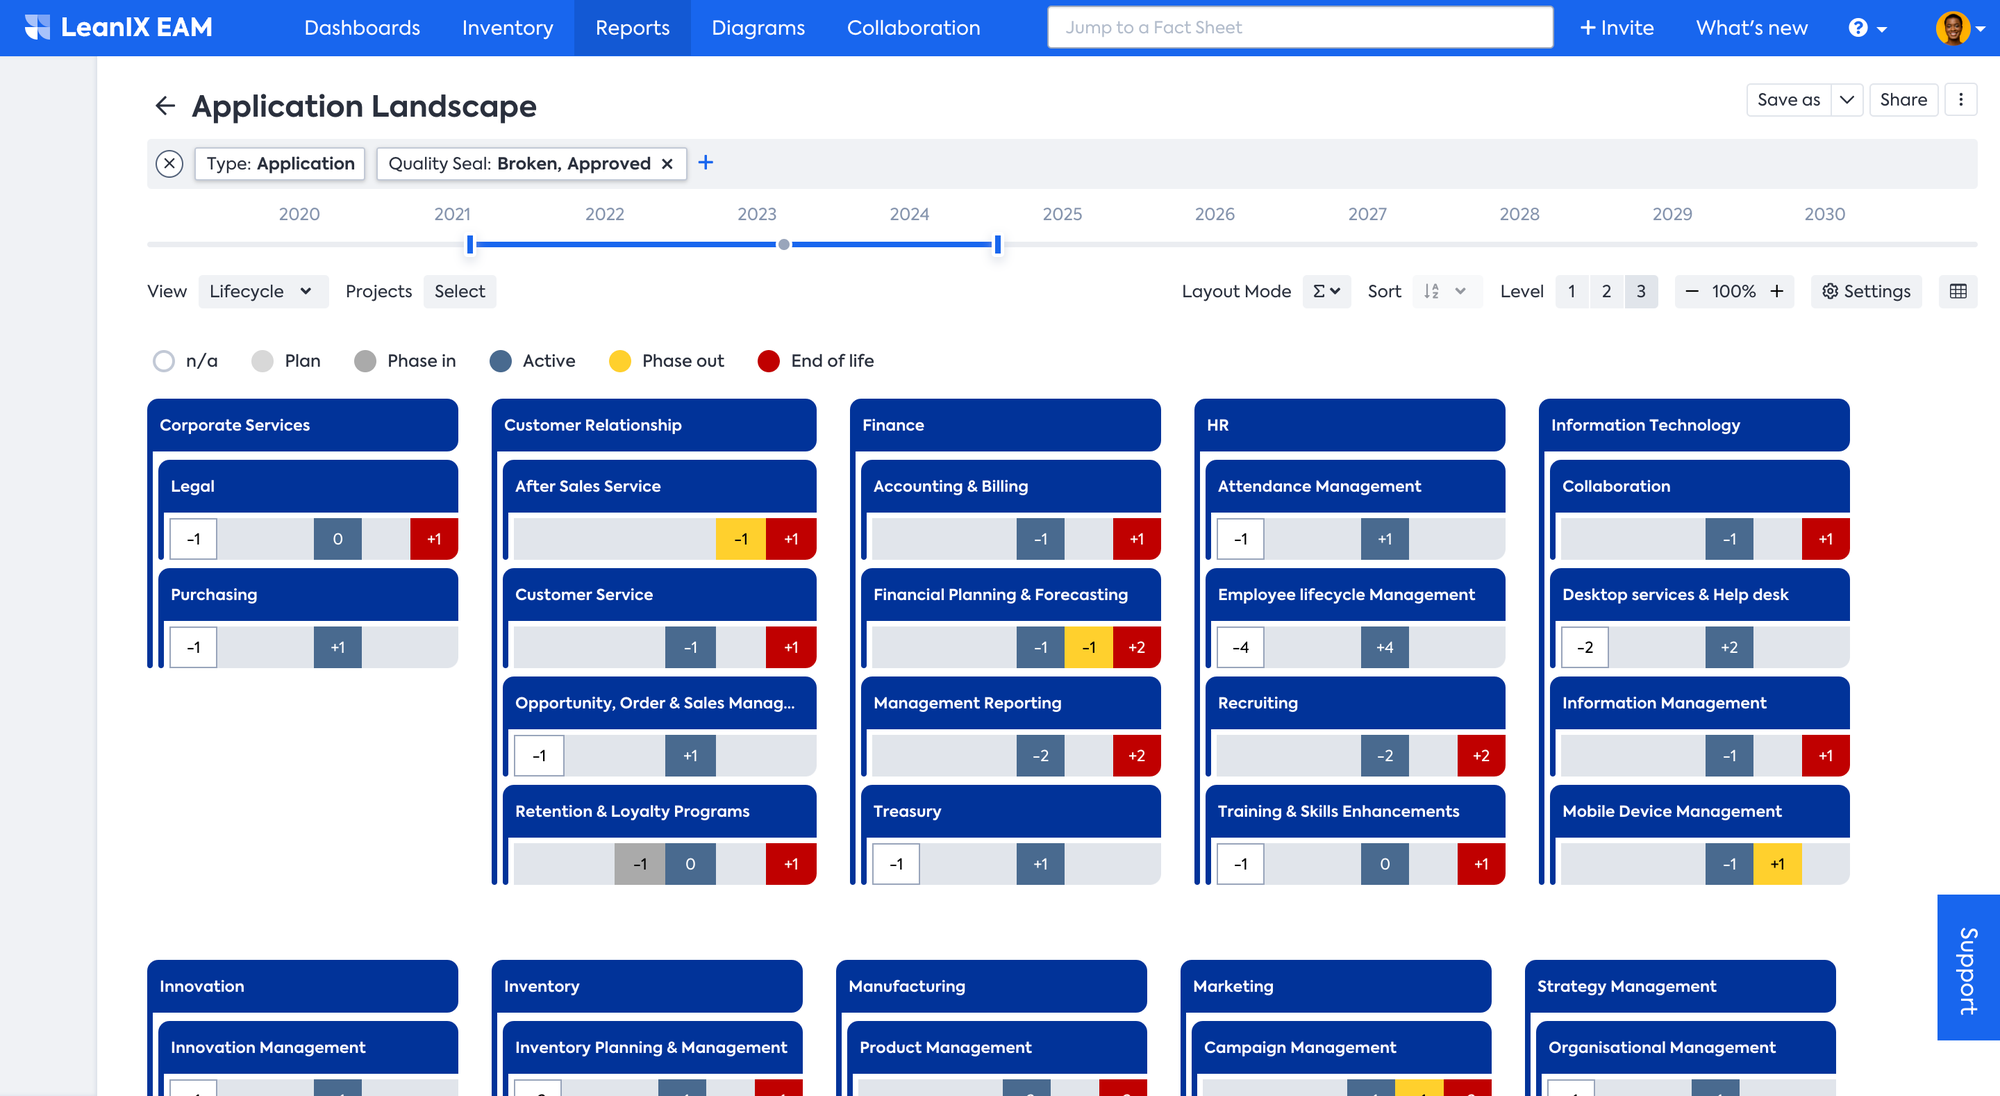
The Landscape Report in SAP LeanIX is a powerful tool that provides a high-level overview of an organization's IT landscape, whether at a specific moment or within a defined time frame. You can organize the information by Business Capabilities, Tech Categories, and many other criteria. The report features a heat map visualization that highlights areas of the landscape that require attention based on factors such as business criticality, technology age, and technical debt, thereby providing a range of insight. By leveraging the Landscape Report in SAP LeanIX, organizations can make informed decisions about their IT investments.
HOW is it useful?
The Landscape Report is useful for several reasons:
- Comprehensive view: The report provides a comprehensive view of an organization's IT landscape, which helps to understand the dependencies, interconnectivity, and overall structure of the technology environment.
- Rationalization and optimization: The report helps in identifying redundant applications, retiring outdated systems, and reducing complexity and cost.
- Alignment: The report helps align IT with business goals by highlighting the technology components that support specific business capabilities.
- Prioritization: The report helps IT leaders decide which projects and investments are most important for the organization's success by identifying critical business capabilities and applications.
- Risk management: The report can also help organizations manage risk by identifying potential points of failure or security vulnerabilities in the IT landscape
Editing in Landscape Report
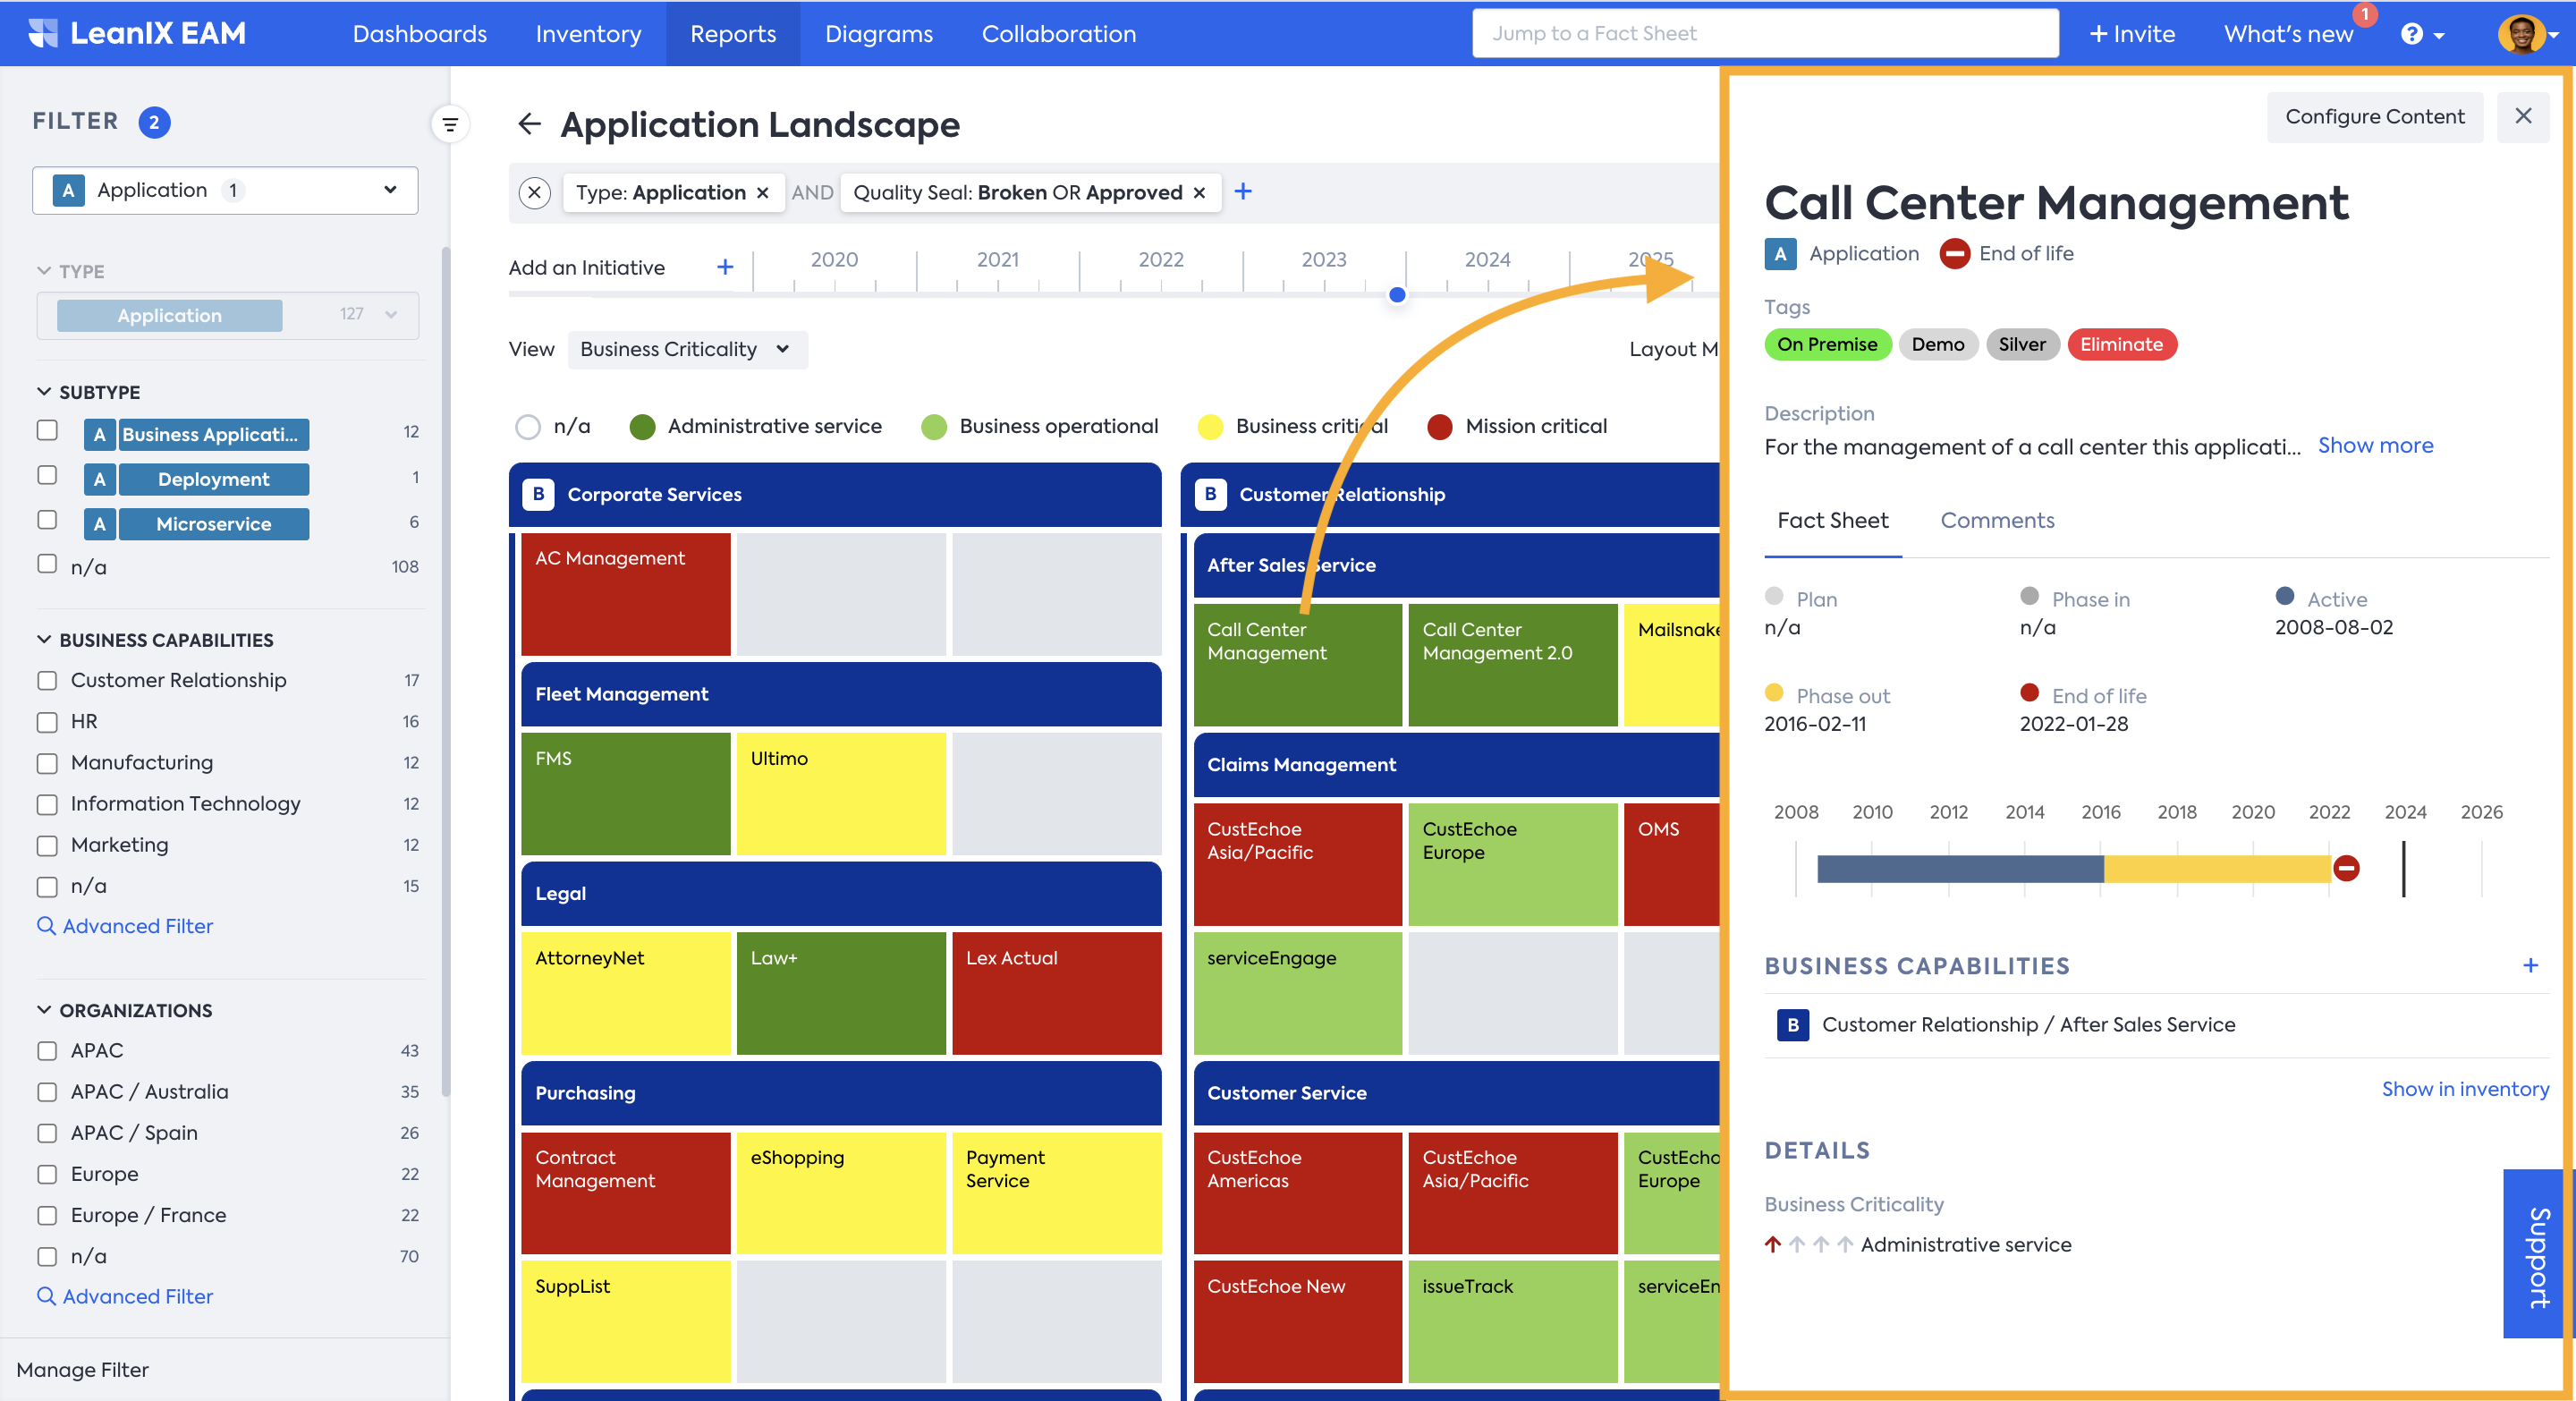
Within the report, users are able to quickly modify tags, attributes, and relations to Fact Sheets using the Edit pane. In order to access the Edit pane in a Landscape report, click on the Application Fact Sheet that requires modification. The right side pane displays information about the Fact Sheet and provides for editing its properties. Any adjustments made are immediately implemented within both the report and the Fact Sheet itself.
Note
- Only the Fact Sheet data that is actually displayed on the report is editable in the pane. A different view or setting (e.g., left and right property) can be applied to modify the report without modifying Fact Sheet's data.
- Since the data represents the current state, editing is only available at the 'Today' date on the timeline, not for the report's past or future states.
Tags
You have the flexibility to remove existing tags or add new tags to a Fact Sheet depending on the Fact Sheet type. To do this, simply click on the Tags area in the Editing pane on the right and directly add or remove tags.
Relations
You can also establish relations between Fact Sheets from the side pane. You can establish a relation by clicking the '+' Add relation icon. Then choose the Fact Sheets to connect by searching for it or by scrolling down.
Note
Only Fact Sheets that are actually displayed on the report are shown and editable in the pane.
Only direct relations to the currently displayed hierarchy levels of the clusters can be displayed. So if the hierarchy of the clusters in the report's view is expanded to the lowest level (e.g., level 3), all relations are visible and editable. However, if the view is aggregated to higher levels (e.g., level 1), no relations to clusters of the lower levels (e.g., level 2 and 3) are visible.
Attributes
The Edit pane displays Fact Sheet data and its attributes based on the View and Settings of the report. For instance, if you select Business Criticality View, then in the Application Landscape Report, the Business Criticality field will be available to edit in the Edit pane.
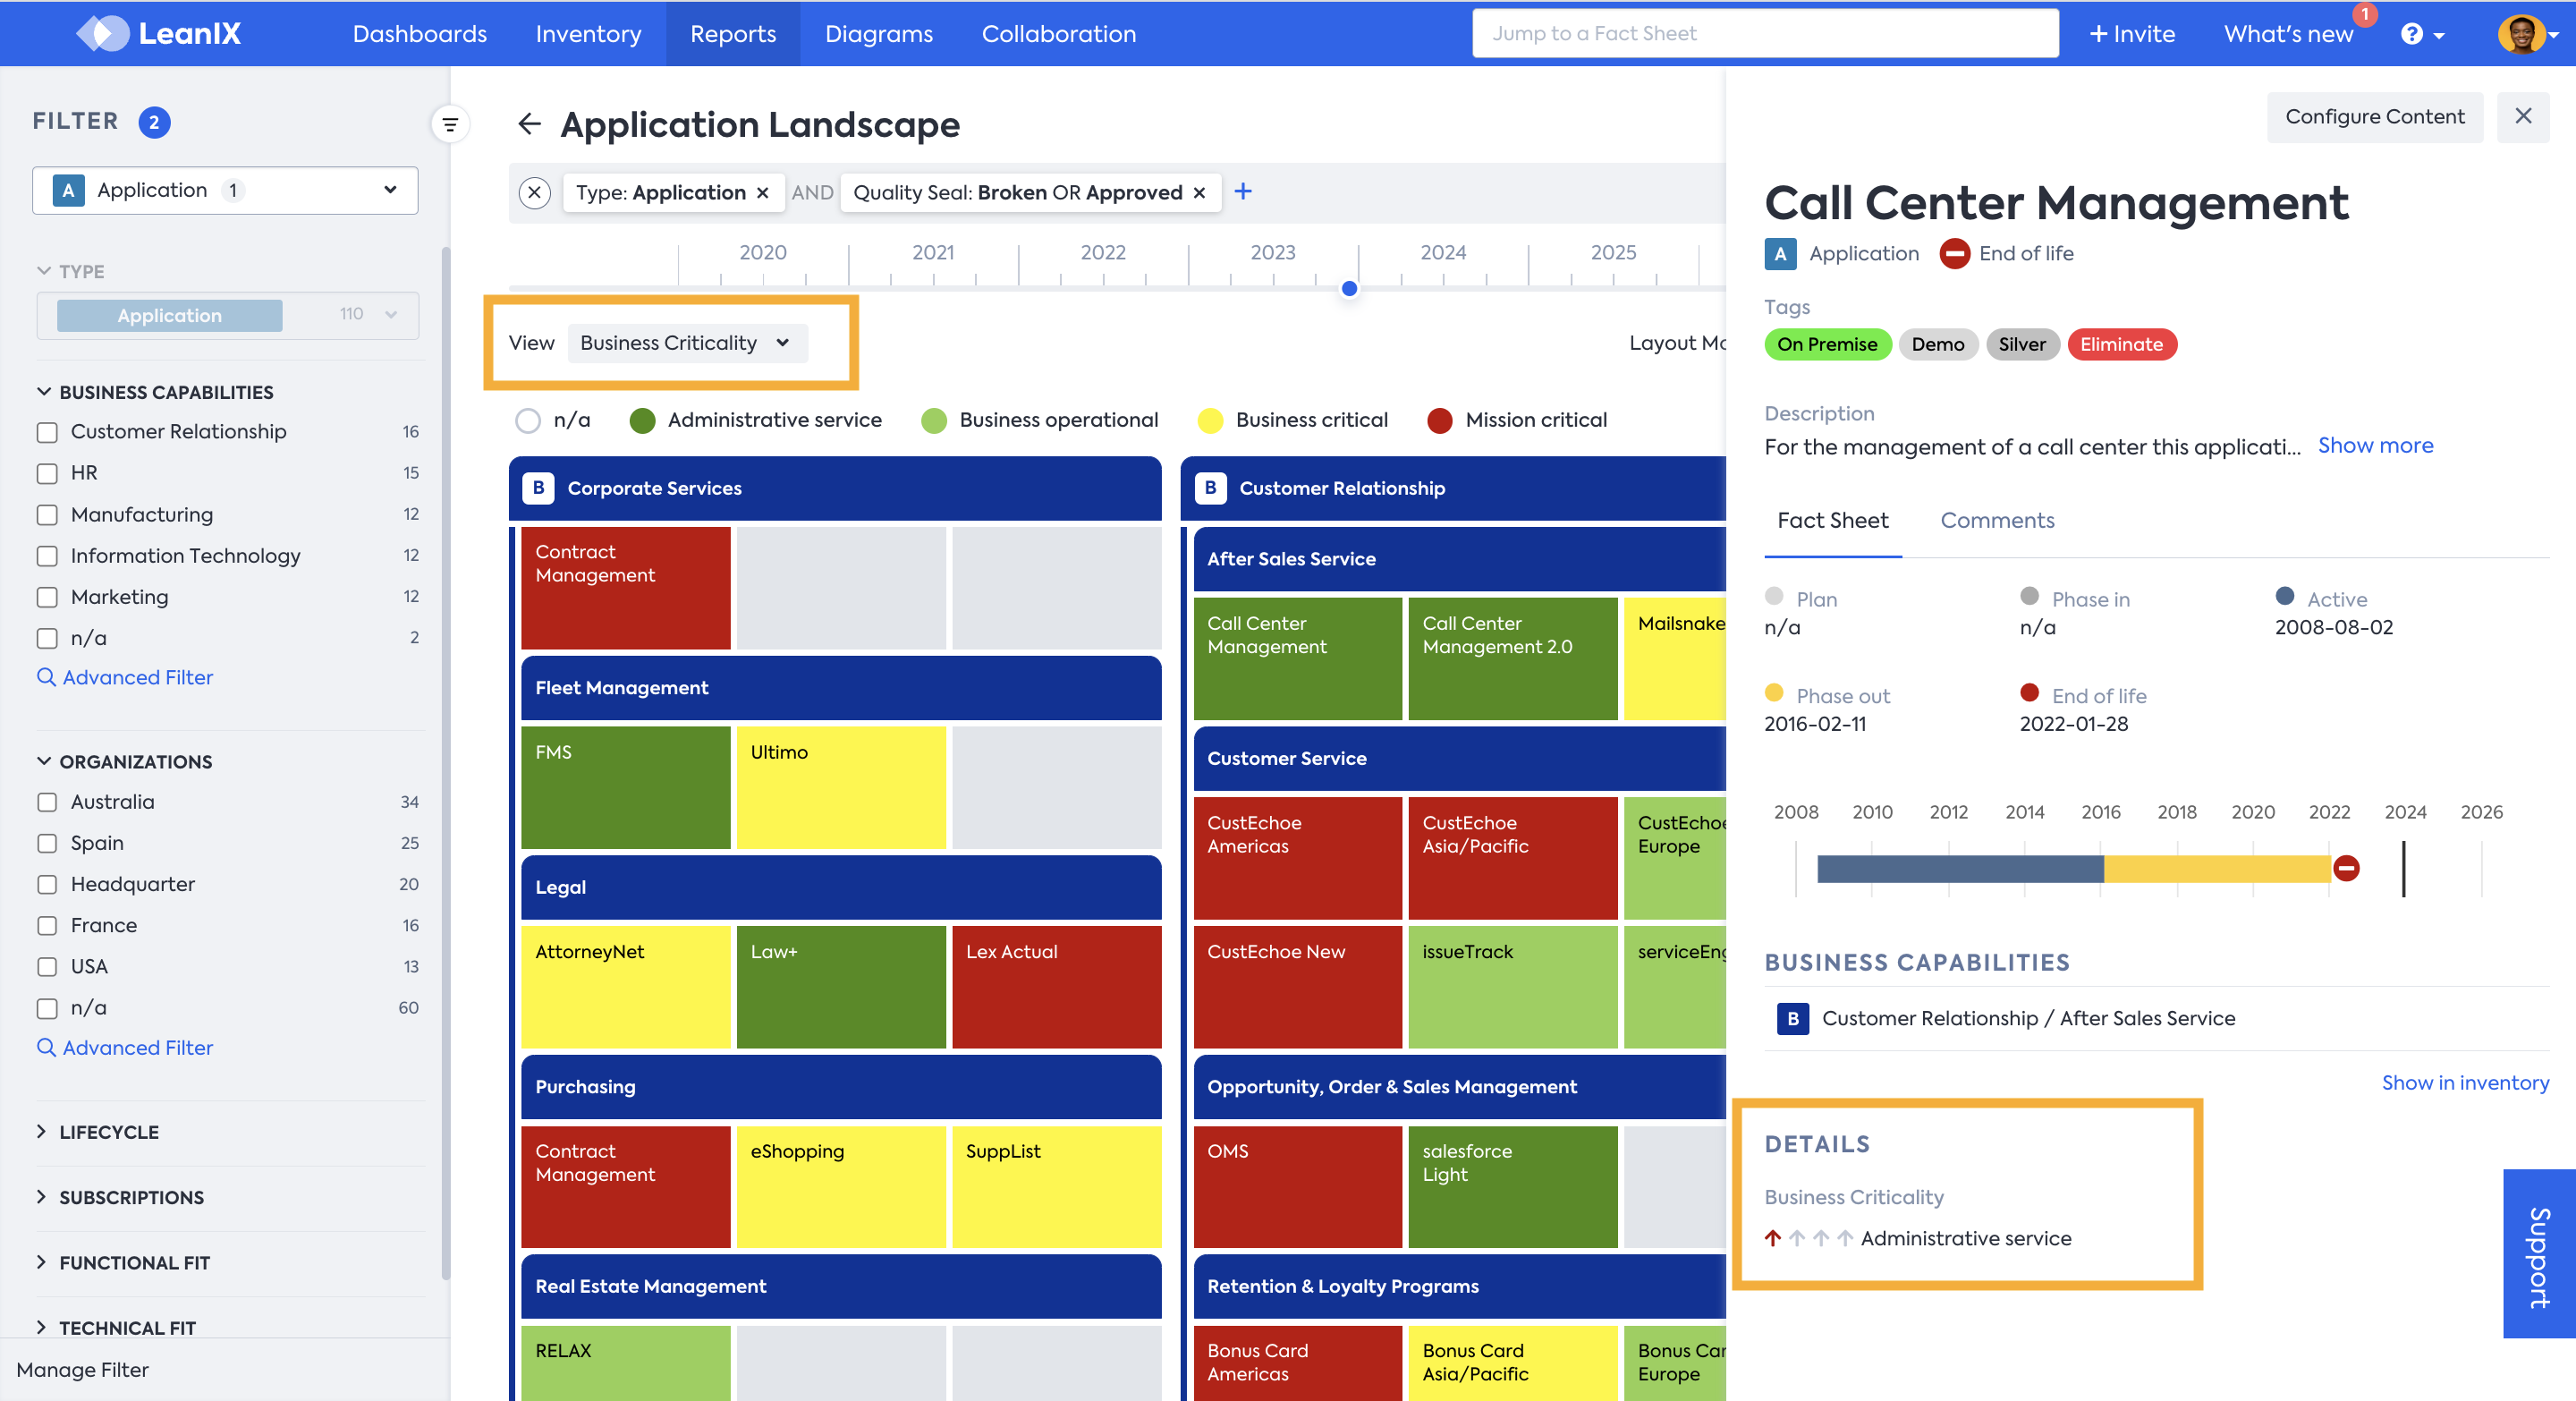
You can also edit the left and right properties displayed on report items in the side pane. You can easily accomplish this by including them in the report properties from the Settings page. Once both fields are enabled, you'll be able to view and edit them in the Edit pane window.
Layout Modes
In Landscape reports, the layout can be changed for different visualizations as well as for better condensation of information. To get to the different layout modes, simply use the Layout Mode drop-down menu and pick a mode.
Different Layout Modes
Differential view
You can compare changes within a given time frame by applying the differential view to a report. On the time slider at the top of the report, select a point in time, press and hold Shift, then select another point in time. To get meaningful insights using the differential view, select a report view that involves dates, such as Lifecycle.
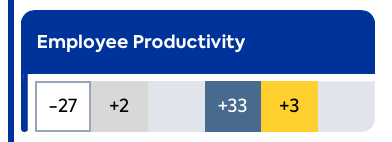
In the differential view combined with the Rolled-up Layout, users can see the number of changes for each view bucket; in the example below in Employee Productivity, three tools are going to a phase-out in the selected time frame:
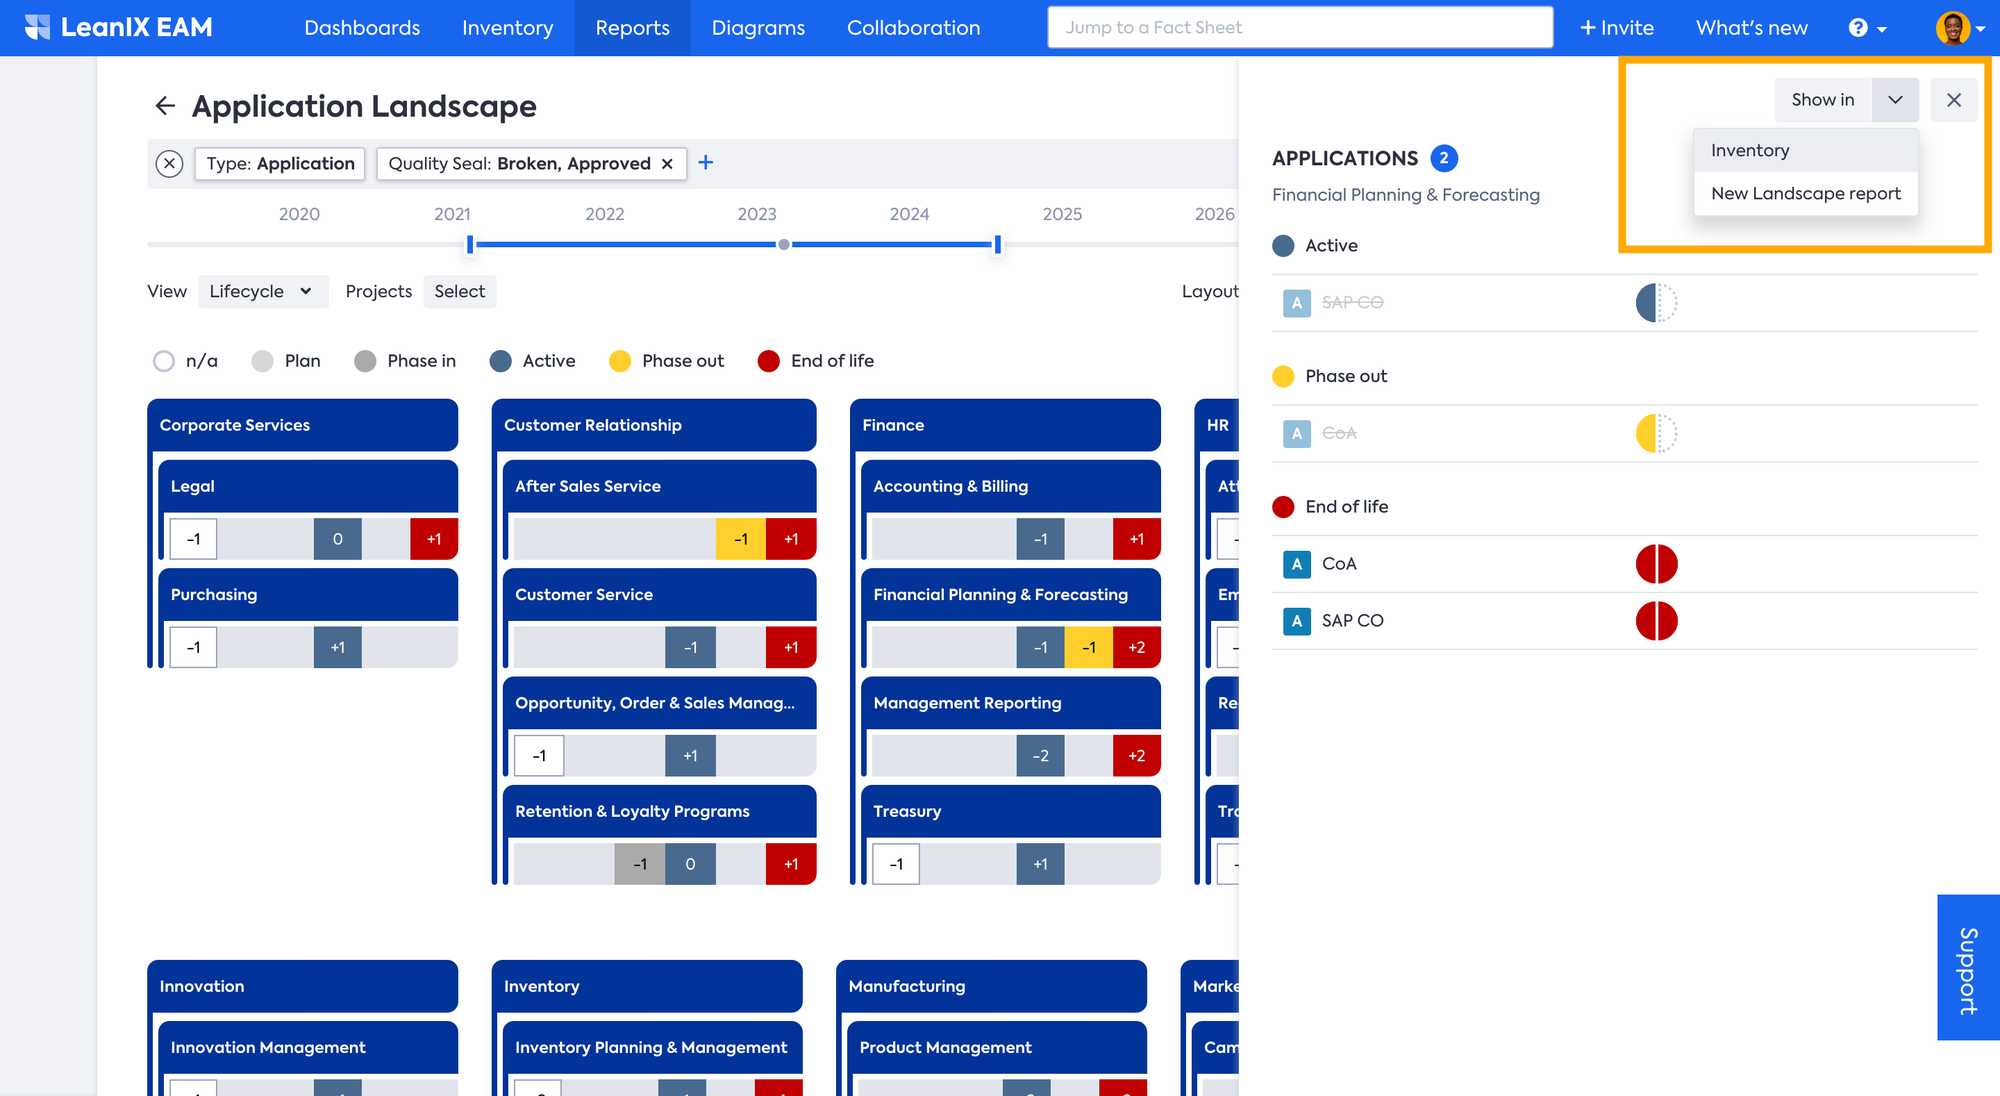
In the Rolled-up Layout, upon clicking on any view bucket, a side pane opens, highlighting the changes:
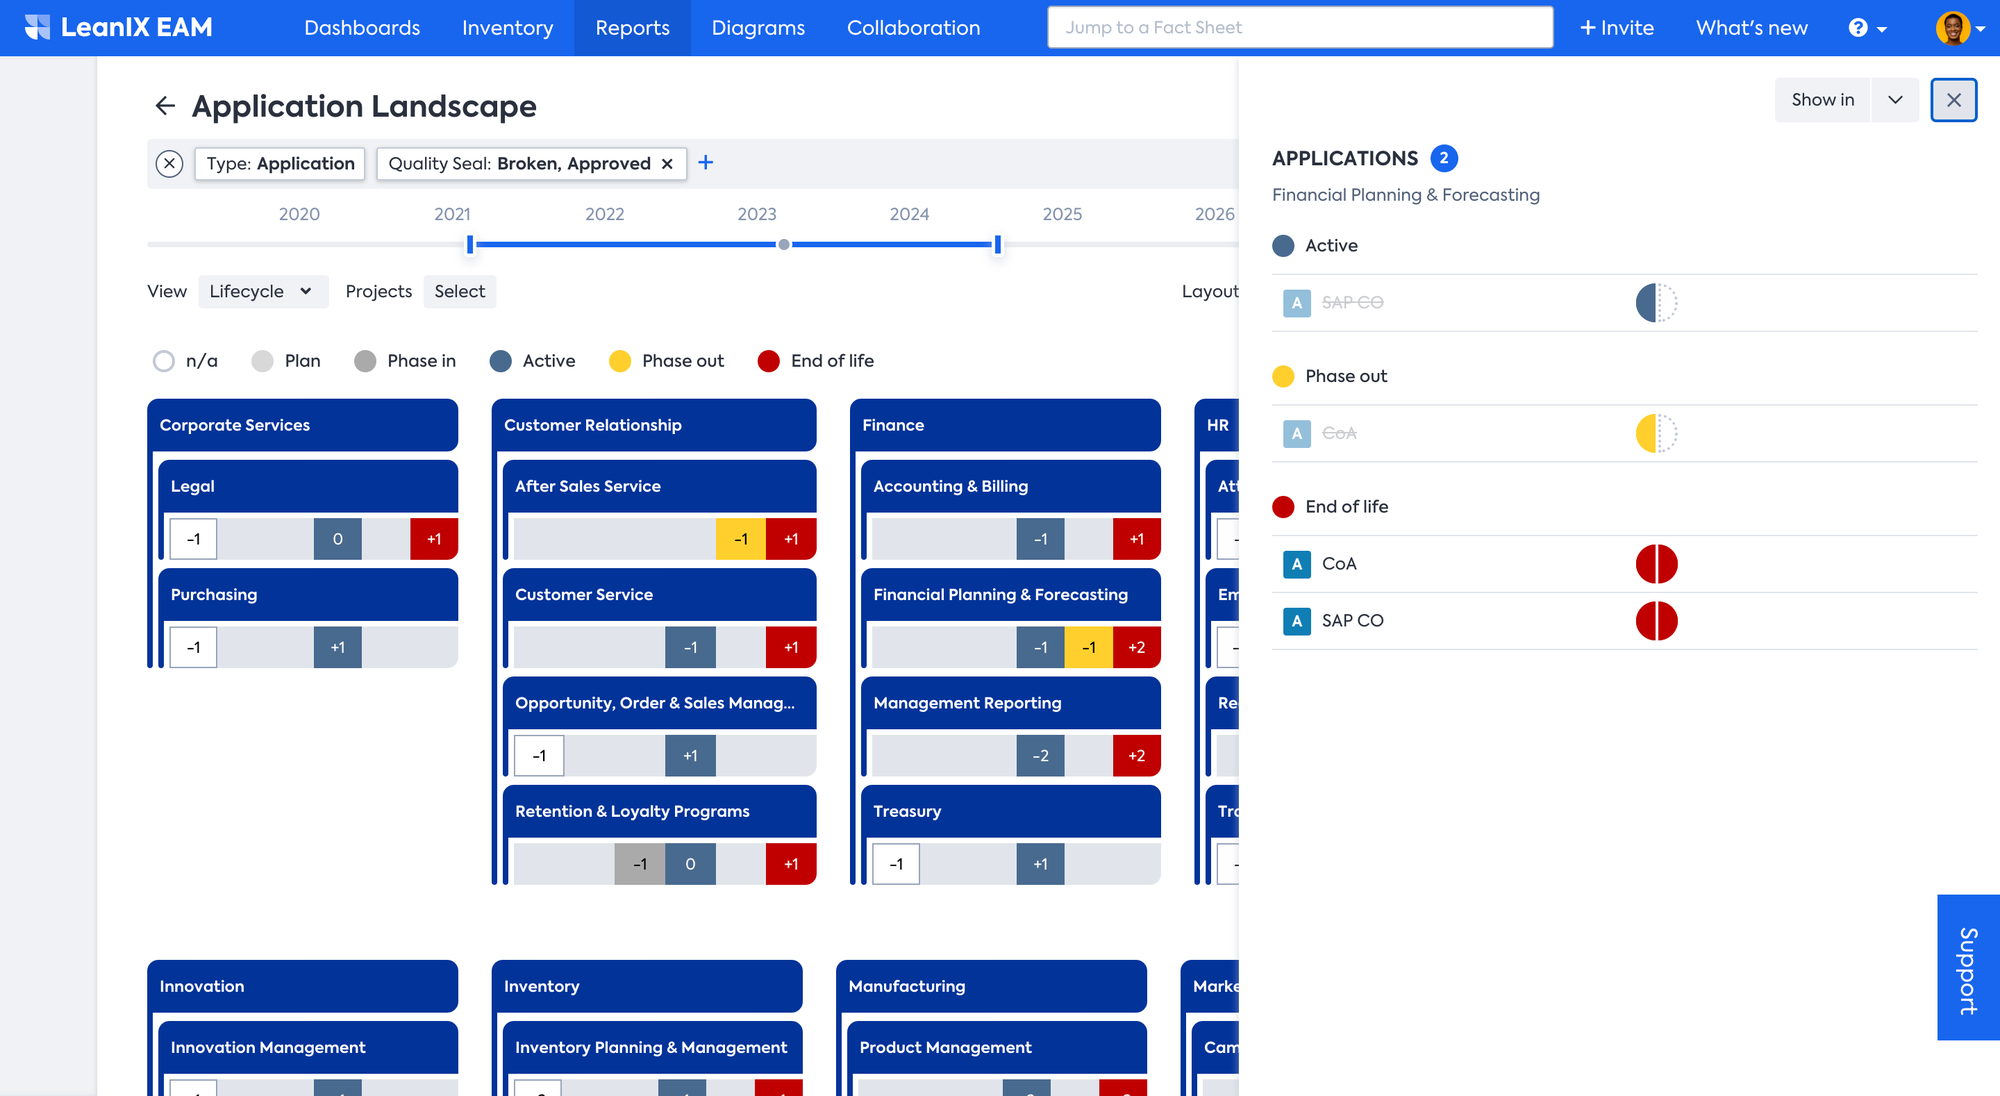
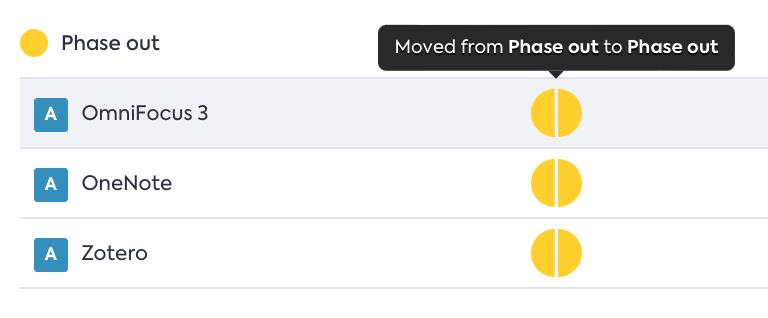
On hovering over, it will also explain what change has been happening:
Users can also navigate from the side pane to a more specific "zoomed in" report by selecting New Landscape report from the Show in drop-down menu.
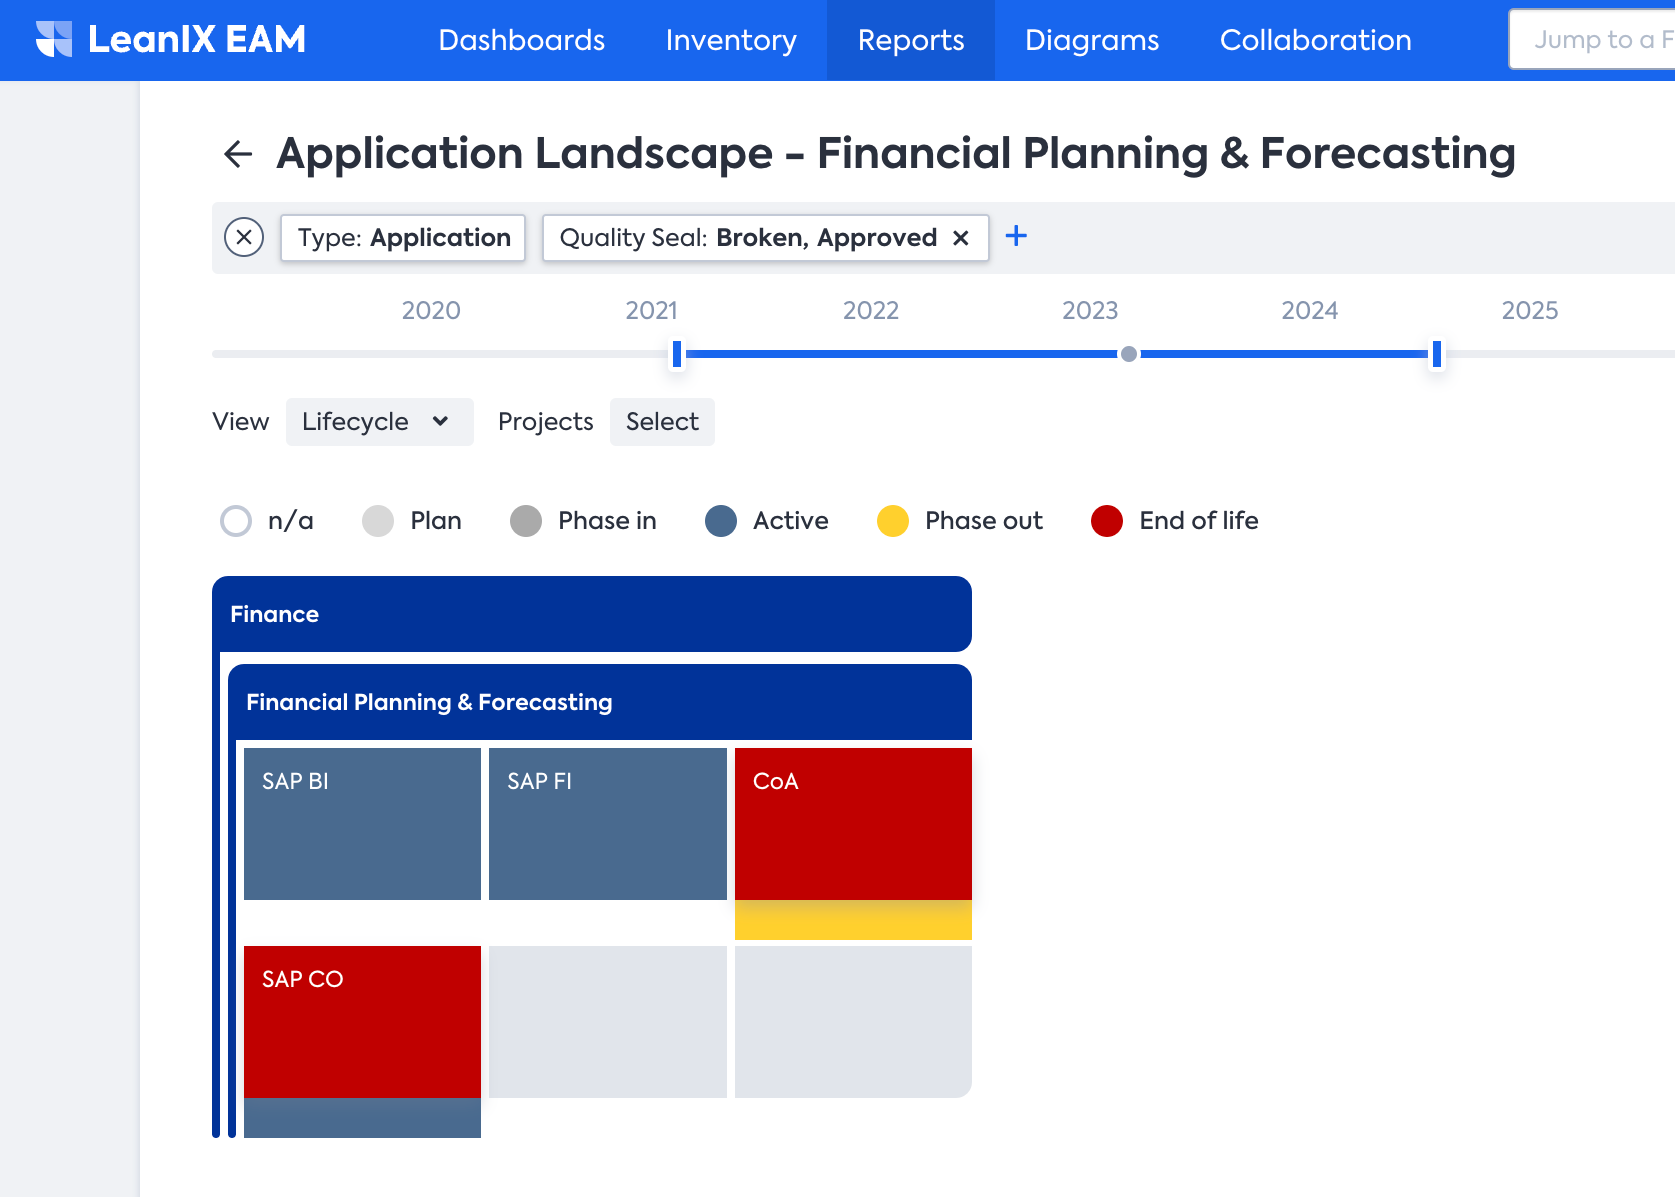
The zoomed-in report opens in a new browser window with the following features:
- The name is changed to highlight the “zoom in”.
- Filters are changed so only the selected cell or cluster is shown
- Any other settings are copied over (e.g., differential view)
- Items in the cell or cluster are sorted by view legend
Updated 2 months ago