
Views Aggregation
Understand and customize aggregation methods in SAP LeanIX views and learn how the obsolescence risk view is aggregated based on IT component lifecycle statuses.
Views Aggregation
Views in reports visualize data using either direct mapping or aggregation:
- Direct mapping: Each fact sheet's color corresponds directly to a single value, such as a value from a single-select field. For example, in the lifecycle view, each fact sheet is assigned a specific lifecycle, which determines its color.
- Aggregation: When the selected view includes fields on relations, fields on related fact sheets, or multi-select fields, the report combines data from multiple fact sheets. For numerical fields, values can be aggregated using sum or average. You can select the preferred aggregation method from the dropdown next to the View dropdown menu.
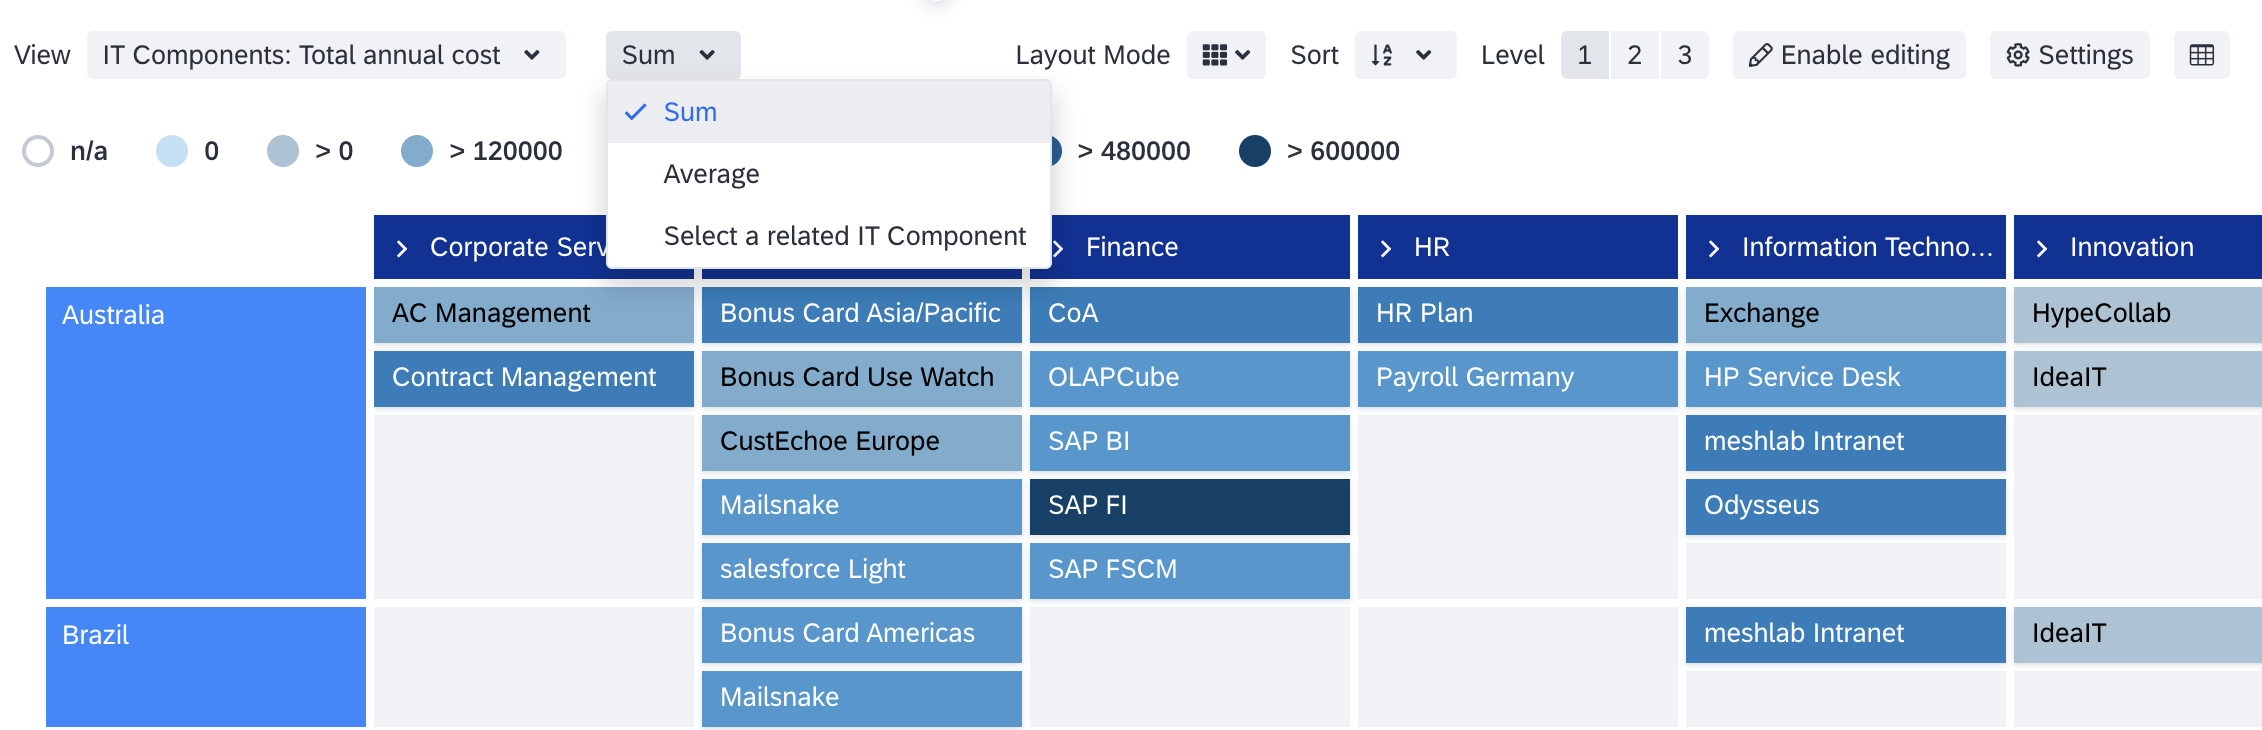
Selecting Views Aggregation Method
For categorical views with multi-select fields, you can display either the ‘minimum’ or ‘maximum’ value. The order of values in the meta-model configuration determines the minimum and maximum values, which also dictate the order in the report legend starting from the left.
Multi-Select Field Visualization
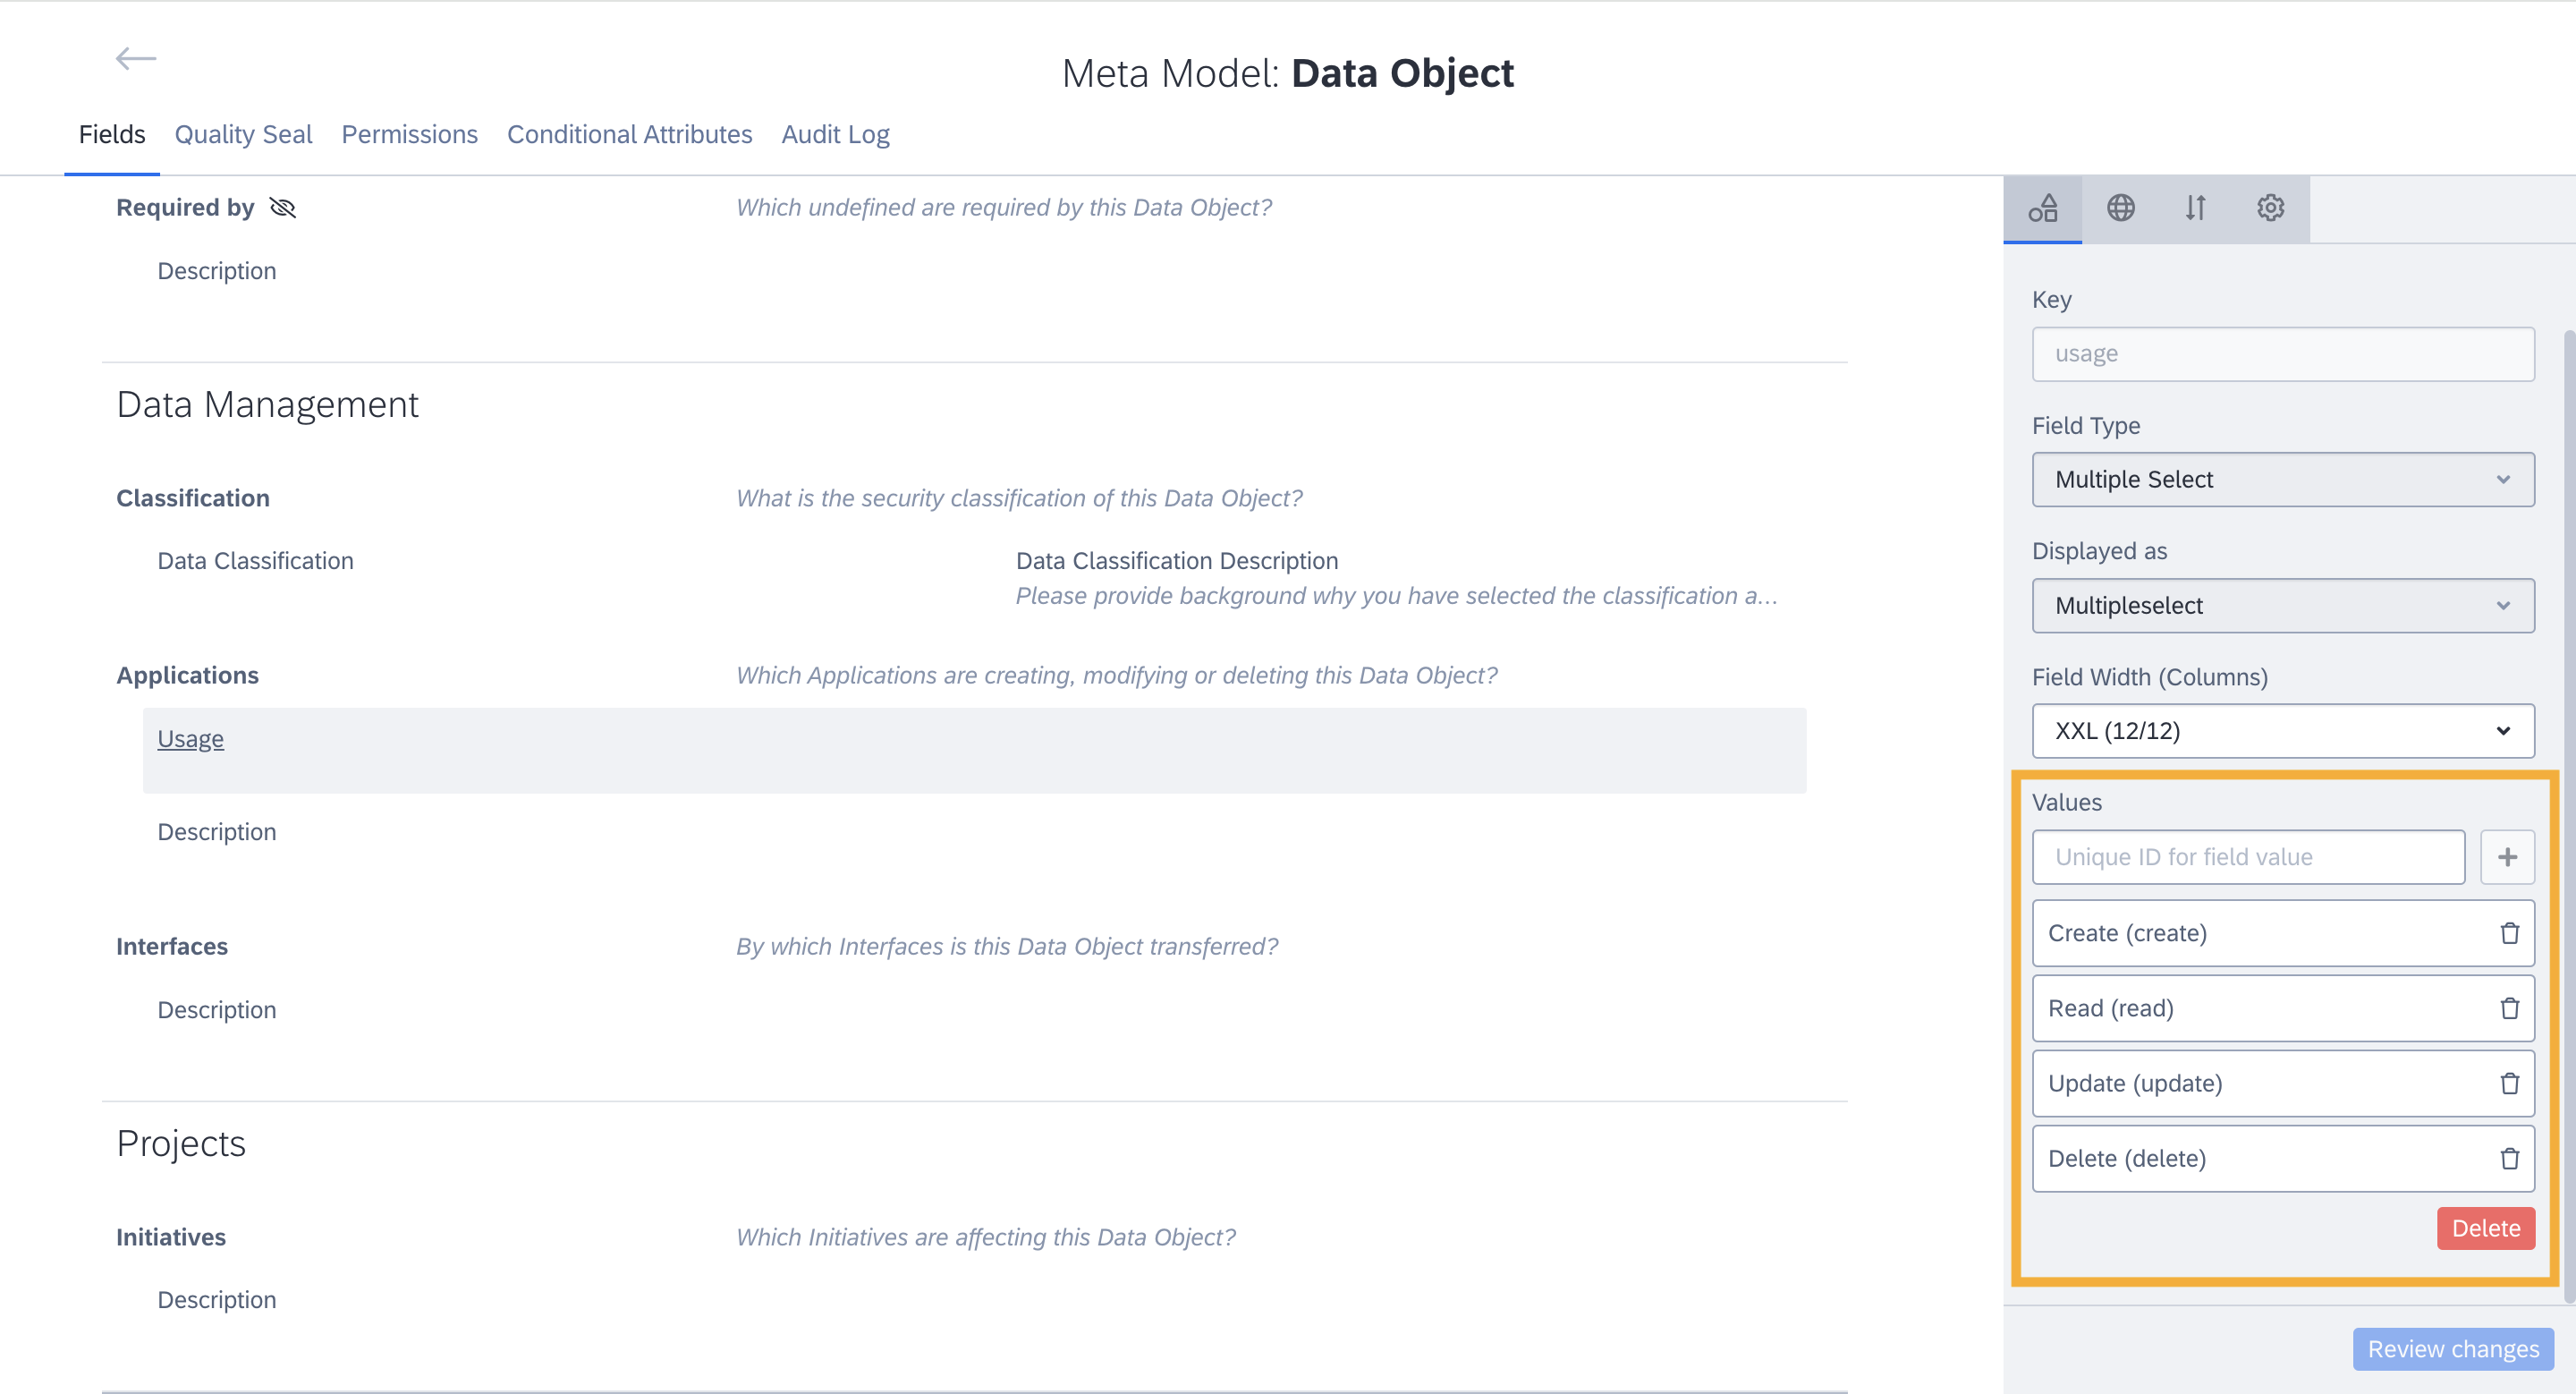
The Order of Values in the Meta-Model Configuration Determines the Minimum and Maximum Value
This chosen view and aggregation settings can be saved as a bookmark. This ensures that only relevant options—such as sum/average for numerical fields and min/max for categorical fields—are displayed. If a view is changed, the default aggregation configured in the meta model is applied until you decide to change it via the dropdown. If you save the view with its current default aggregation, bookmark it, and later change the default in the meta model, the updated default will be applied when you reload the report with the bookmark.
This ensures flexibility and customization while maintaining a clear and intuitive interface.
Selecting a Related Fact Sheet
In addition to the aggregation options, the dropdown menu includes an option that extends customization via the meta model, allowing you to select a specific target fact sheet. This option bypasses aggregation entirely, only offering the view for the selected fact sheet's value.
By selecting a related fact sheet, you can gain detailed insight into a particular data point without the distortion of aggregated data. This can be particularly beneficial when you want to isolate and scrutinize one aspect of your data, sidestepping the broader perspective typically provided by aggregation.
You can select a related fact sheet from the aggregation dropdown next to the View dropdown. Selected view can be saved to a bookmark for future reference. Any changes to the fact sheet, such as adding or removing relations or altering its display name, are automatically updated in the bookmark as well when reopened.
Obsolescence Risk View Aggregation
The aggregated obsolescence risk is calculated based on the lifecycle status of the underlying IT components that support your applications. The calculation for aggregated obsolescence risk considers all IT components related to an application in the following ways:
- Directly linked IT components: IT components that are directly linked to the application via the
relApplicationToITComponentrelation and are active are considered. Inactive relations are excluded; the 'active from/until' field in the relation between IT components and applications determines the active or inactive status. - Indirectly linked IT components: These are IT components indirectly connected to an application either through hierarchical relations
relToChildbetween IT components or as required/required by relationsrelToRequiresbetween IT components.Note
relToRequiresrelations directly between IT components and applications are not considered. - Indirectly linked via other applications: IT components indirectly connected to the application through another application with an active hierarchical relation
relToChildare also included in the risk assessment.
The following order, from highest to lowest, indicates the severity of the risk status of applications:
- Unaddressed End Of Life
- Unaddressed Phase Out
- Missing Lifecycle Information
- Missing IT Component Information
- Risk Accepted
- Risk Addressed
- No Risk
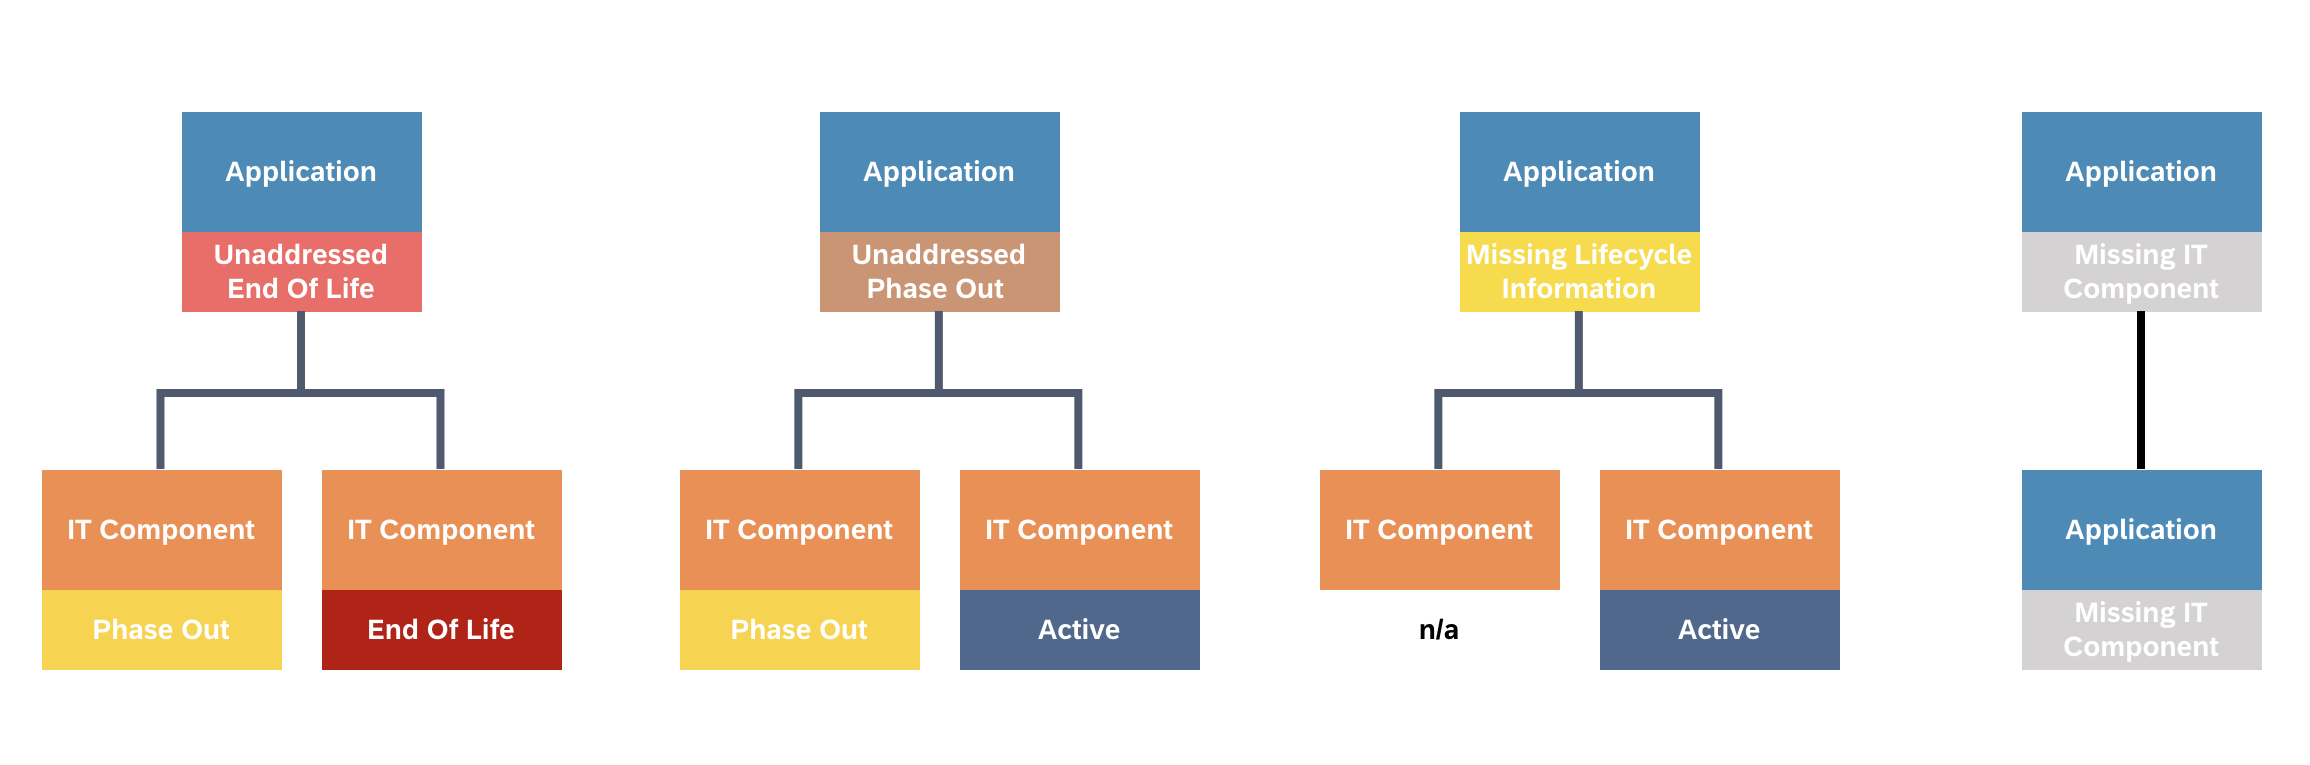
Aggregation of Obsolescence Risk
Note
- Customers using SAP LeanIX Technology Risk and Compliance receive the vendor-provided end-of-life date auto-filled from the reference catalog. To learn more, see Vendor-Provided Lifecycle Information for IT Components.
- The algorithm considers internal, vendor-provided, and custom vendor lifecycle fields for view aggregation
Obsolescence Risk Details
By selecting an application in the report, you can understand the factors contributing to its obsolescence risk score. Selecting an application opens the side panel in landscape, matrix, and roadmap reports, providing you with all the relevant details about the selected application.
You can identify all the fact sheets contributing to the overall risk score and see the weight or severity of each contributing IT component's status. This provides a clearer understanding of the relationships between applications and IT components, enabling better risk management and decision-making.
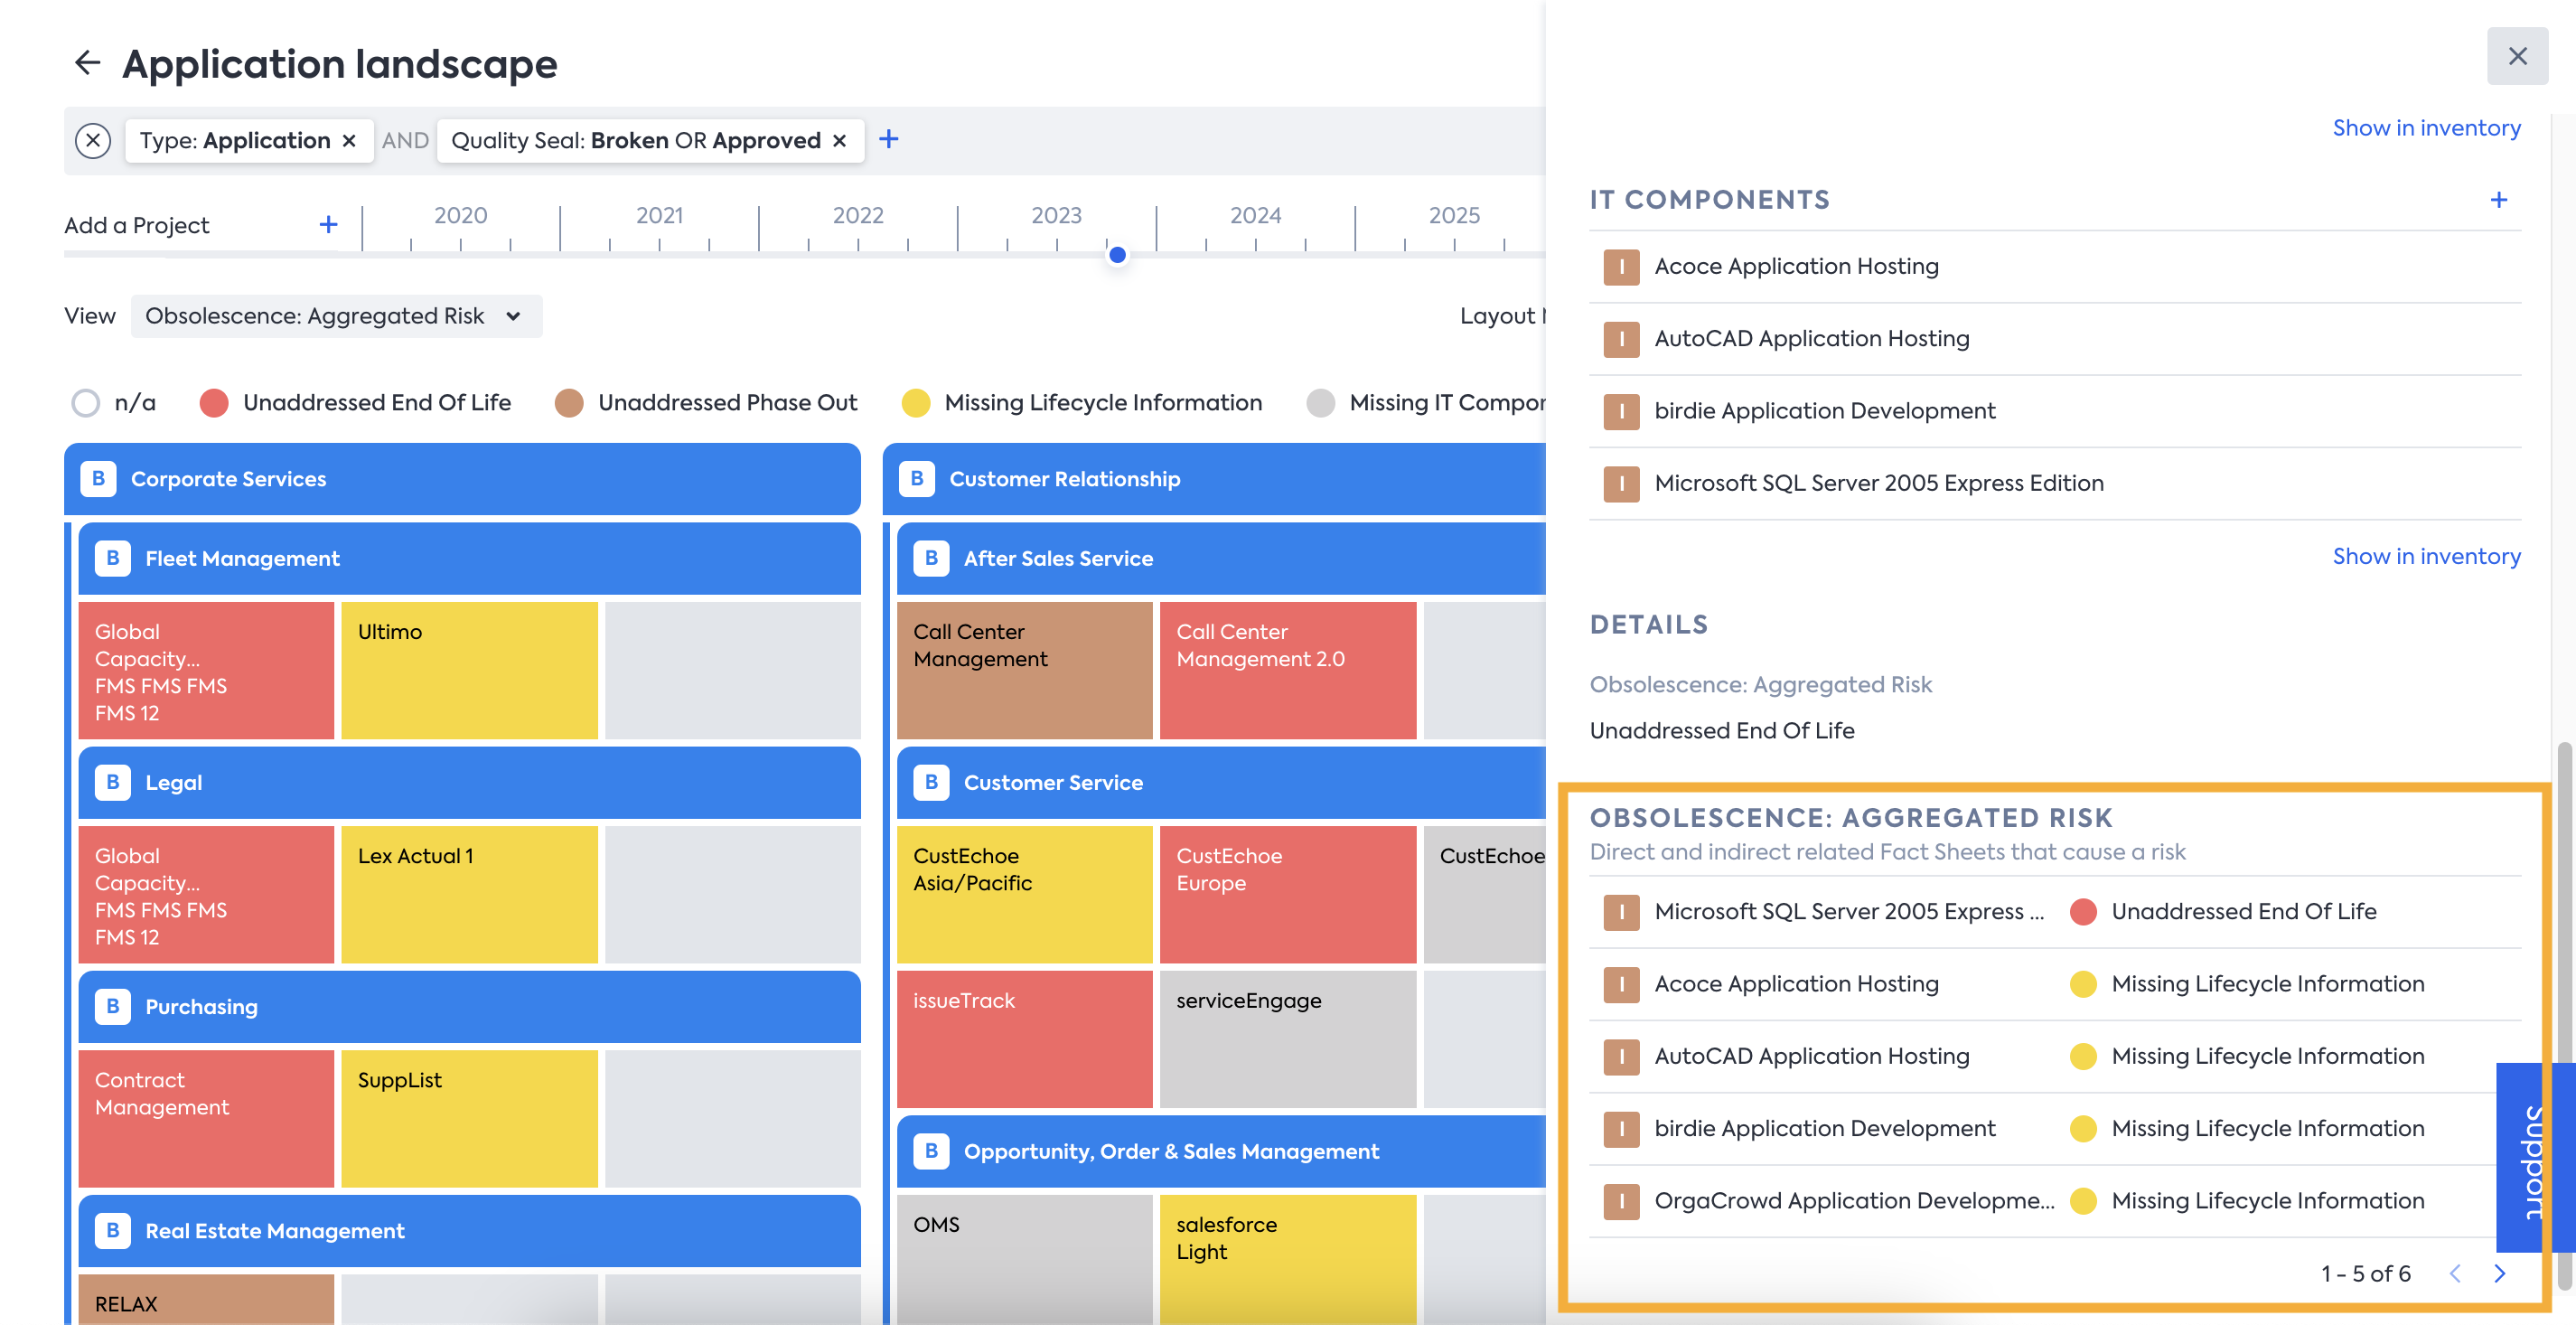
Obsolescence Risk Details in the Side Panel of the Report
Updated 3 months ago