
Roadmap Report
The Roadmap Report is a visual representation of the future direction of an organization's enterprise architecture. It outlines the strategic initiatives, projects, and priorities that the organization plans to undertake to achieve its desired future state.
Roadmap Reports give a timeline view of Applications, IT Components, or Projects and allow users to visualize their organization’s IT strategy and evolution of IT portfolio over time. Different views can be applied, e.g., Functional Fit, Lifecycle, Business Criticality, etc. to see the portfolio of assets across time in different dimensions.
Roadmap Report is configurable and can be set to any of the Fact Sheet types present in the workspace data model. This documentation shows examples from the Application and Project Roadmap Report.
The Roadmap Report is an important tool for organizations to align their IT investments and resources with their business objectives. It enables them to communicate their vision and plans to stakeholders across the organization, including IT leaders, business executives, and other stakeholders. Building a roadmap is typically the final step when running use cases like Application Portfolio Assessment or Application Rationalization.
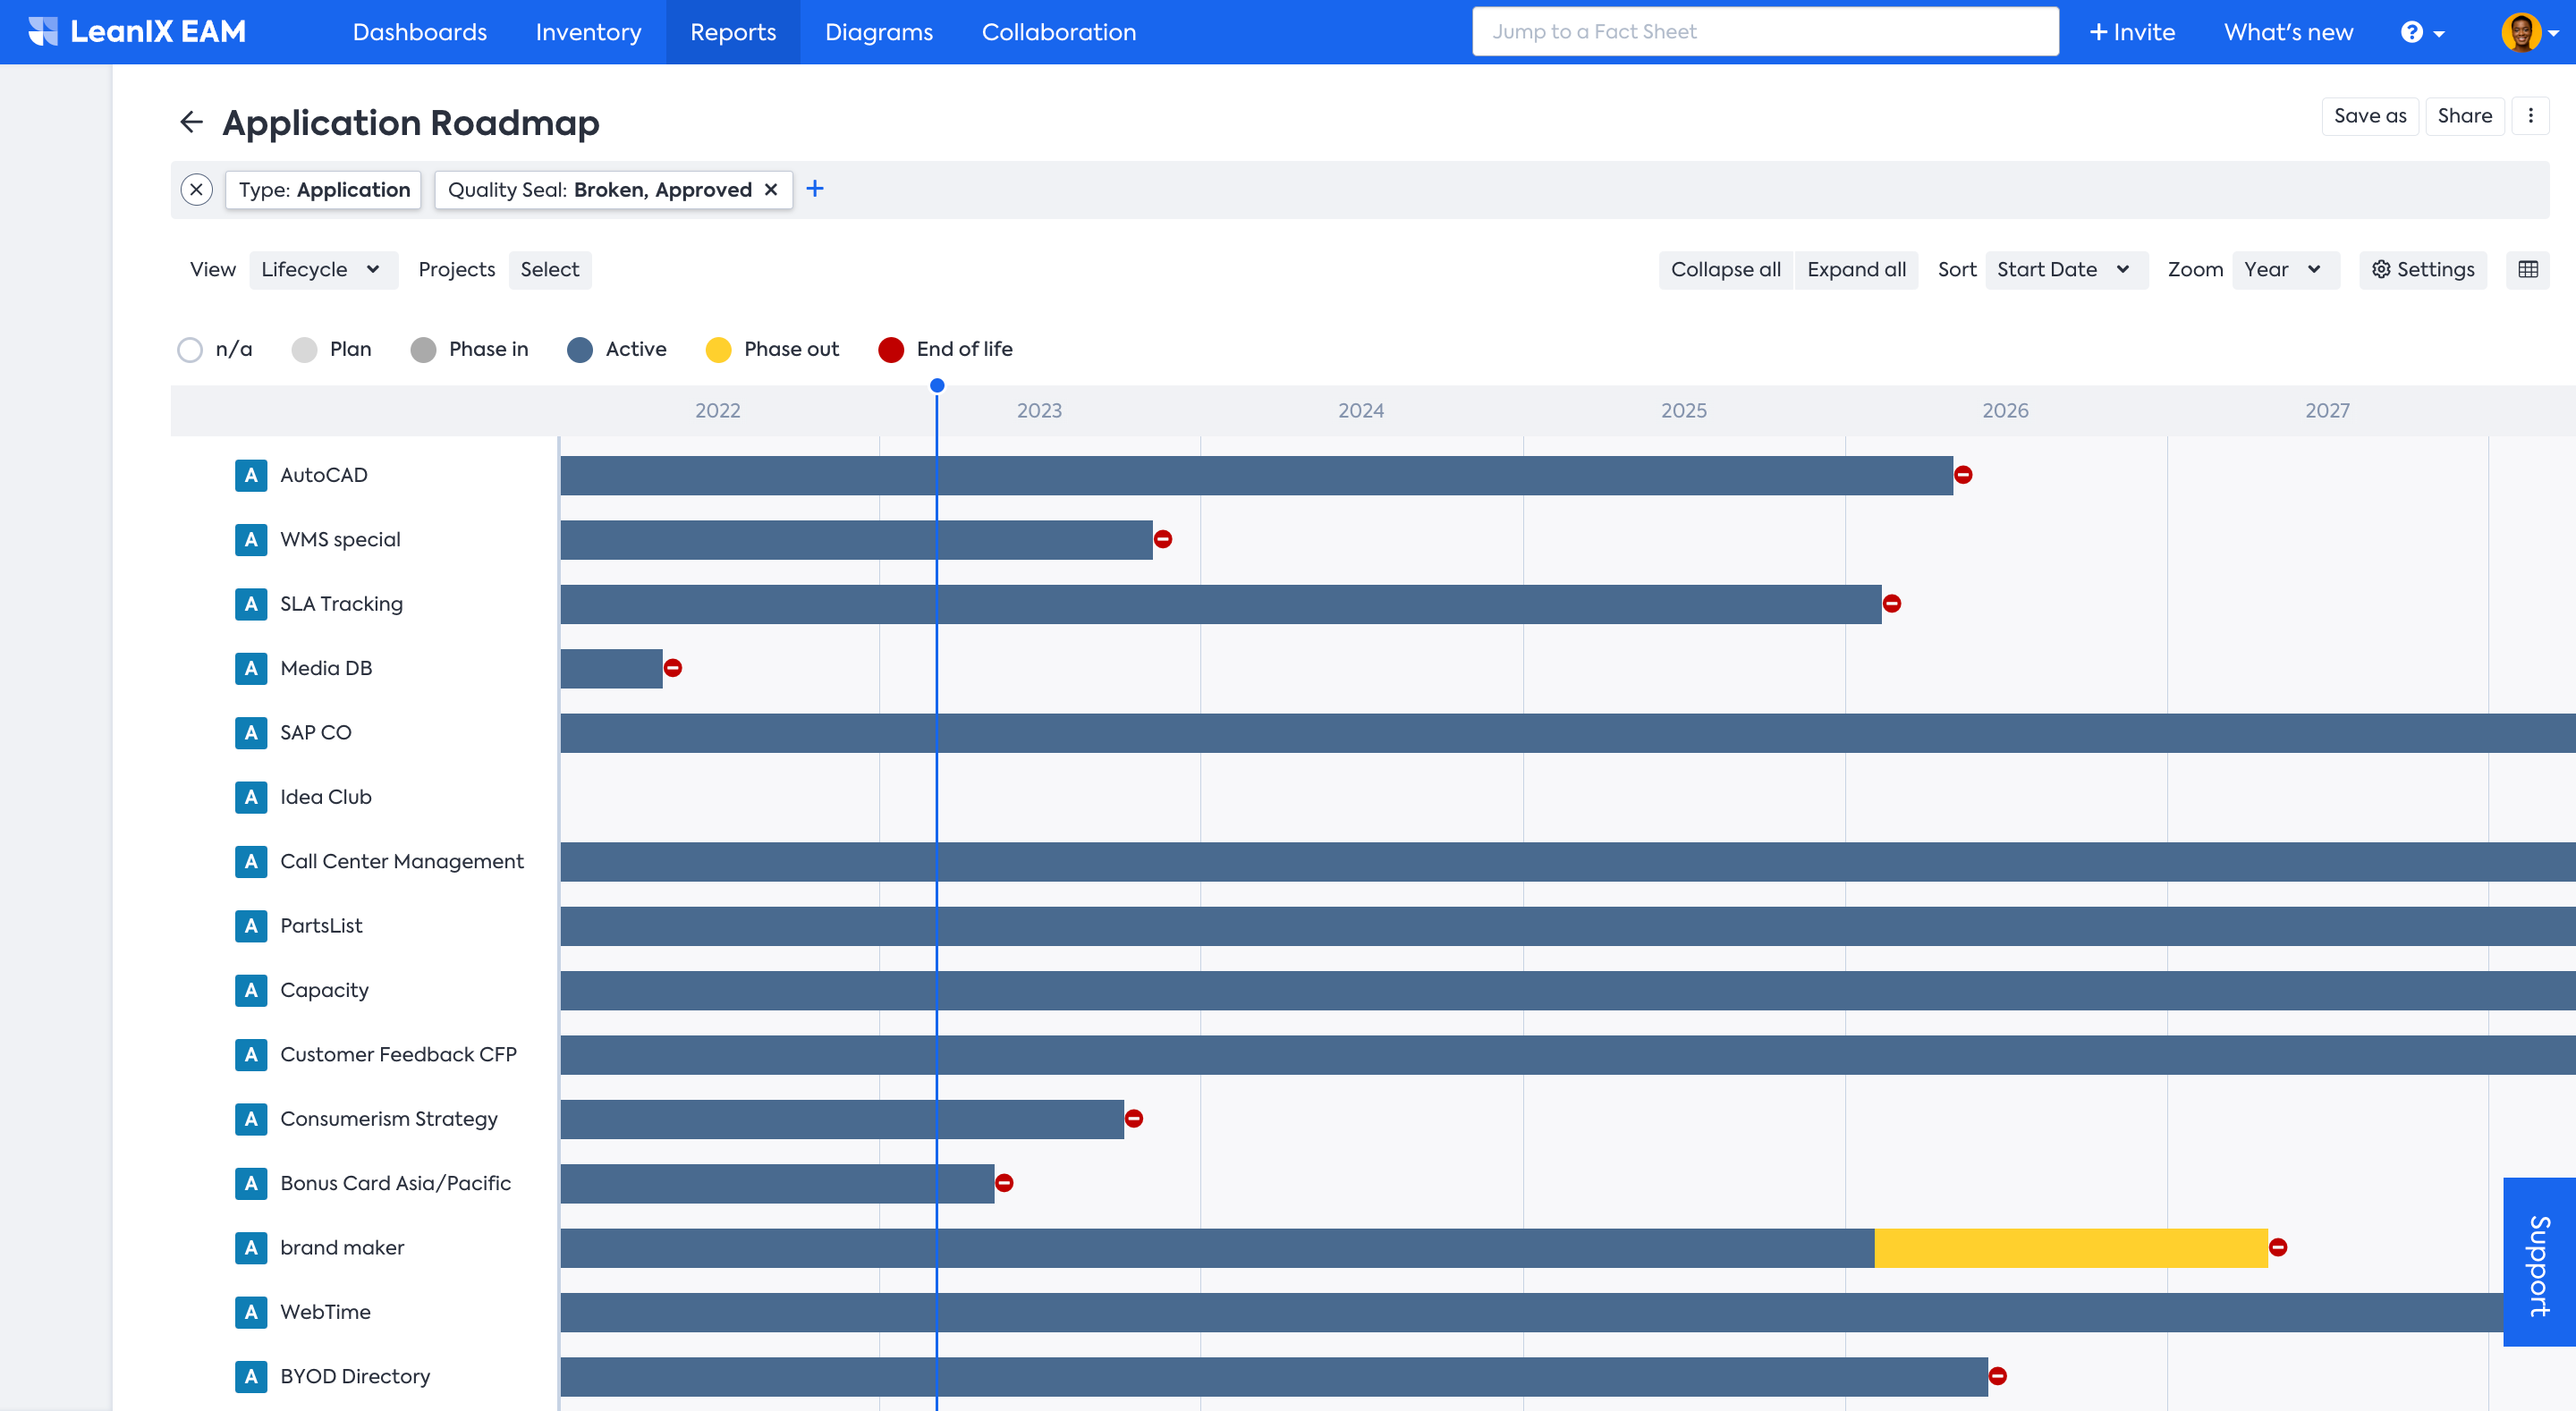
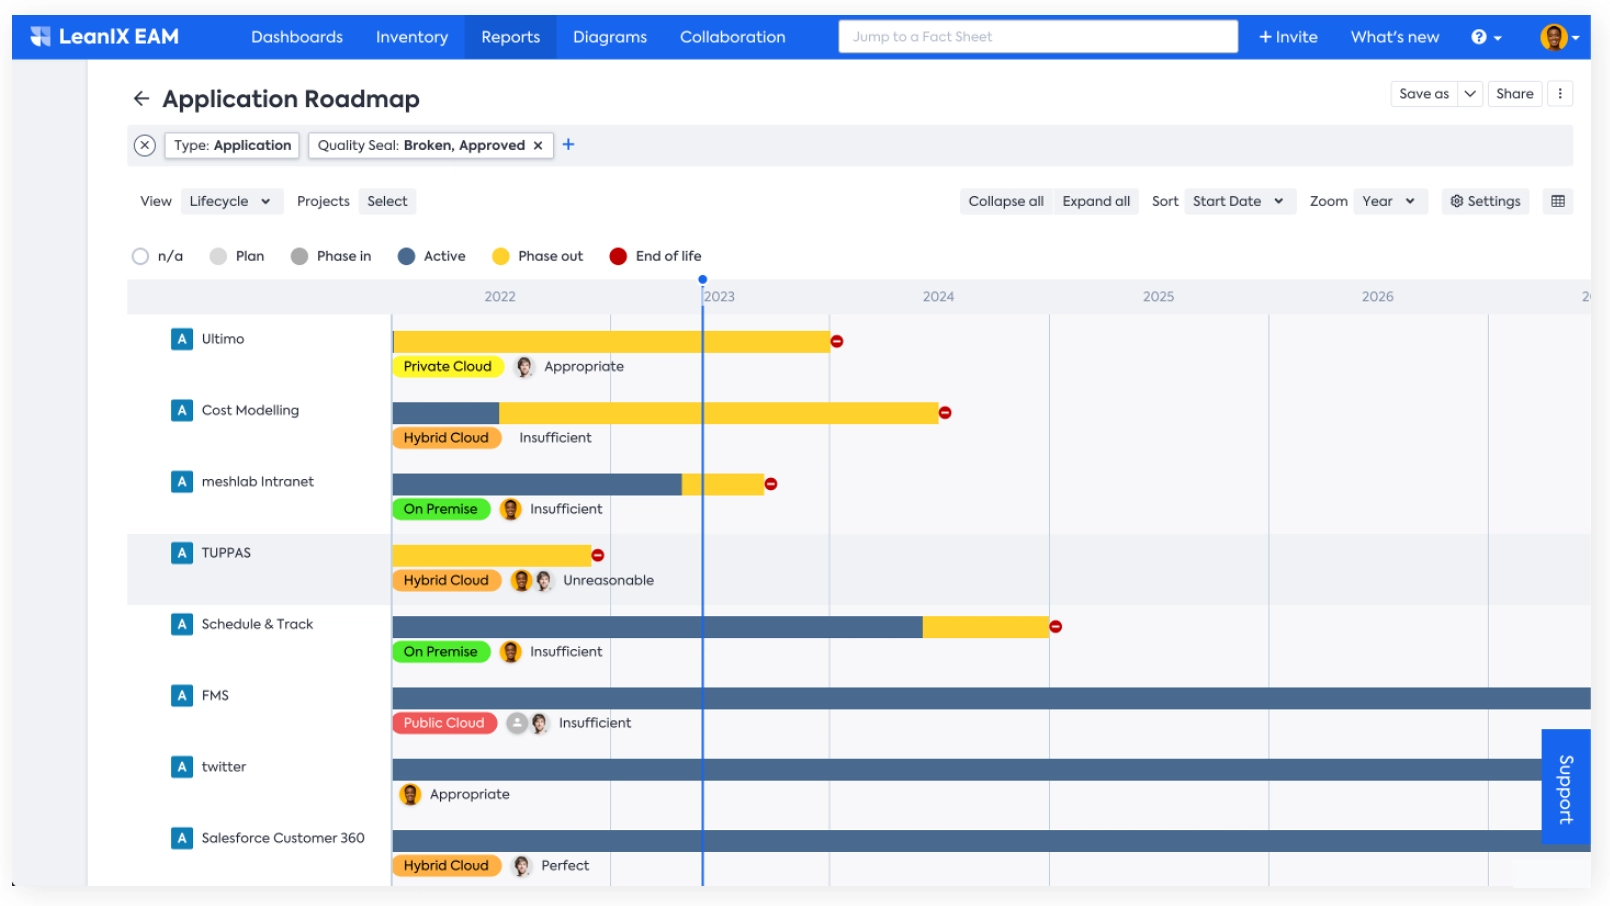
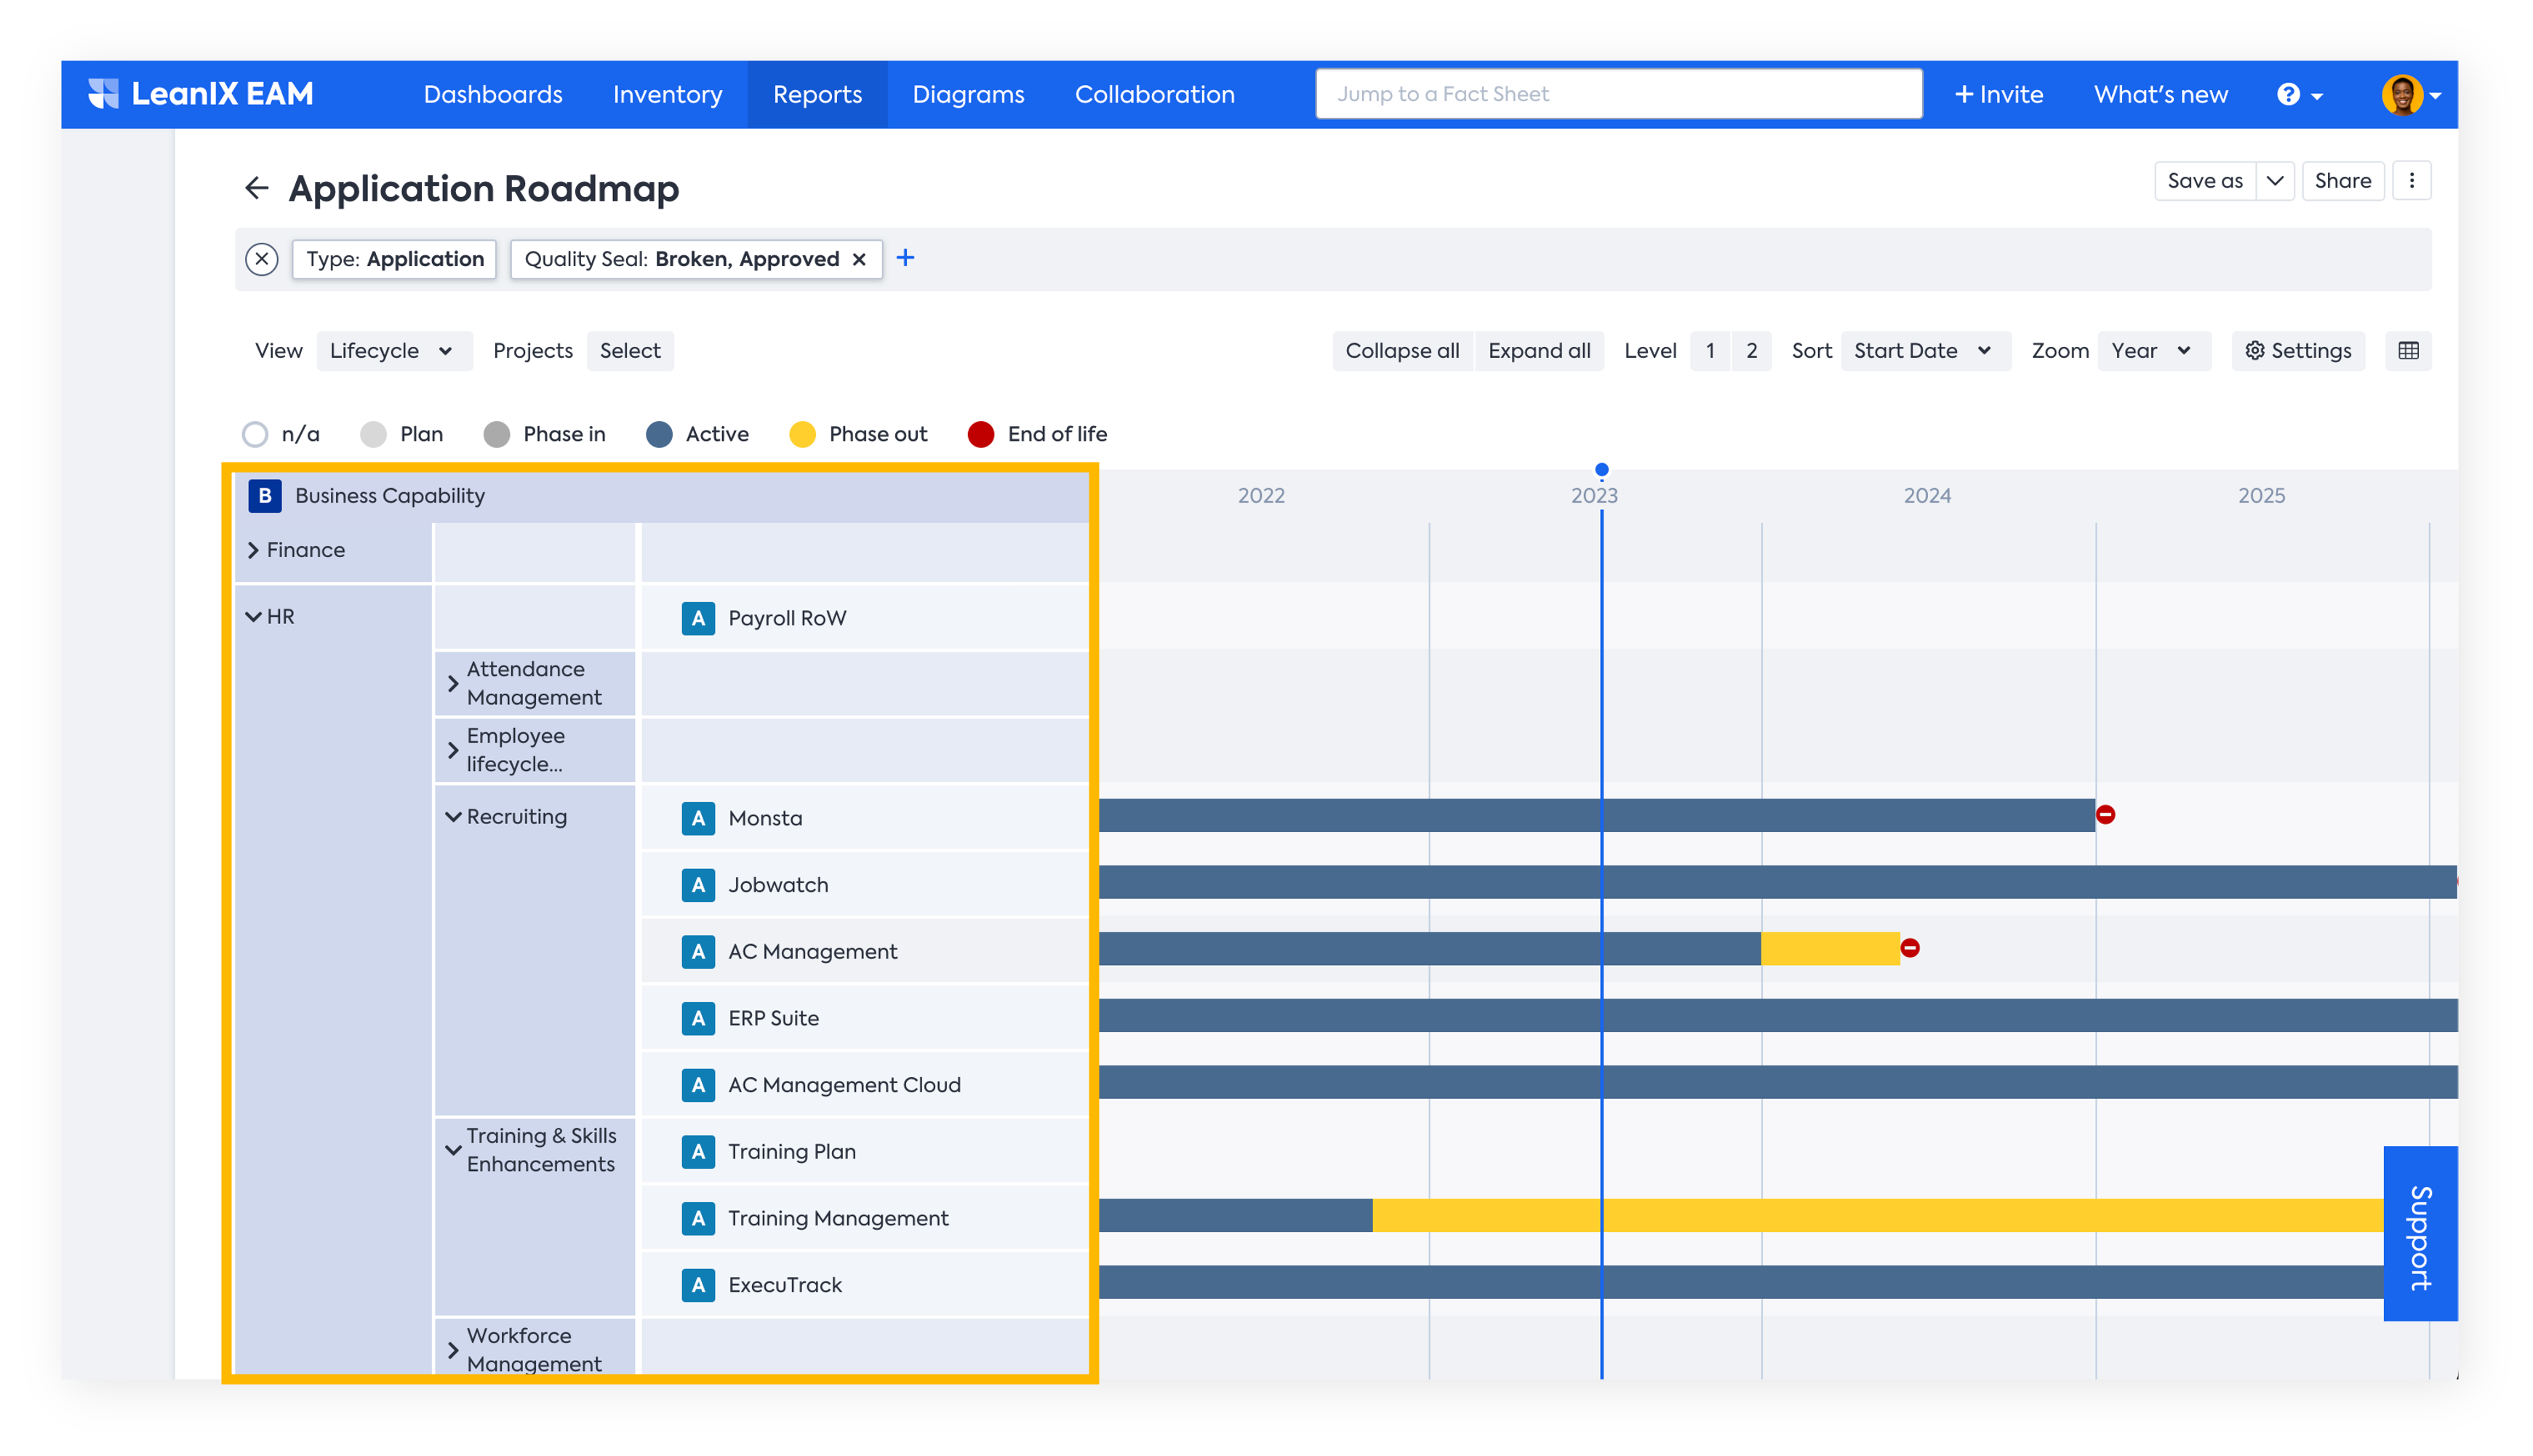
View of the Application Roadmap Report
HOW is it useful?
- Enables continuous improvement: The Roadmap Report is not a one-time exercise but an ongoing process. By regularly updating and revising the report, you can track progress, identify new opportunities, and continuously improve your IT landscape.
- Visualise Projects, Objectives, and Goals: Roadmap Report helps you visually track initiatives and projects that the organization plans to undertake to achieve its goals. Each initiative or project is typically linked to a specific business objective or IT capability.
- Supports strategic decision-making: The timeline section provides a visual representation of when each initiative or project is planned to be executed. This helps stakeholders to understand the sequence of activities and the timing of key milestones.
- Dependencies Analysis: The Roadmap Report allows users to analyze dependencies between different initiatives or projects. Learning about interdependencies helps ensure that the organization achieves its goals.
- What-if Analysis: The Roadmap Report includes what-if analysis capabilities that allow users to model different scenarios and assess the impact on their IT roadmap.
SAP LeanIX Architecture and Road Map Planning enriches your Roadmap Reports by visualizing the impacts that are planned using transformations over time. Read more here.
Using the Roadmap Reports
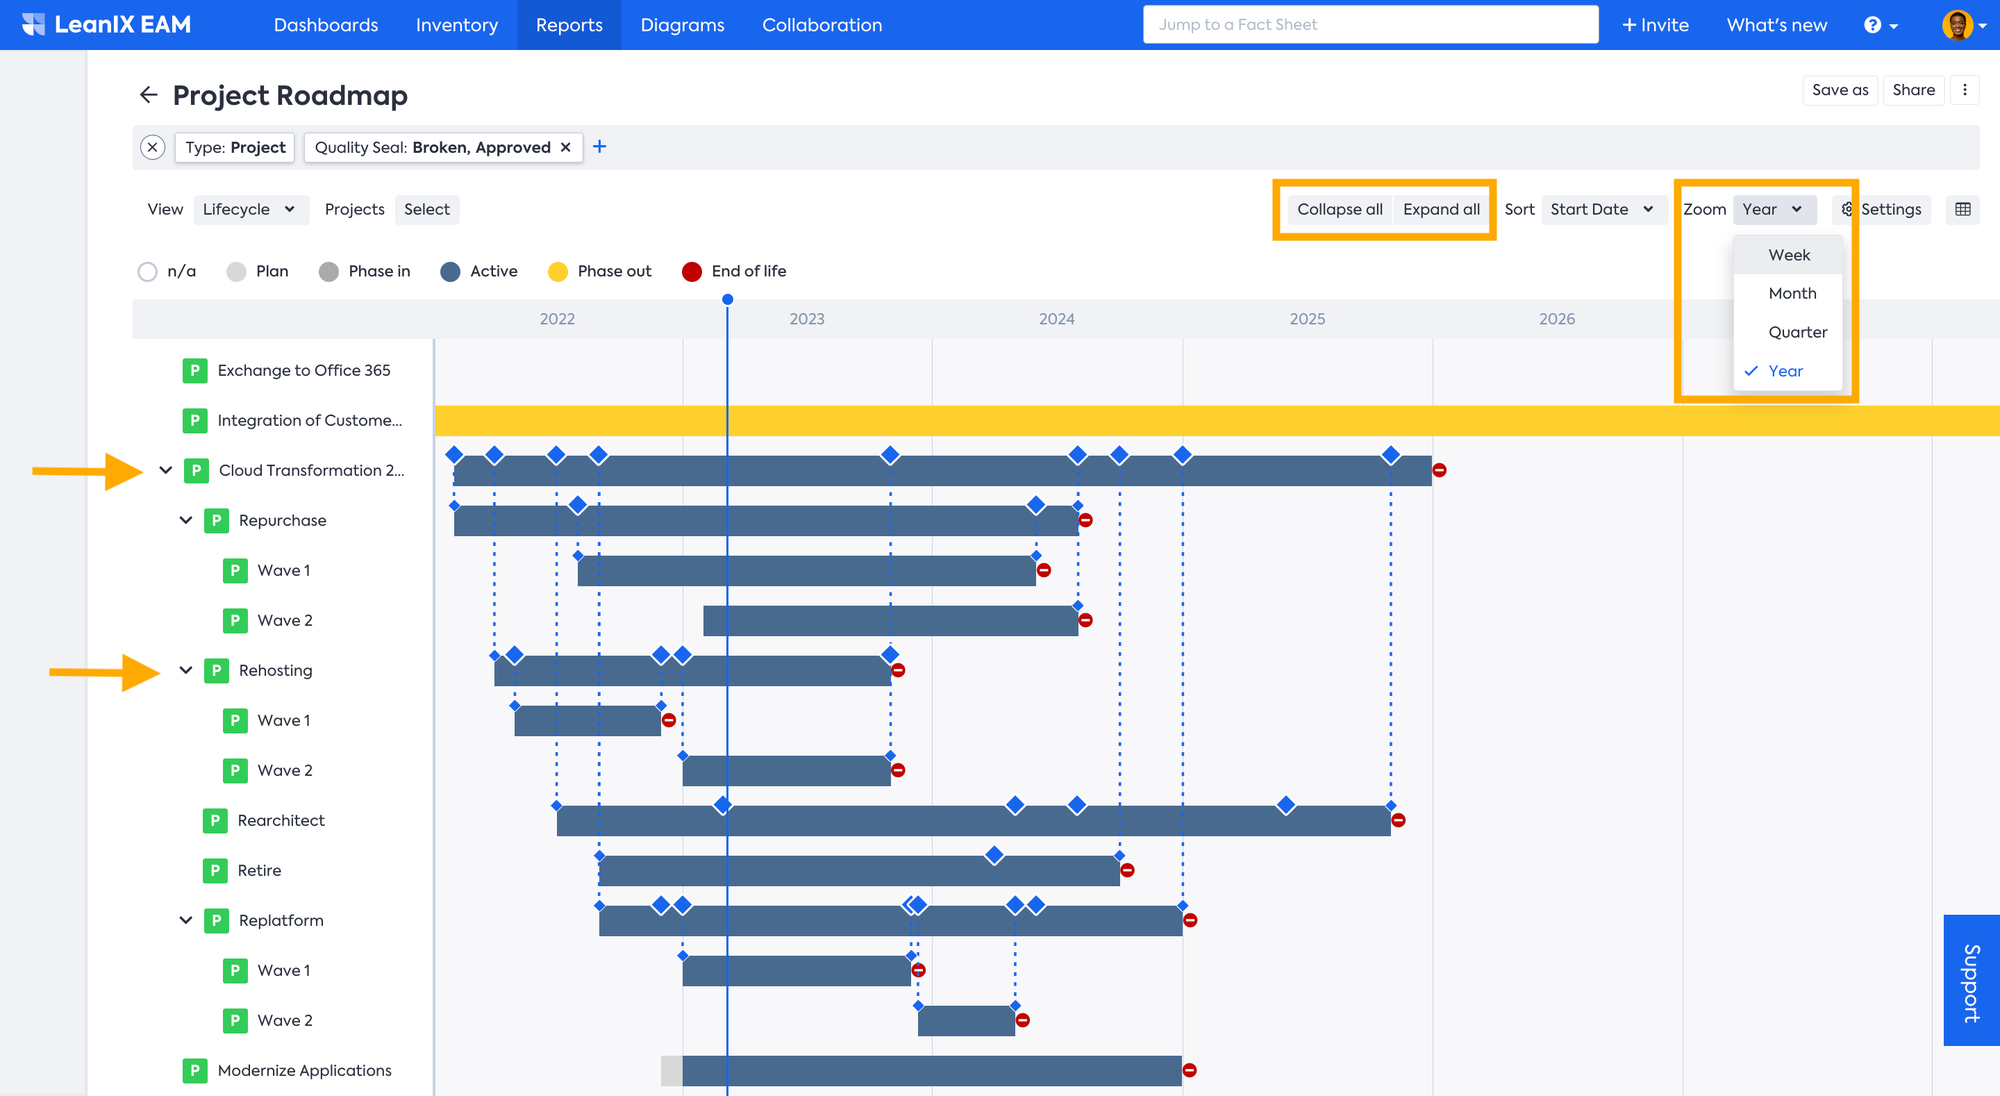
Roadmap Report is configurable and can be set to any of the Fact Sheet types present in the workspace data model. A Project Roadmap Report, for instance, helps you keep track of your initiatives and projects. You can update it regularly to see progress and find new opportunities to improve your IT.
You can look at it in different ways - for example, in a Project Roadmap Report, you can get an overall picture or pay attention to particular details by switching between the Expanded and Collapsed views. In case you want to collapse or expand specific Projects, you can click on the toggle icon positioned on the left of the respective project. Furthermore, you can select the Zoom drop-down menu to adjust the timeframe and observe progress over various periods such as weeks, months, quarters, or years.
Additionally, you can customize the duration of the timeline and track advancement across different time span to meet your specific requirements by entering the start and end dates in the Report Settings.
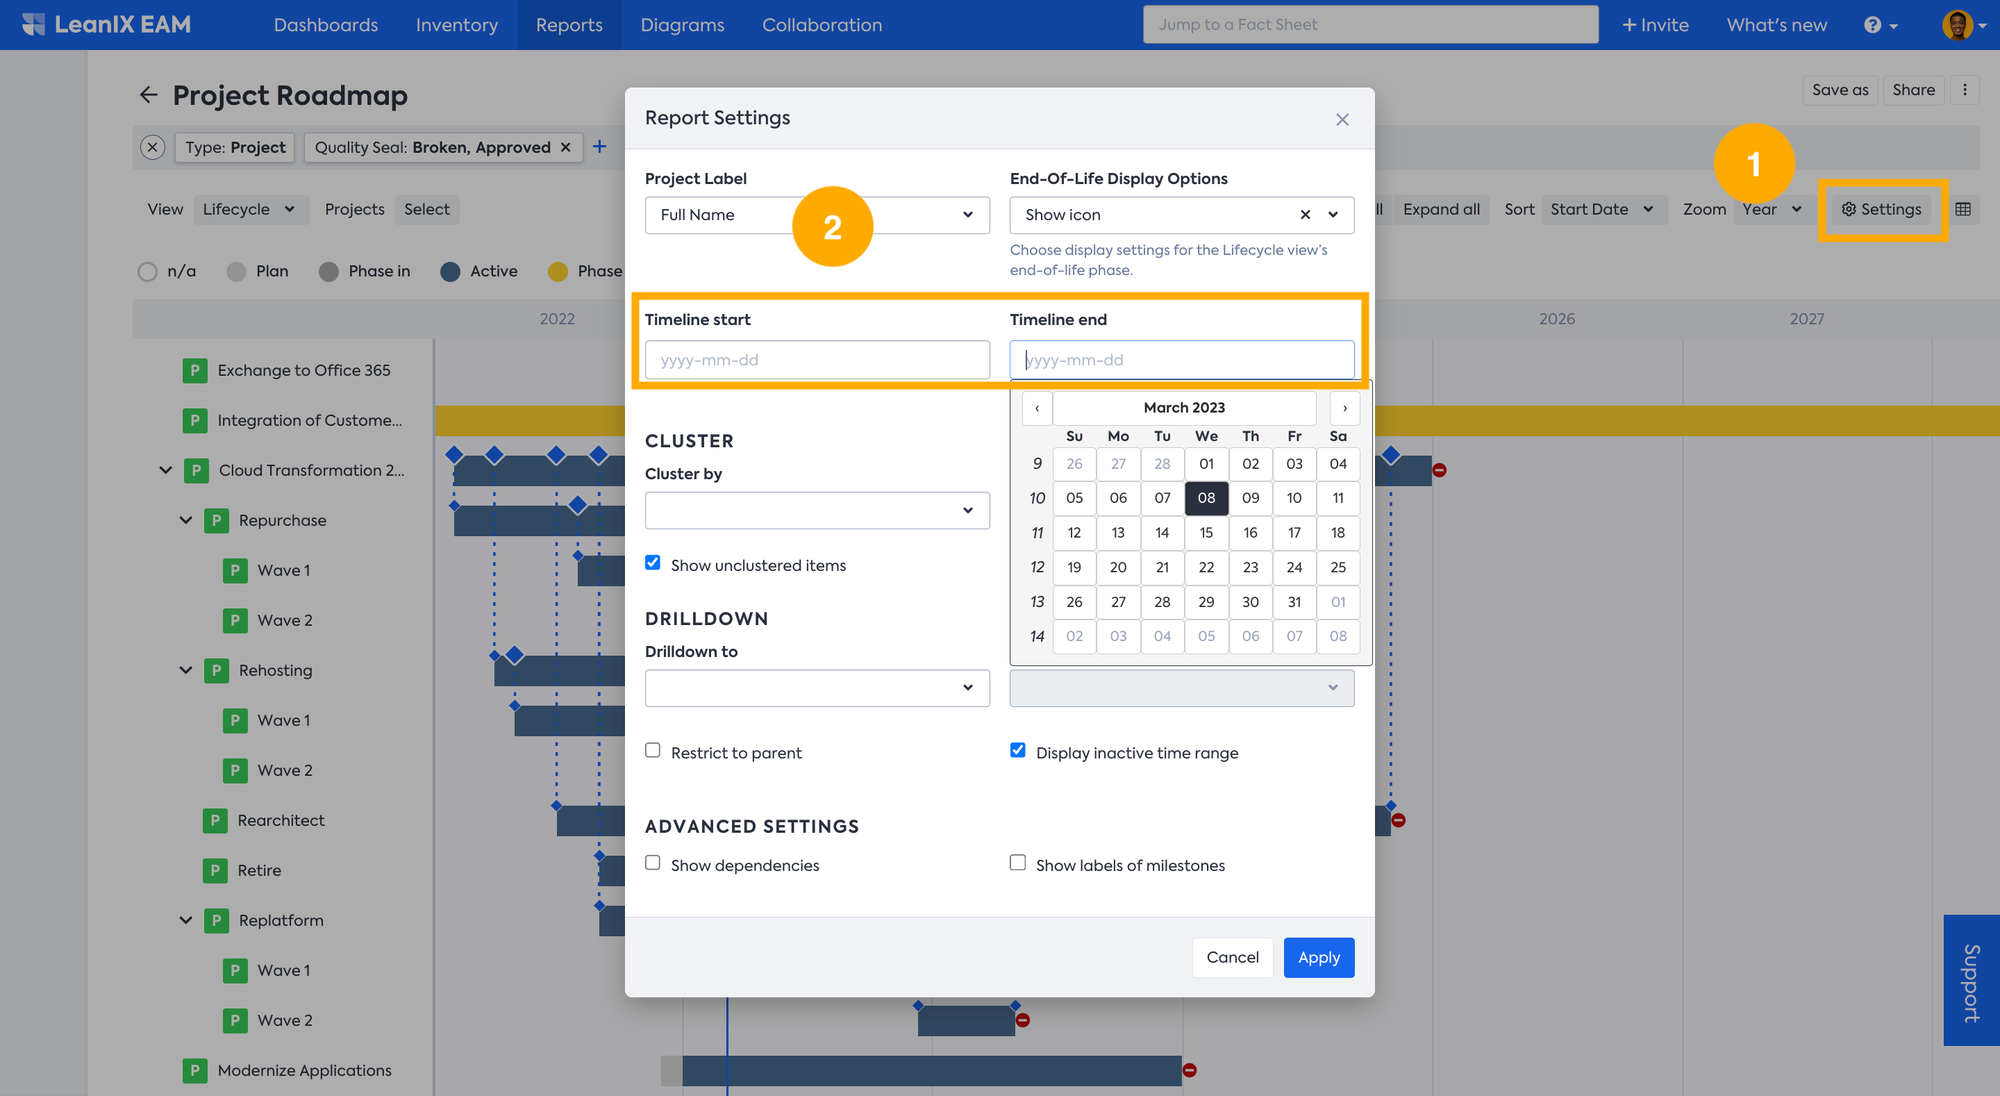
From the same Report Settings, to better organize your roadmap, you can choose to cluster items in the roadmap by Relations (e.g., Applications, Providers, etc.), Fields (e.g., Technical Fit, etc.), or even tags.
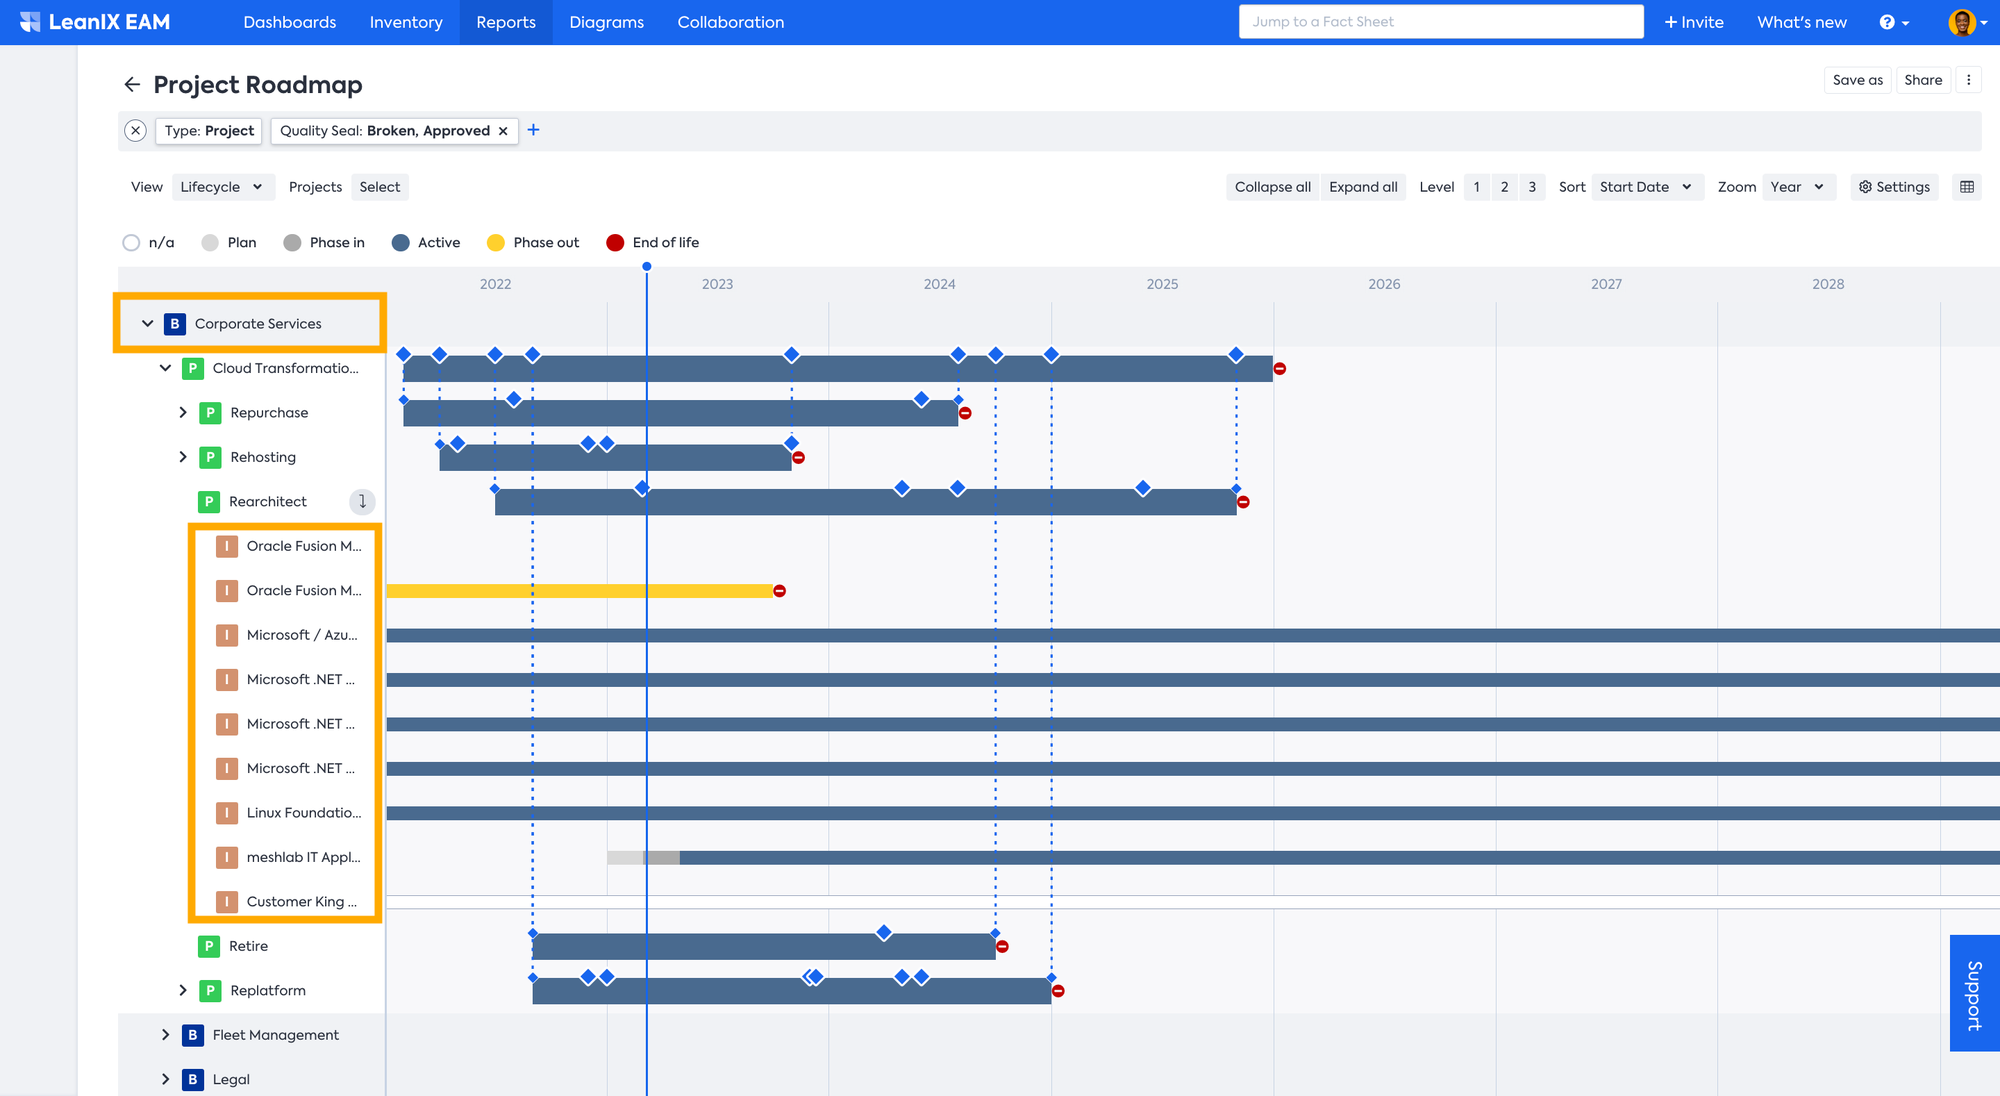
Similarly, you can enable drill-downs for your timeline items to expand Applications, Projects, or IT Components into their related Fact Sheets (e.g., drill down from Applications to see their underlying IT Components). Here in the below example, you can see the projects clustered by Business capabilities and drilled down to the IT Components level.
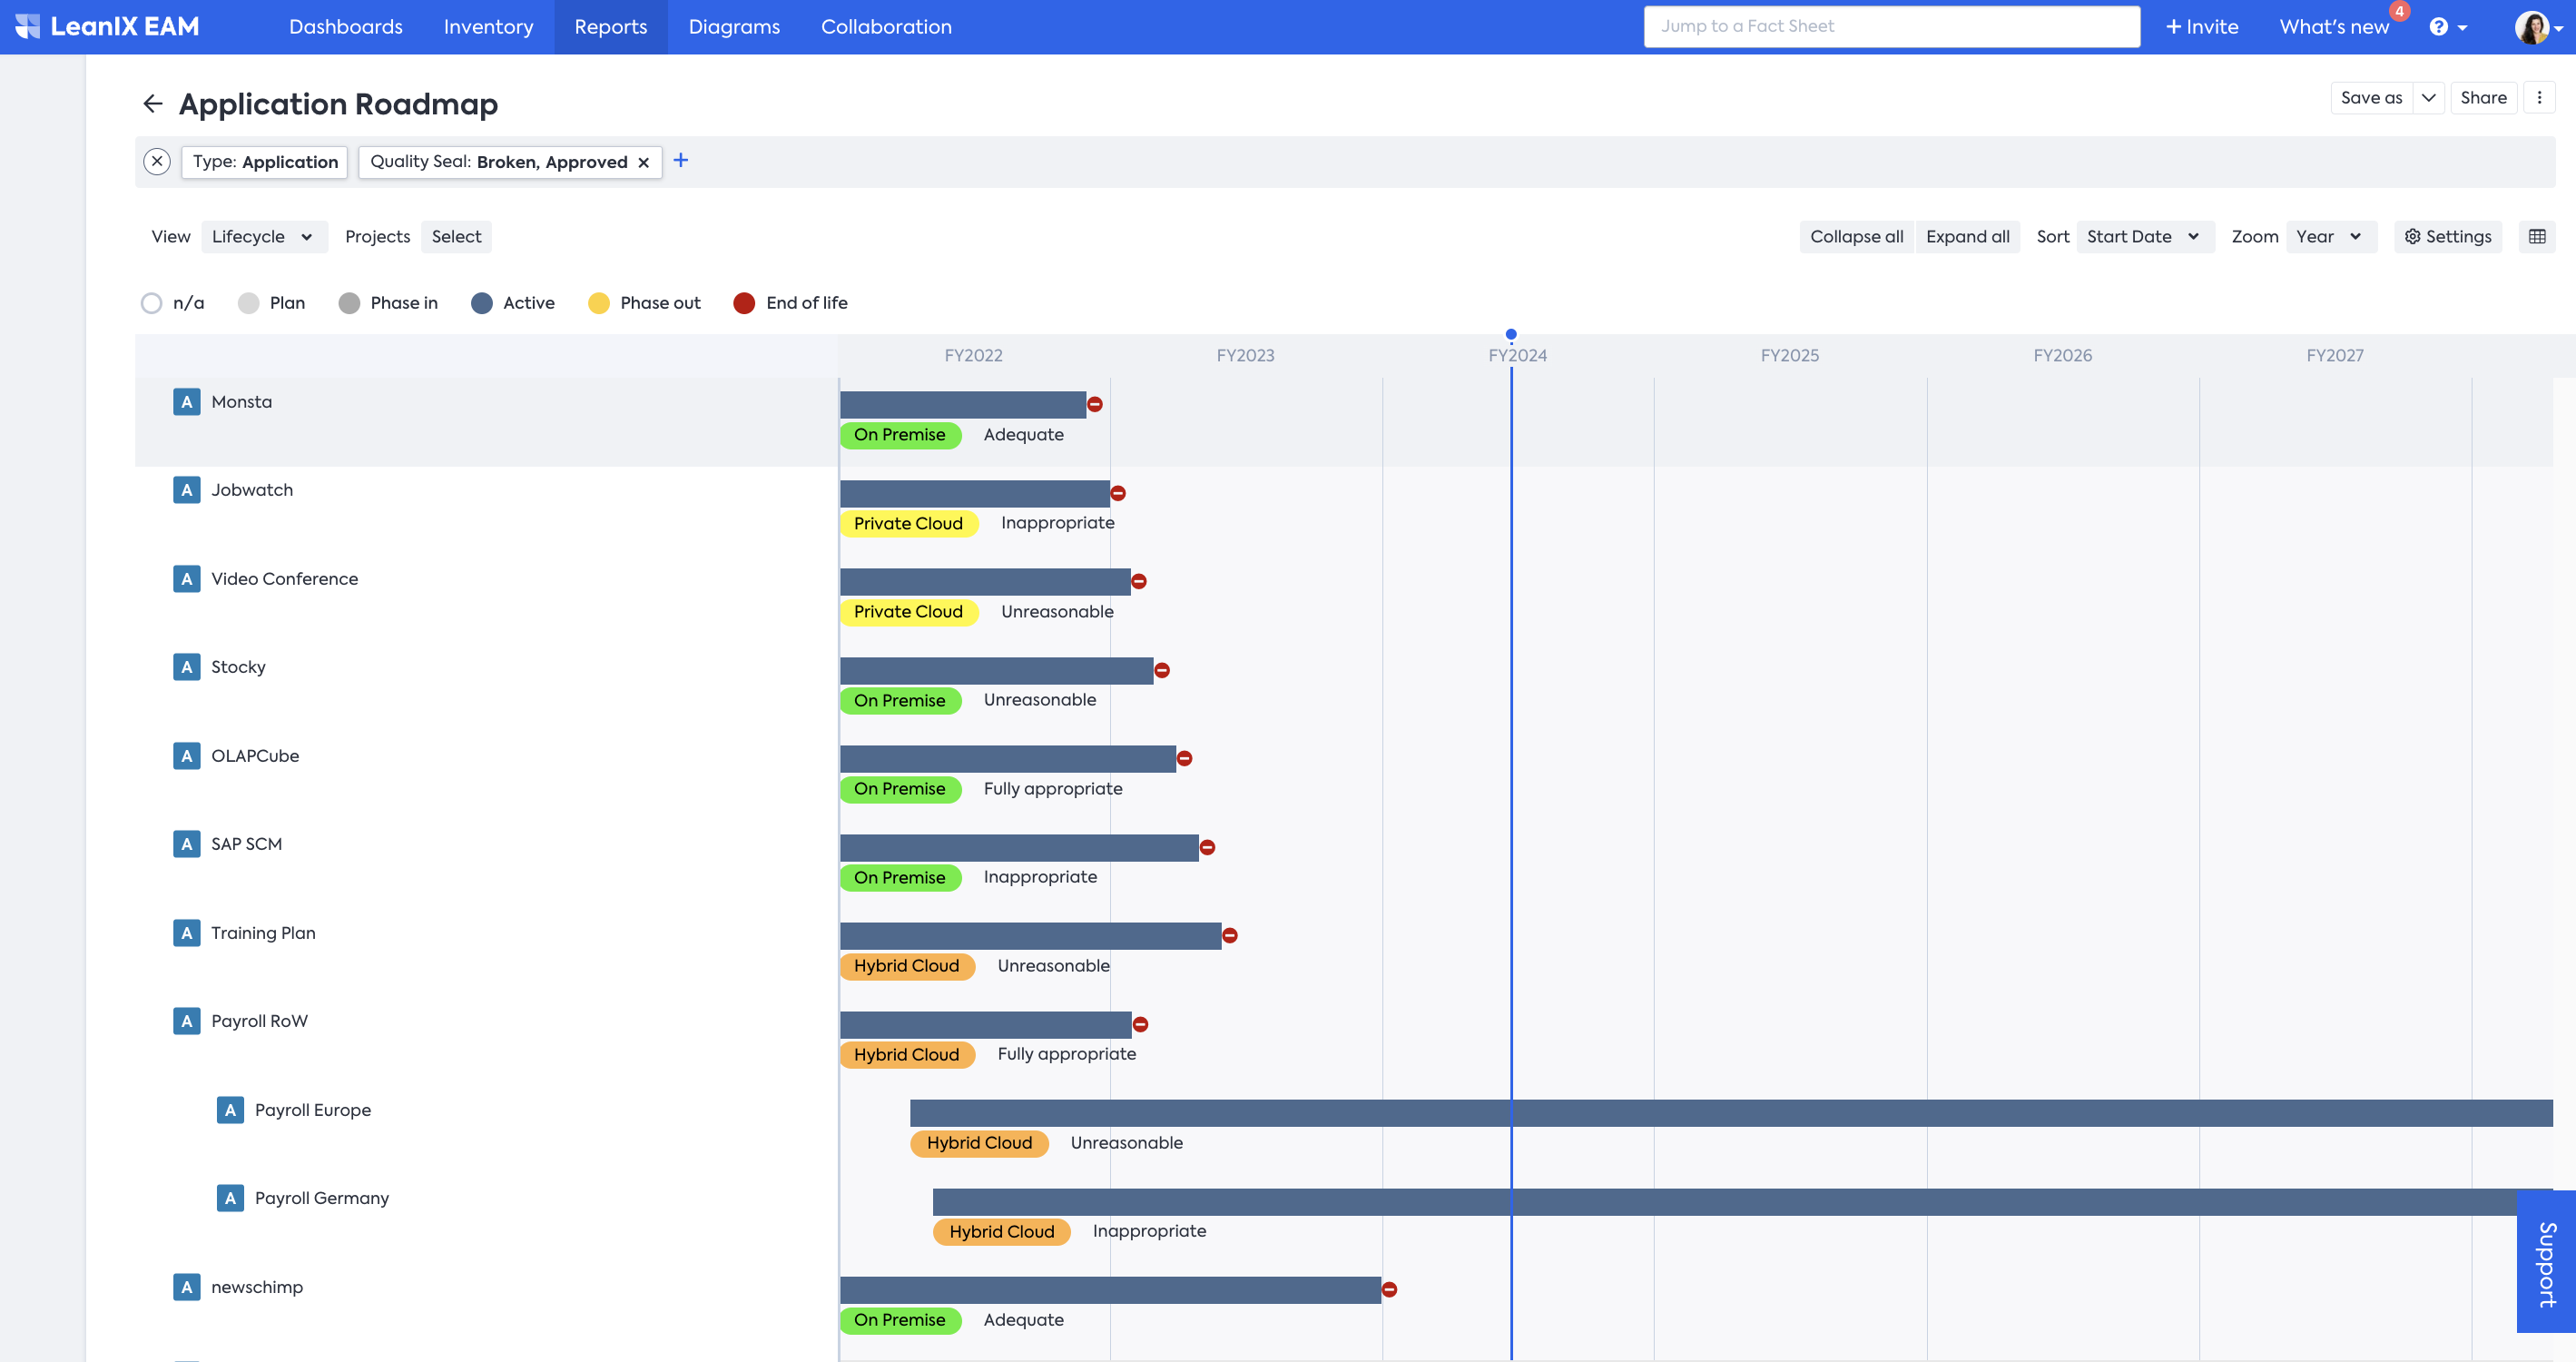
More relevant data from Fact Sheets, such as Tags, Subscription Roles, and Fields, can be added to Roadmap reports to improve decision-making and status reporting. The data to be shown can be chosen on the fly in the report settings. It lets you create multiple perspectives to understand better the situation and how it will change in the future. You can tidy up the report by hiding Fact Sheets that are not within the report's timeline. By checking the box to enable this feature, any Fact Sheets without a lifecycle falling within the visible or specified timeframe will be hidden.
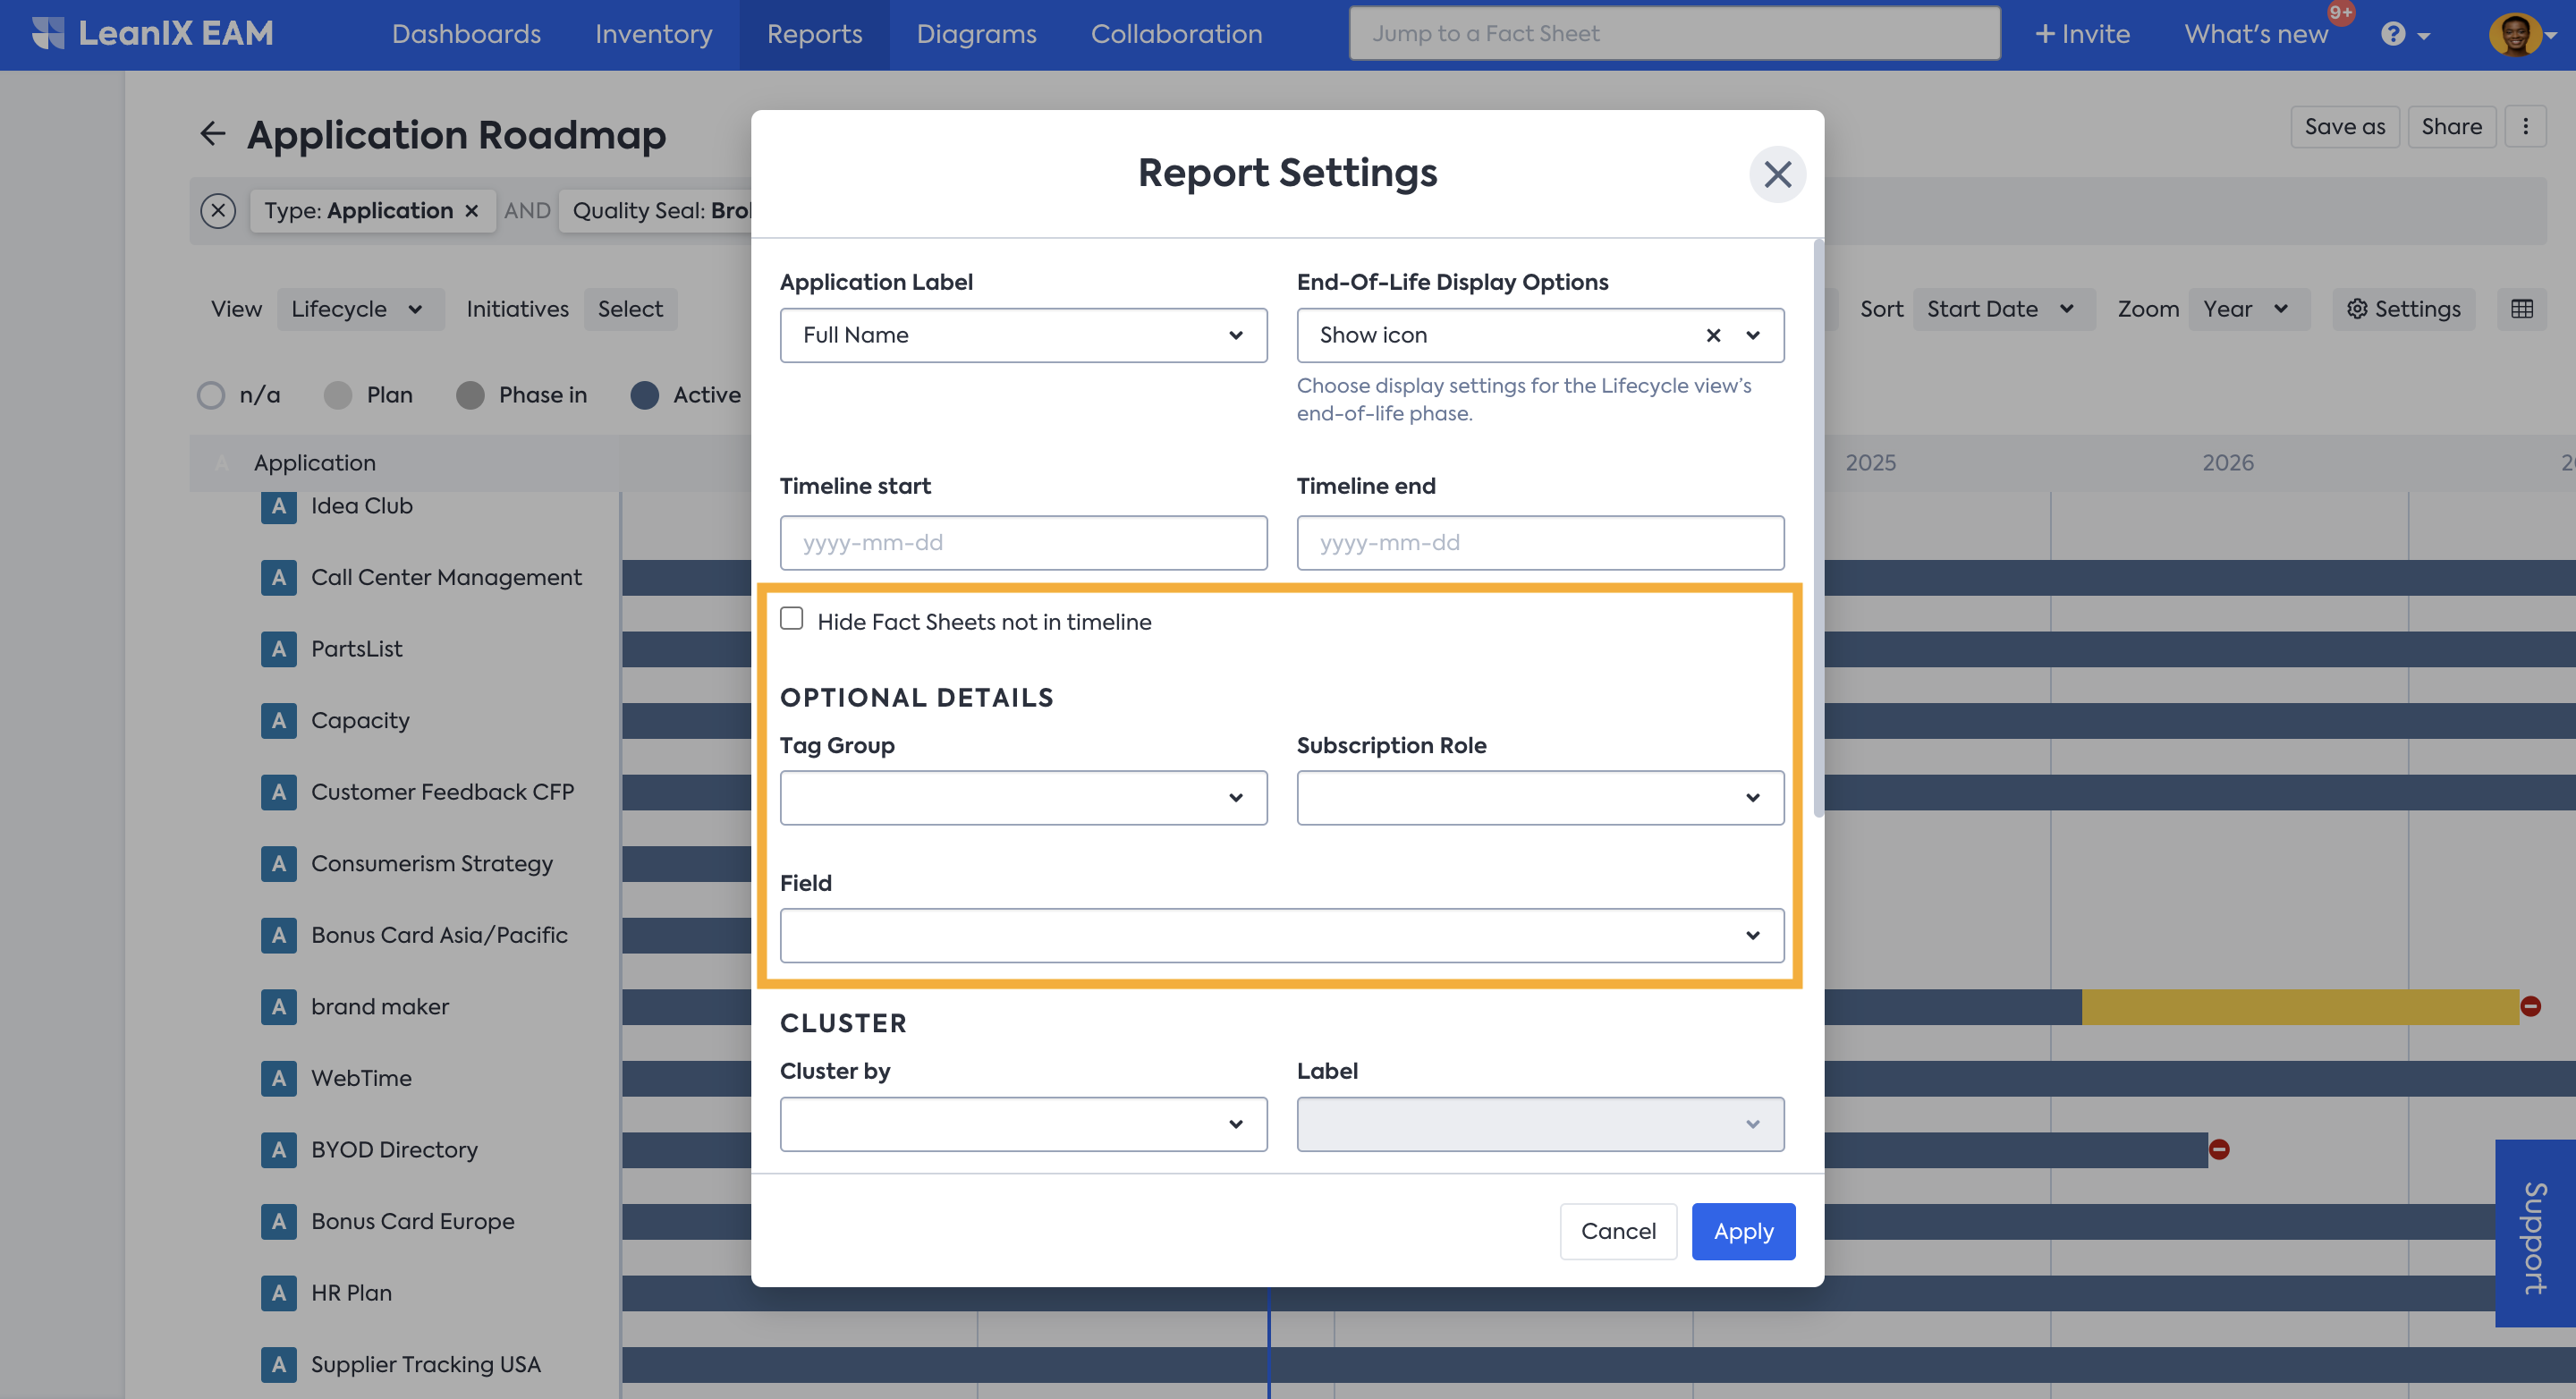
Displaying Additional Data!
The new update in the Roadmap report now allows the users to display additional data which helps enrich the context, increases collaboration and interactivity of the report. Find more information in the section below.
Bringing these extra details to the Roadmap Report, for example, can help answer questions such as: Who's responsible for the migration of a particular Application, which is currently hosted on-premise, has an insufficient functional fit, and will reach the end-of-life in a few months? etc.
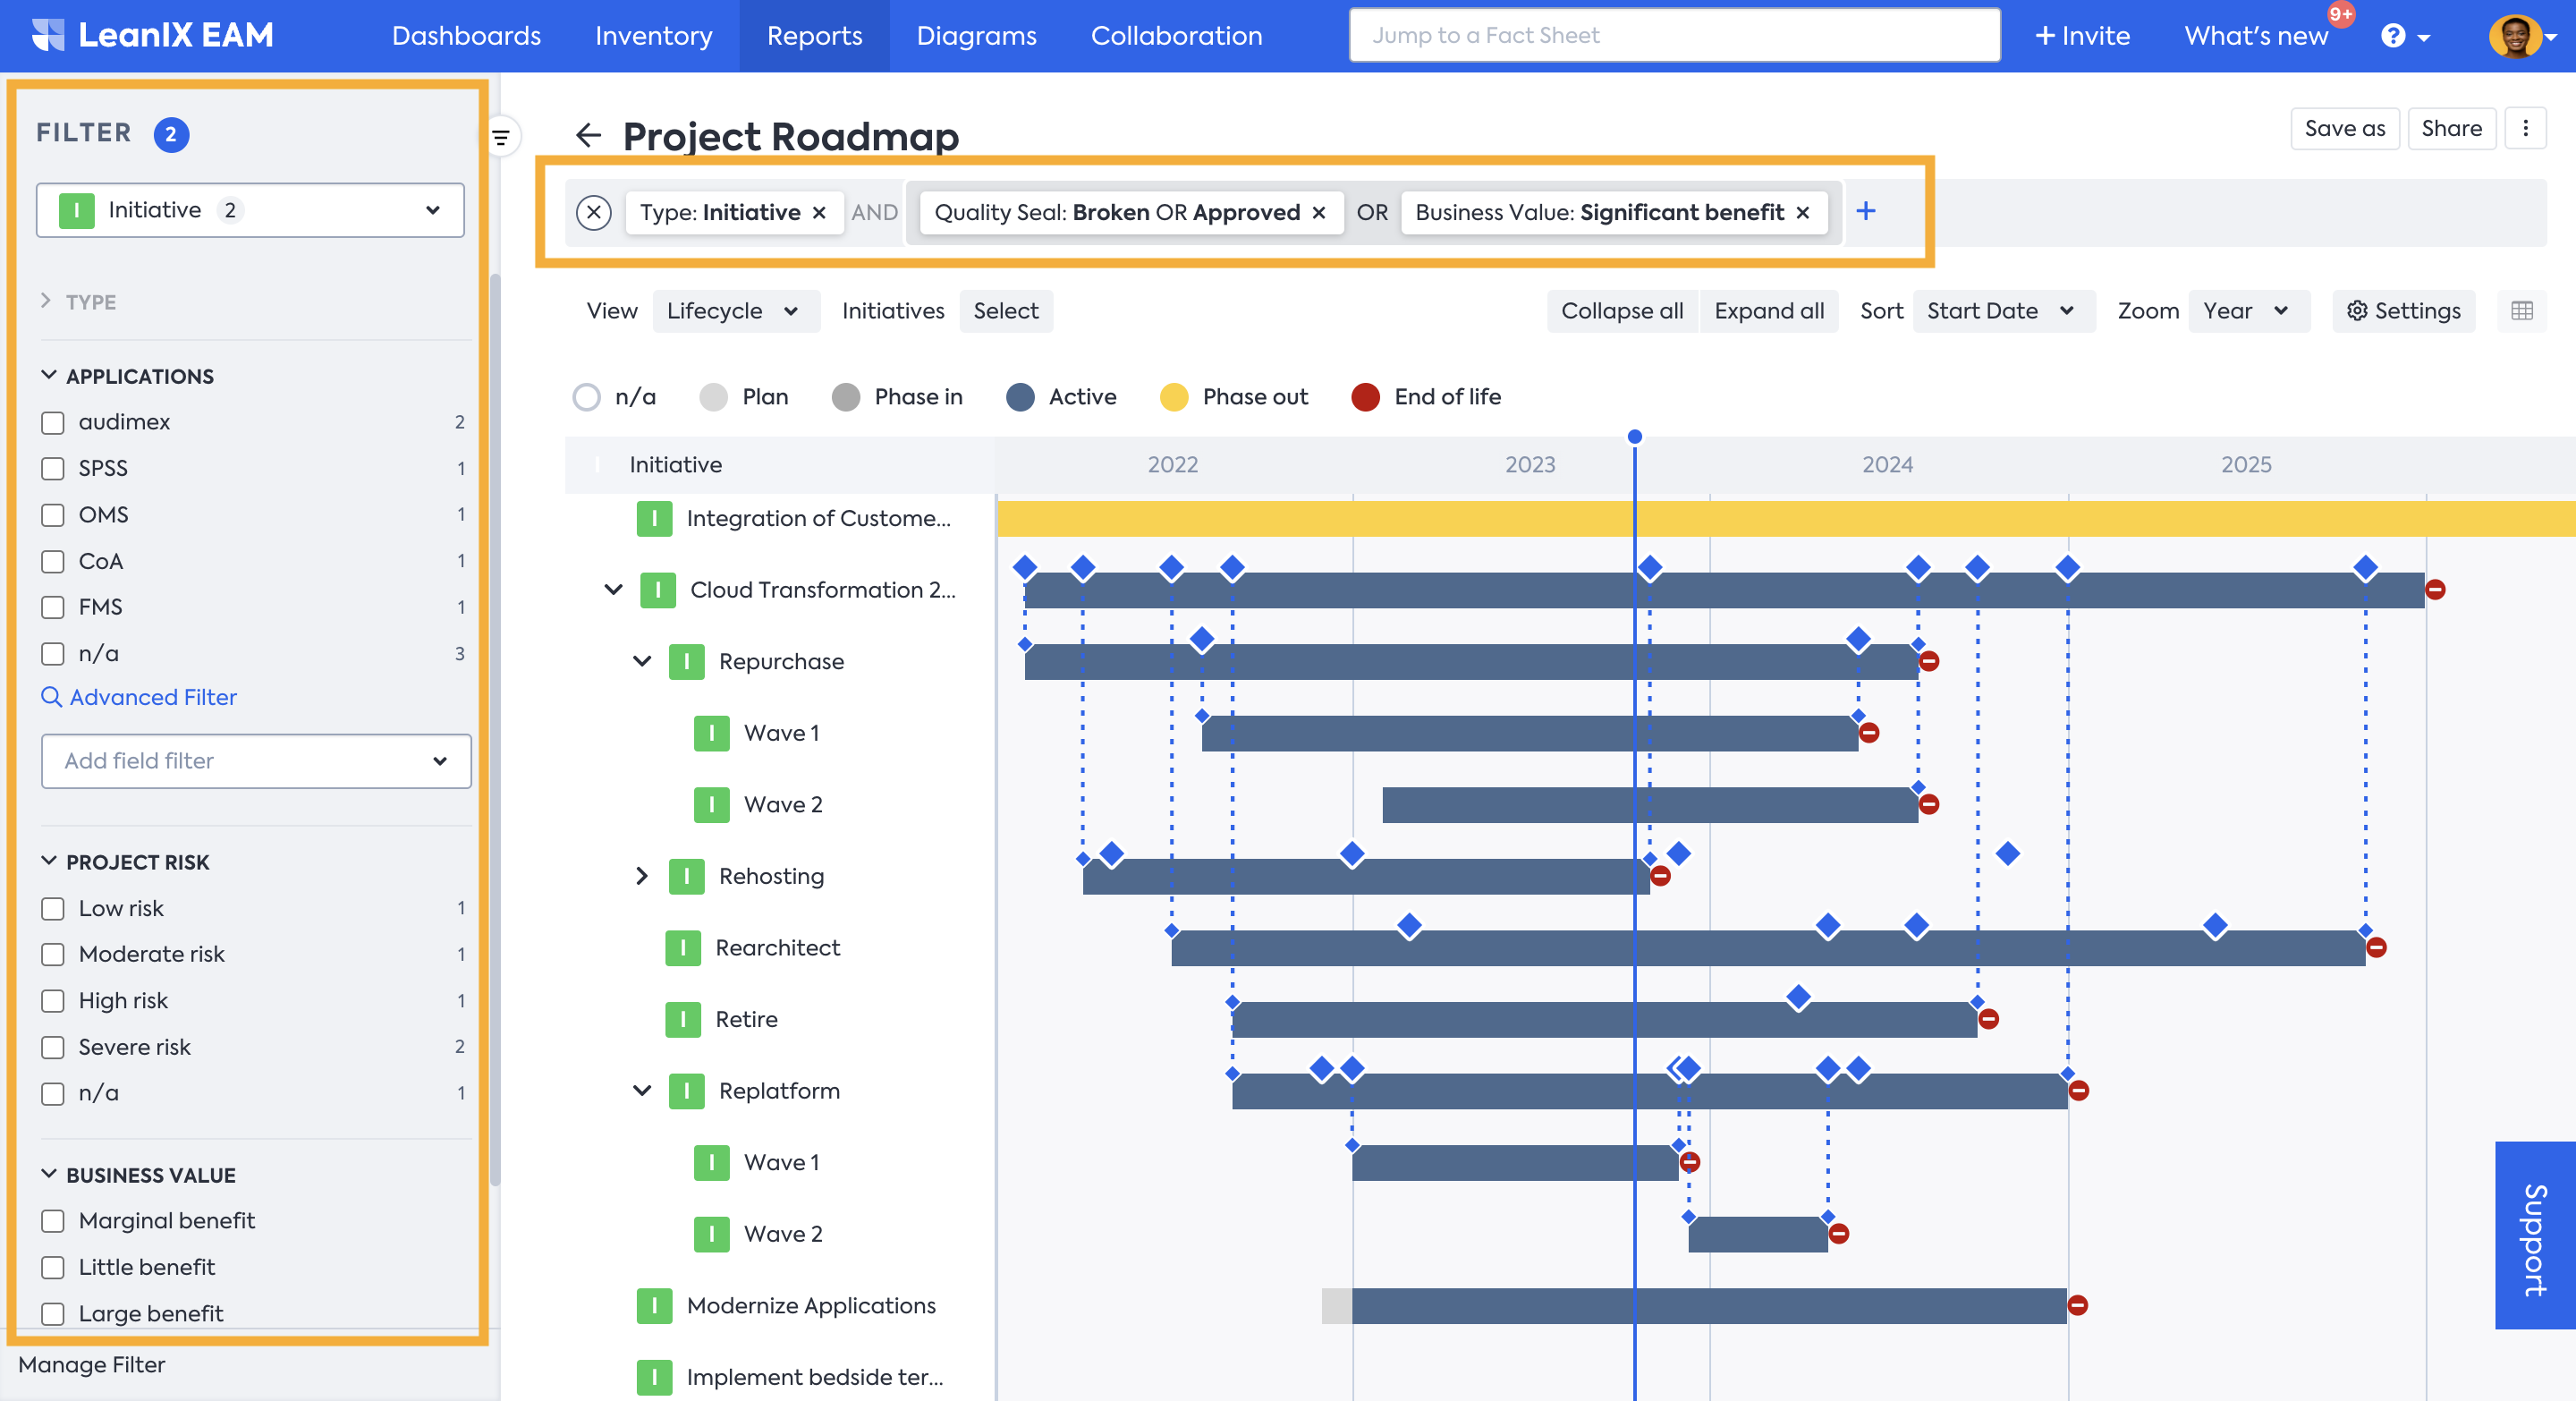
Applying Filter
The Roadmap Report allows users to filter data based on specific criteria, such as Business Capability, Technology Component, or Application. This can help users create customized views of their IT roadmap that are tailored to their needs. To apply the filter you can use both the Filter bar on top or Filter facets on the left-hand side which becomes visible when you move the mouse pointer to the left side of the window. To learn more about applying Filters refer to How to use SAP LeanIX Reports | How to use Filter & Views to create your individual report.
OR Operator Support in the Roadmap Report!
Roadmap Report now supports 'OR' operator filtering! In the past it was only possible to combine filters with an 'AND' operator. Users can now easily switch between 'AND' and 'OR' filters in the smart search bar. By combining multiple filters with 'OR' and 'AND' operators, users can refine their selection of Fact Sheets to suit their specific use cases. To learn more about using 'OR' opreator refer to OR Operator.
When the report is saved the applied filters also remains.
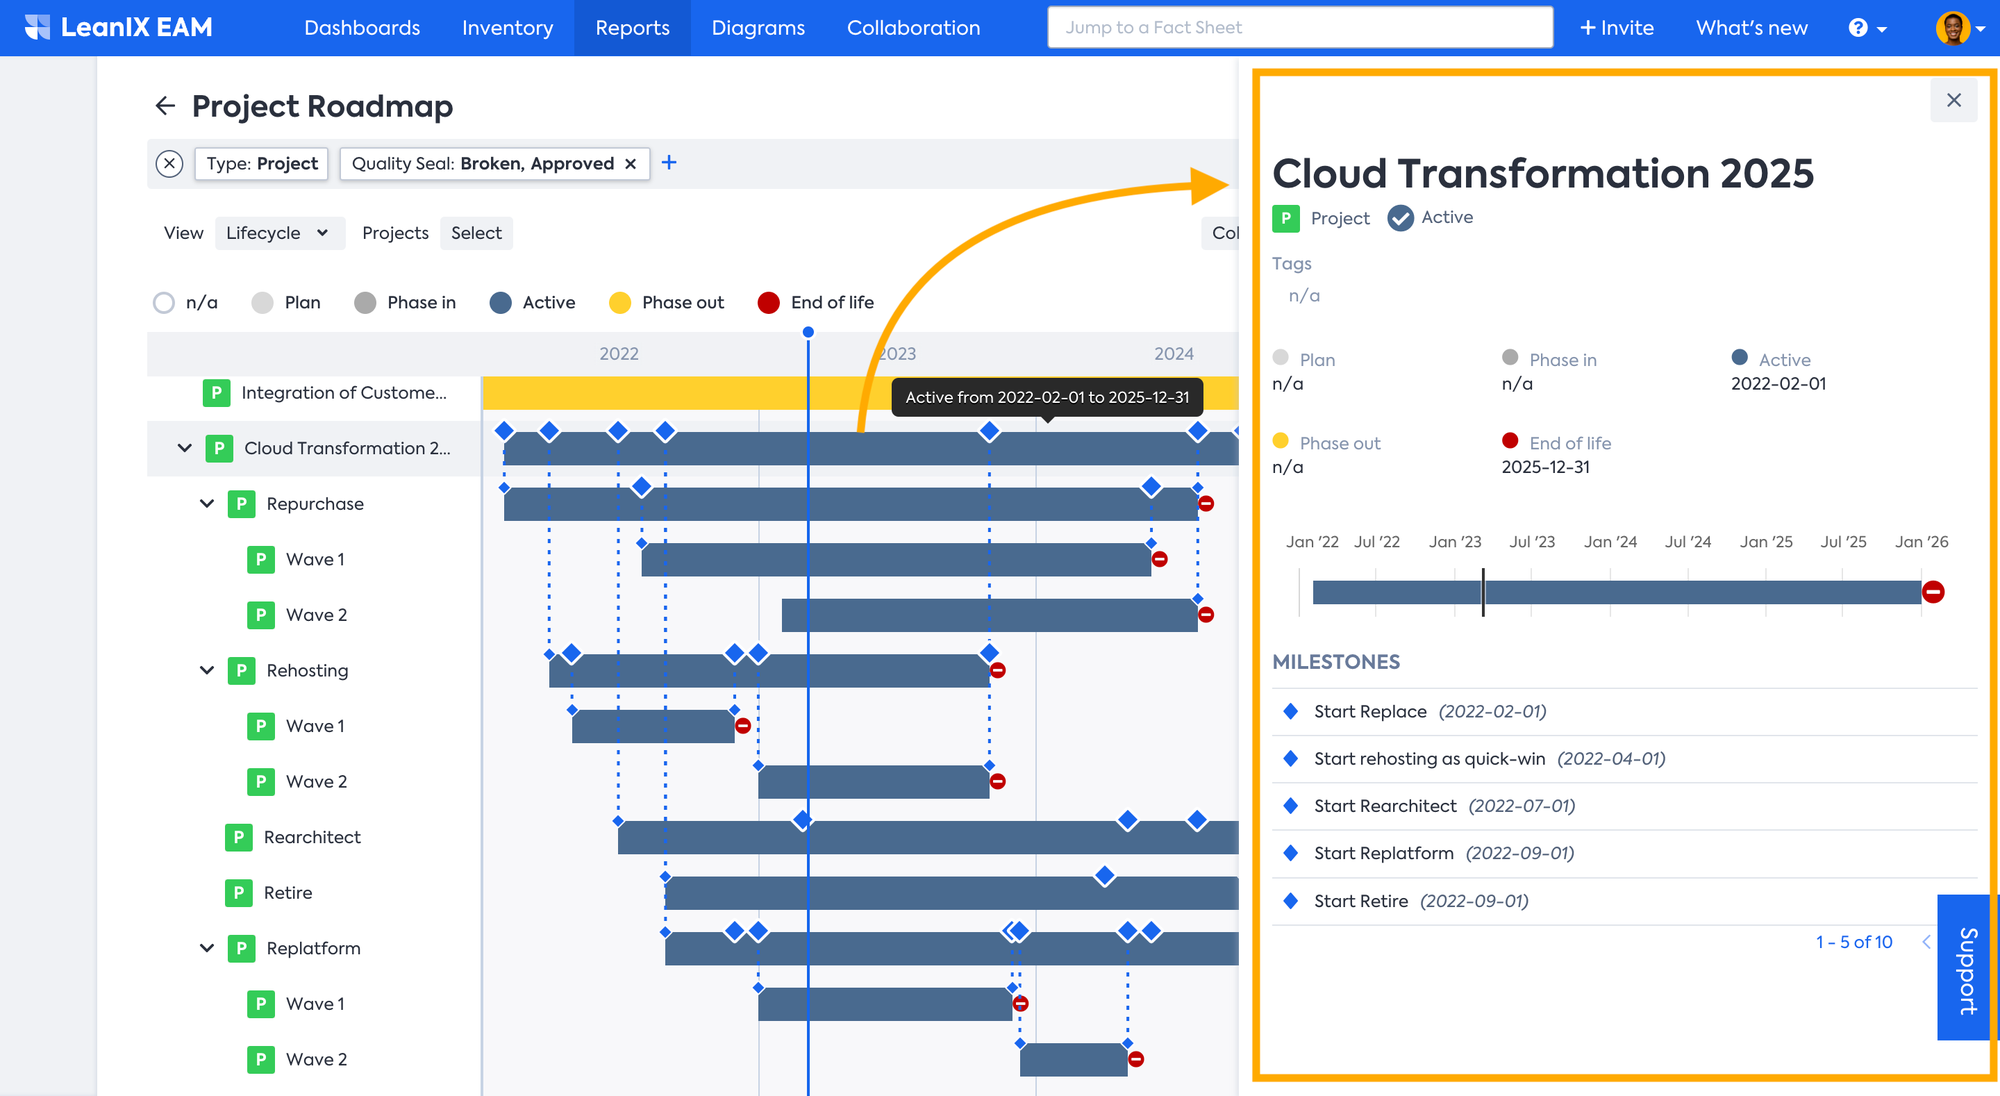
Editing in the Report
Each of the items in the timeline can be interacted with via the Edit Pane which allows you to directly change some Fact Sheet field values without leaving the report. In order to access the edit pane in a Landscape report, select any of the Fact Sheets, that is click on the one that requires modification. A pane will appear on the right-hand side, displaying information about the Fact Sheet and offering the ability to edit its properties. You will also find details of Milestones in the edit pane. Any adjustments made are immediately implemented within both the report and the Fact Sheet itself. Alternatively, you can navigate to the source Fact Sheet by clicking on the Fact Sheet name in the edit pane.
The Roadmap Report allows users to analyze dependencies between different initiatives or projects. This can help organizations identify potential risks and make informed decisions about their IT investments.
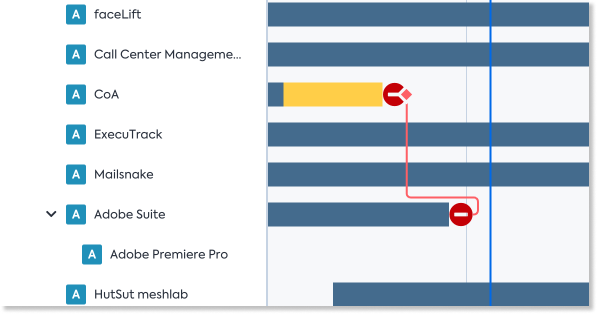
You can show dependencies between Fact Sheets. This relies on the data you have in the Requires and Required by fields in the Fact Sheet. To show these two fields, you can enable the Dependencies section in your Fact Sheet, you can see the detail in Meta Model Configuration. Once you have the relations between Fact Sheets, you can see this graph showing the dependencies, for example between these two Application Fact Sheets.
Clustering in Roadmap Report
By clustering various Fact Sheets in the Roadmap report, you can gain insights from different angles and contexts, enabling you to understand the data more comprehensively. Inspired by the design of the Matrix Report, you can cluster and navigate more intuitively, enhancing your overall user experience.
We have enhanced the clustering functionality in the Roadmap Report. To make it easier to understand and use the data, we've aligned the clustering in the roadmap report with the style of the matrix report. This alignment will provide a clear view of how items on the Roadmap Report influence various levels of a clustered hierarchy at a quick glance.
When you are in the Roadmap report, you can go to Settings and see the Cluster section where you can cluster the Fact Sheets in your Roadmap report by the Relations, for example, Business Capabilities.
With the improved clustering capability, collapsing levels in the report have become more intuitive, providing you with clearer visualizations. This feature adds clarity to the report, allowing you to focus on the clusters that are most relevant to you.
Clear Overview of Successor
The successor view aims to help you to:
- Identify Successors Clearly: By displaying successors in a non-collapsible manner, they can be easily distinguished from drill-downs, allowing you to recognize which applications are successors quickly.
- Understand Succession Timelines: We create more space to enhance your understanding of when each successor is scheduled to occur, providing a clearer view of the timeline.
- Remove Duplicate Data: To facilitate a quicker comprehension of the data, we eliminate duplicates caused by successors being shown as drill-downs. The list of applications now only includes those with a start date within the timeframe, excluding any that are successors.
To enable the successor view, go to Settings and select the Successor View as shown below.
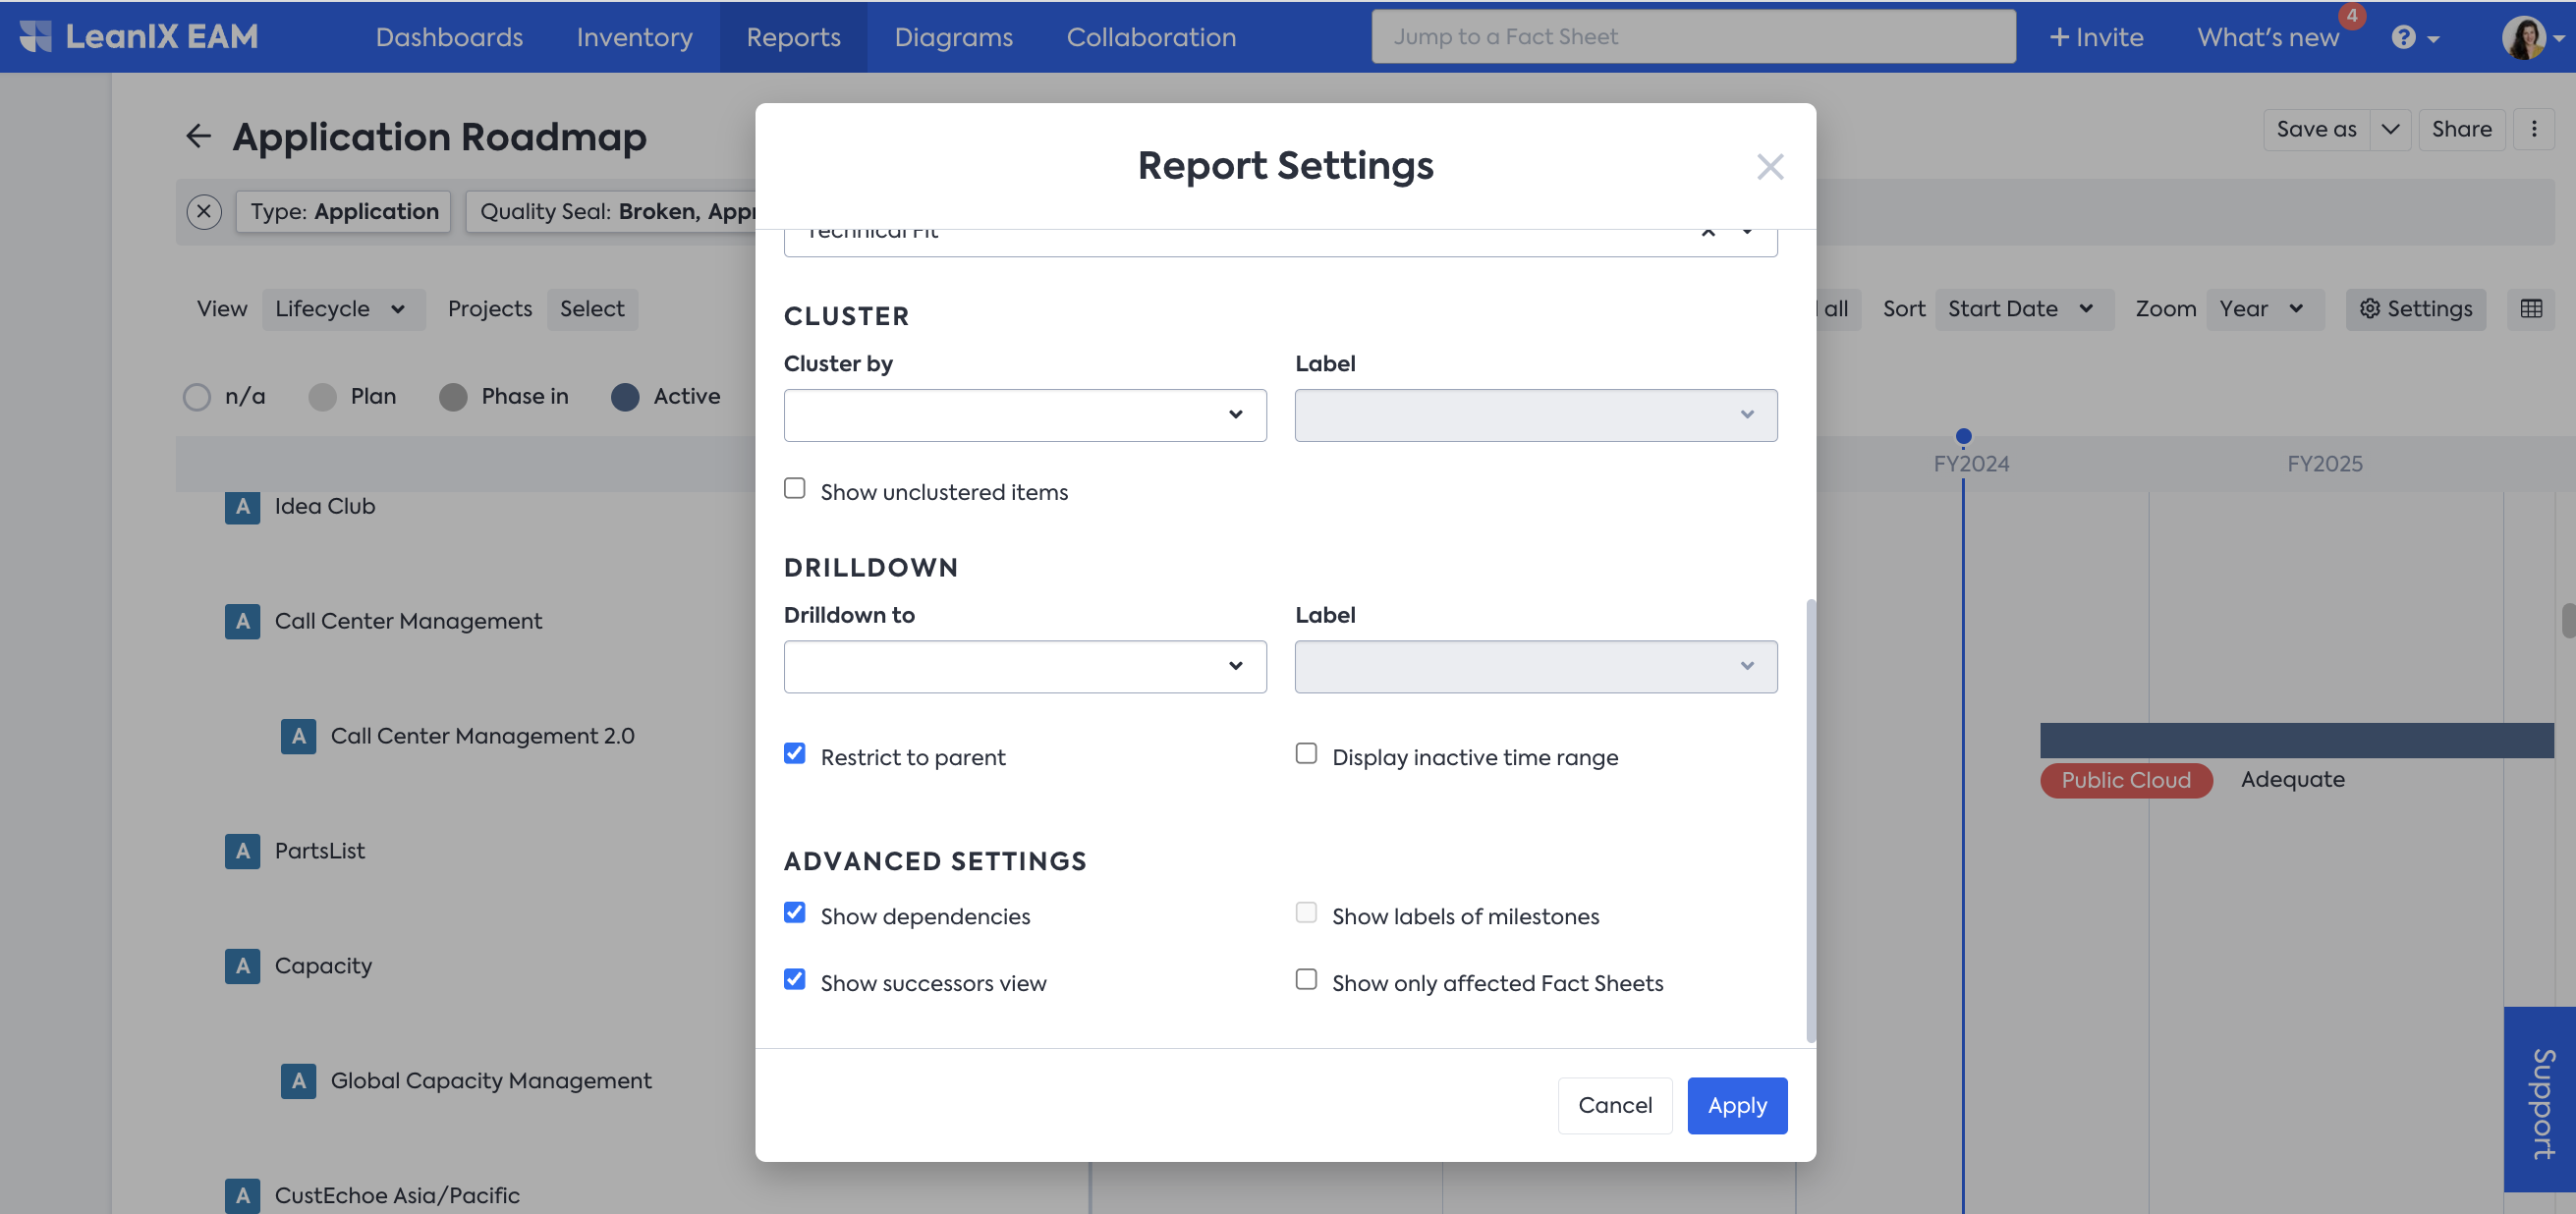
Once selected, the left-hand side of the Roadmap report will reflect the successor information where it exists.
Hide Applications Outside the Defined Timeline
Enterprises often deal with large volumes of data, and their application landscapes constantly evolve, with applications being deprecated, replaced, and introduced. As the number of Fact Sheets grows, it becomes increasingly challenging to gain a clear understanding of what's happening on a roadmap report.
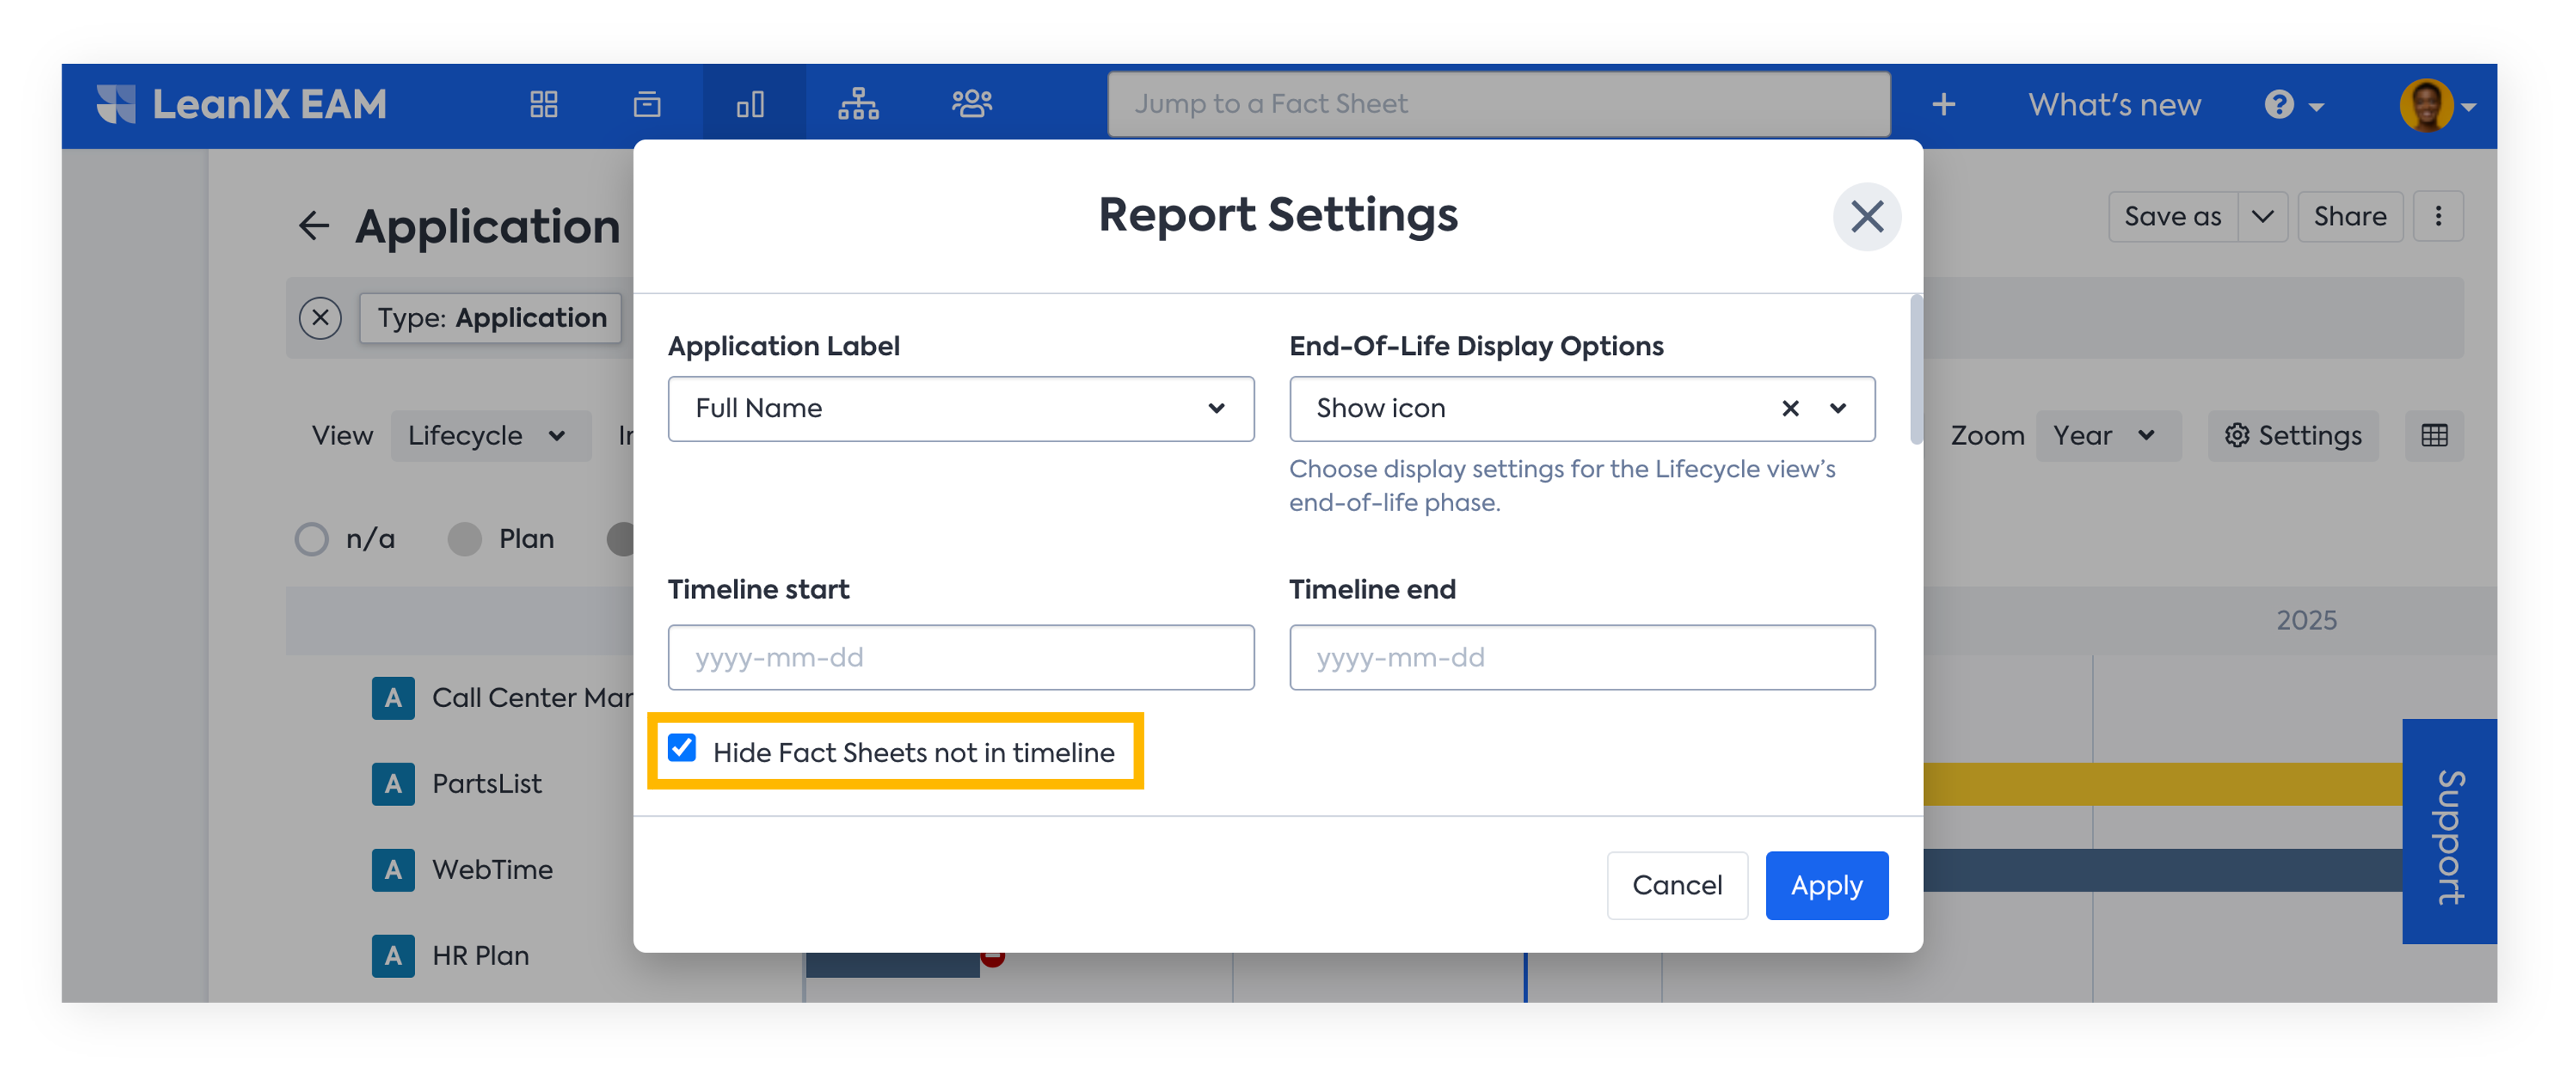
To address this challenge and enhance clarity, a toggle feature is available under the Settings section. This toggle lets you streamline your roadmap view by hiding Fact Sheets whose lifecycle falls outside the defined timeline.
You can enable or disable the Hide Fact Sheets not in timeline toggle in the Settings section of a Roadmap Report. Enabling the toggle hides Fact Sheets whose lifecycles do not intersect with the defined timeline, providing a more concise view of relevant information.
When enabled:
- Fact Sheets that are hidden due to the toggle setting are not lost.
- A new banner, similar to the one used in the Matrix Report, displays a list of hidden Fact Sheets for easy access.
Updated 22 days ago