
Phase 3. Explore: Define the To-Be Architecture
Detail the impact of the transformation on your landscape and refine the target architecture.
Overview
In previous phases, you were able to specify what will be affected. In this phase, you will leverage SAP LeanIX for the detailed planning of your organization’s target architecture by further specifying how your landscape will be affected by the transformation, leveraging more capabilities of SAP LeanIX Architecture and Road Map Planning. This involves determining when new applications will be introduced, when applications will be phased out, what technology will be replaced etc. With what you will identify gaps and necessary changes to meet the target architecture, explore transformation impacts, and prepare stakeholders for the overall rollout. To achieve this, you will need to use some additional SAP LeanIX features explained in this step.
In this step, you will unlock further features of the SAP LeanIX Architecture and Road Map Planning (Previously known as BTM module). The additional features (Transformations and Impacts) enable you to visualize your target (to-be) architecture, showing changes and impacts on a timeline. This sets the foundation to actually execute your transformation in the next phases. Learn here more about how to use Milestones, use Transformations and how Impacts are created in SAP LeanIX.
In this phase, do the following:
- Add Transformations and Impacts: Enrich your Inventory by adding Transformations and Impacts with the SAP LeanIX Architecture and Road Map Planning.
- Evaluate Data: Use enhanced reporting capabilities to visualize the future state, identify gaps from the current state, and establish a clear target architecture.
- Report and communicate: Build on the dashboard you created in the previous phase, and add relevant Reports and KPIs for overview and communication.
The following overview gives a "Definition of Done" and milestones that you should achieve in this phase.
| Milestones | KPIs/Reports |
| Detailed target architecture (represented by enriched Reporting views showing Transformations and Impacts based on one or more selected Initiatives). | 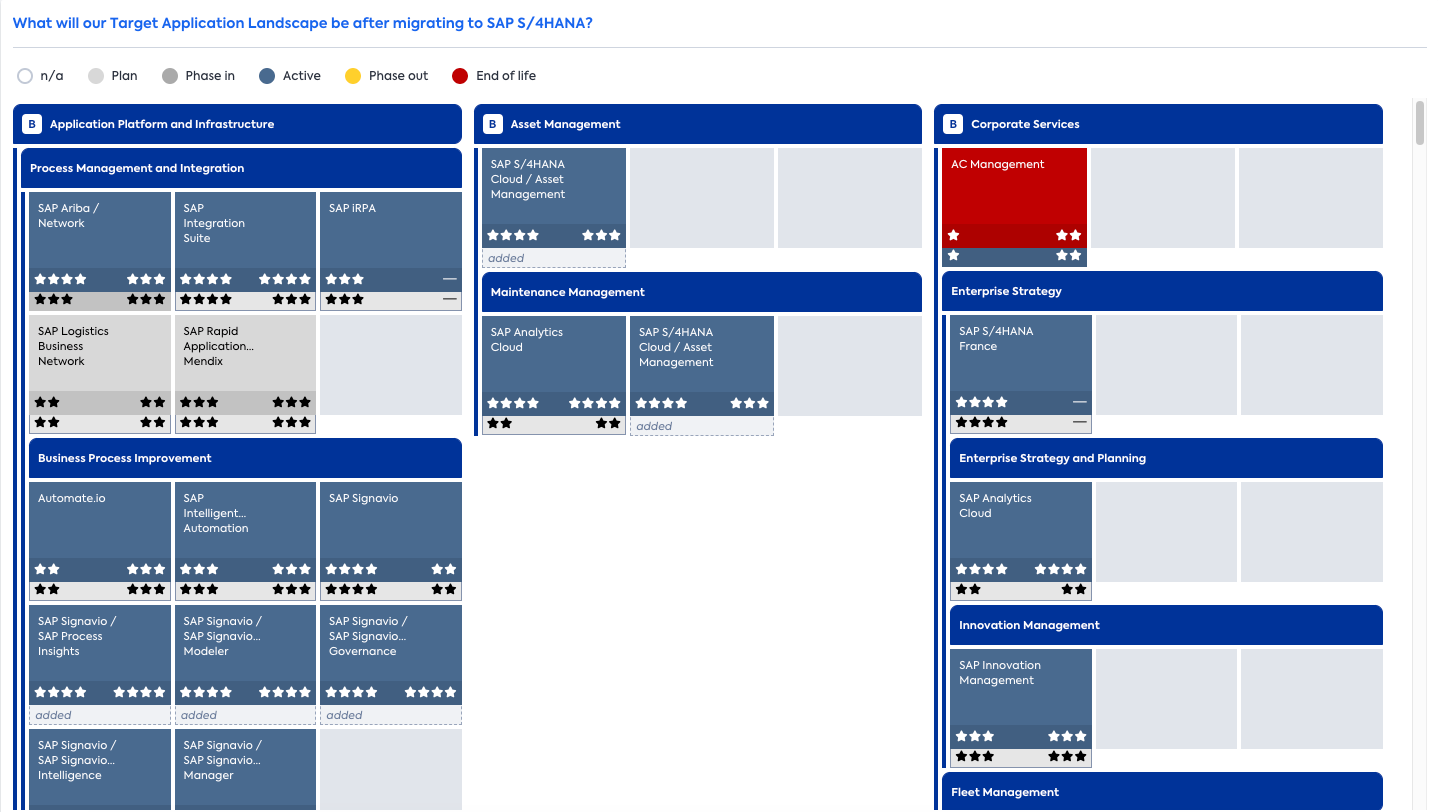 |
| Initial target architecture validated; planned Transformations and Impacts identified. | KPI to compare “set” transformations and “completed” transformations for those Projects in scope (view to be added by SAP LeanIX). |
| Detailed understanding of transformation scenarios. | Project roadmap from phase 2, now enhanced with blocked/blocked by (view to be added by SAP LeanIX). |
| Management buy-in for chosen transformation scenario (happens based on info in SAP LeanIX, but outside of the tool). | Reflected in Final Transformation Roadmap (decision can be documented on the 1st-Level Initiative Fact Sheet in the Comments tab). |
Step 1. Add Transformations and Impacts With Architecture and Road Map Planning
The way you plan and visualize your to-be architecture in SAP LeanIX is supported by the Architecture and Road Map Planning that you have already started to use in phase 2 (by adding Milestones).
By enriching your SAP LeanIX Inventory and adding two additional features, Transformations (accessible through a separate tab on the Initiative Fact Sheet) and Impacts (automatic classification by SAP LeanIX whenever you create a Transformation), you will be able to:
- Compare different transformation scenarios.
- Visualize future states of your application landscape through an enhanced Report view ( Explained in the next section).
- Create enhanced roadmaps and track the ERP transformation program, as well as keep tabs on changes in your enterprise architecture resulting from the transformation.
Find a detailed explanation of how to create transformations here: Transformations.
By adding Transformations and Impacts to your scenarios, you will be able to answer questions like:
- What happens if you stay to an SAP standard vs. if you use another system (e.g., introduce SAP SuccessFactors vs. Bamboo HR)? The PACE layering assessment you conducted in Phase 1 also helps you here, as you can track your decisions against the target maturity of your business capabilities.
- Stay clean core fit-to-standard or custom implementation -
- What would support the business better (Functional Fit from a business perspective)?
- Which decision would improve our business (on the Business Capability Maturity level)?
As all the to-be architecture data needs to be added manually, make sure to balance the level of detail vs. effort when creating Transformations and Impacts. Once you gain clarity and get stakeholder buy-in on certain Initiatives, you can go ahead and plan out Transformations in detail that you will execute in the later stages. You will learn about executing the Transformations in Phase 4. (Realize, Deploy & Run).
Step 2. Evaluate Data
This step aims to establish a target architecture (to-be), identify gaps between the current and future states, and enrich your Transformation Program with information that empowers the entire team to monitor progress and understand the changes in the IT landscape.
There are several ways to visualize the future state of your architecture/ Impacts of Transformations on your architecture through enhanced Report capabilities. To learn more about the reporting capabilities enabled by the SAP LeanIX Architecture and Road Map Planning, refer to Reports and Roadmaps. A few examples are shown below:
-
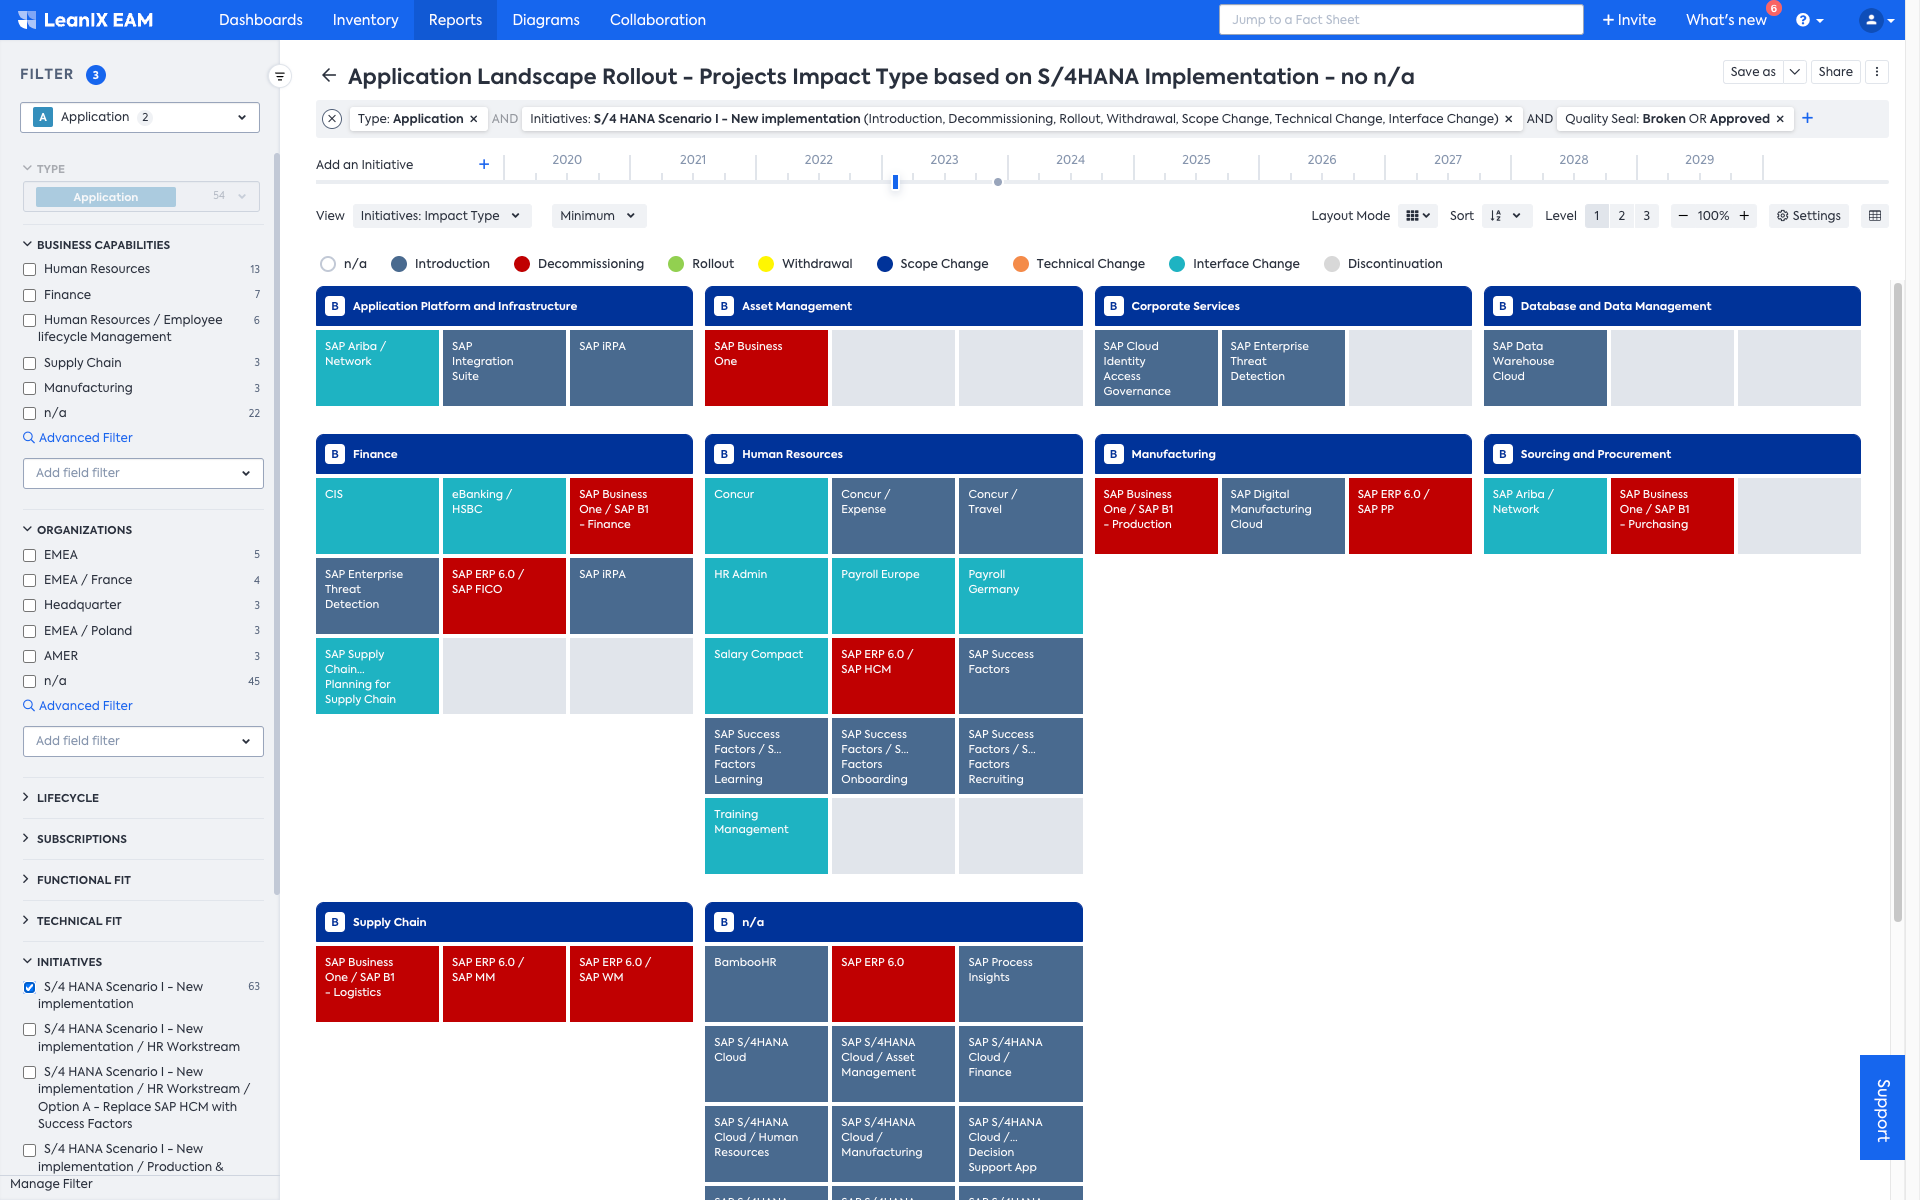
In this example, you can see an Application Landscape Report that reflects the Impacts of your Transformations on your application landscape:
Application Landscape Report reflecting the Impacts of your Transformations
-
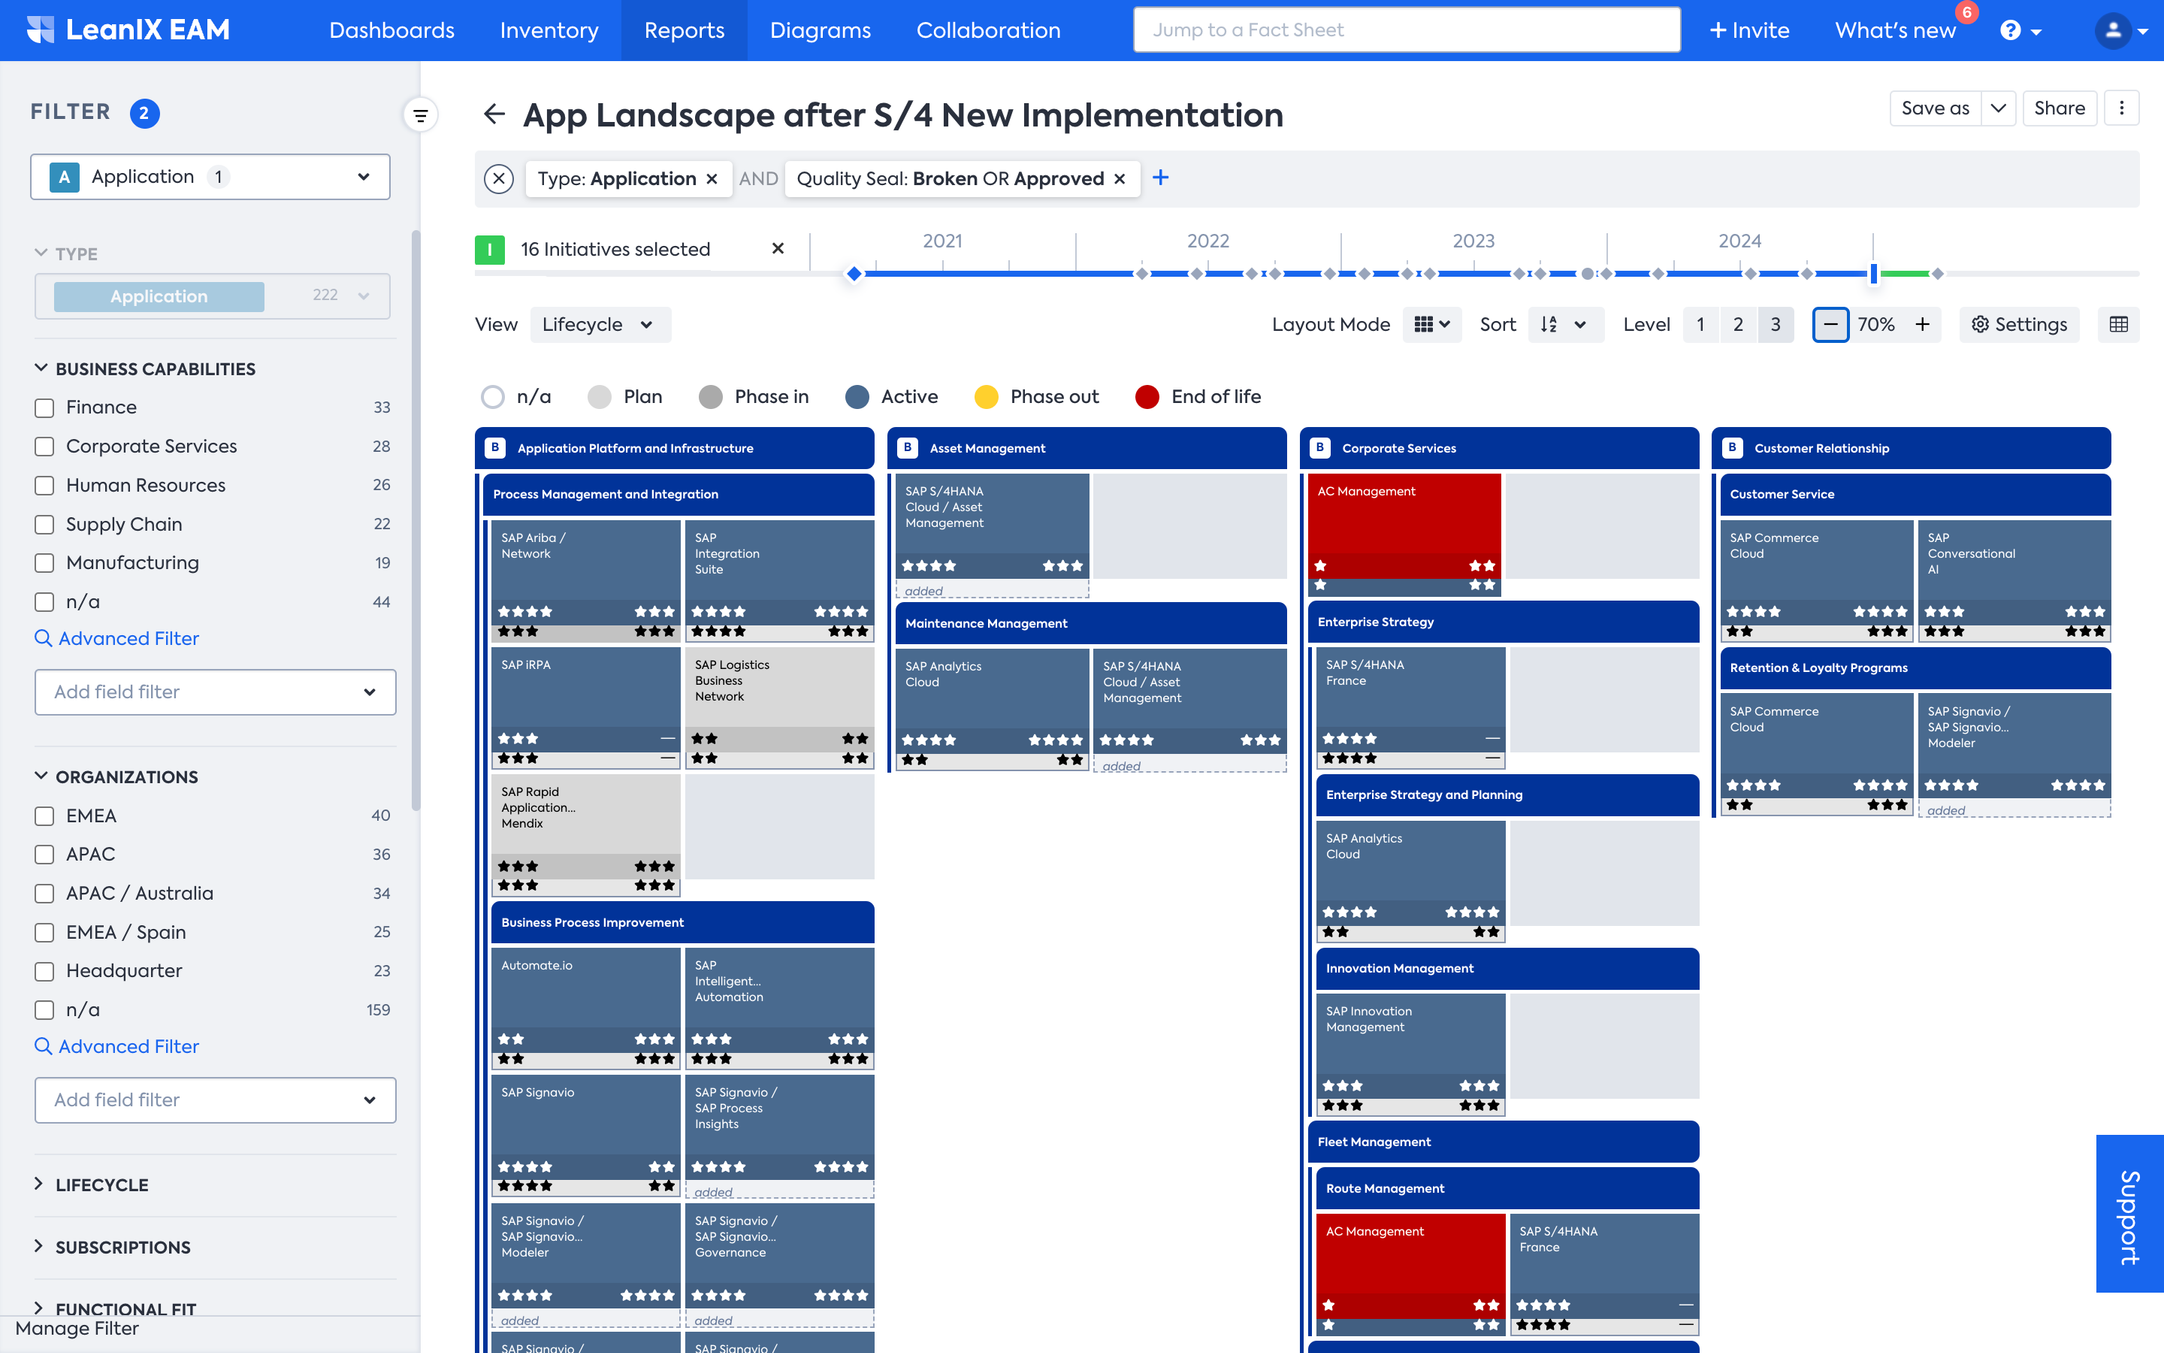
Application Landscape Reports showing how different scenarios are going to affect the IT architecture:
Example for Option A:
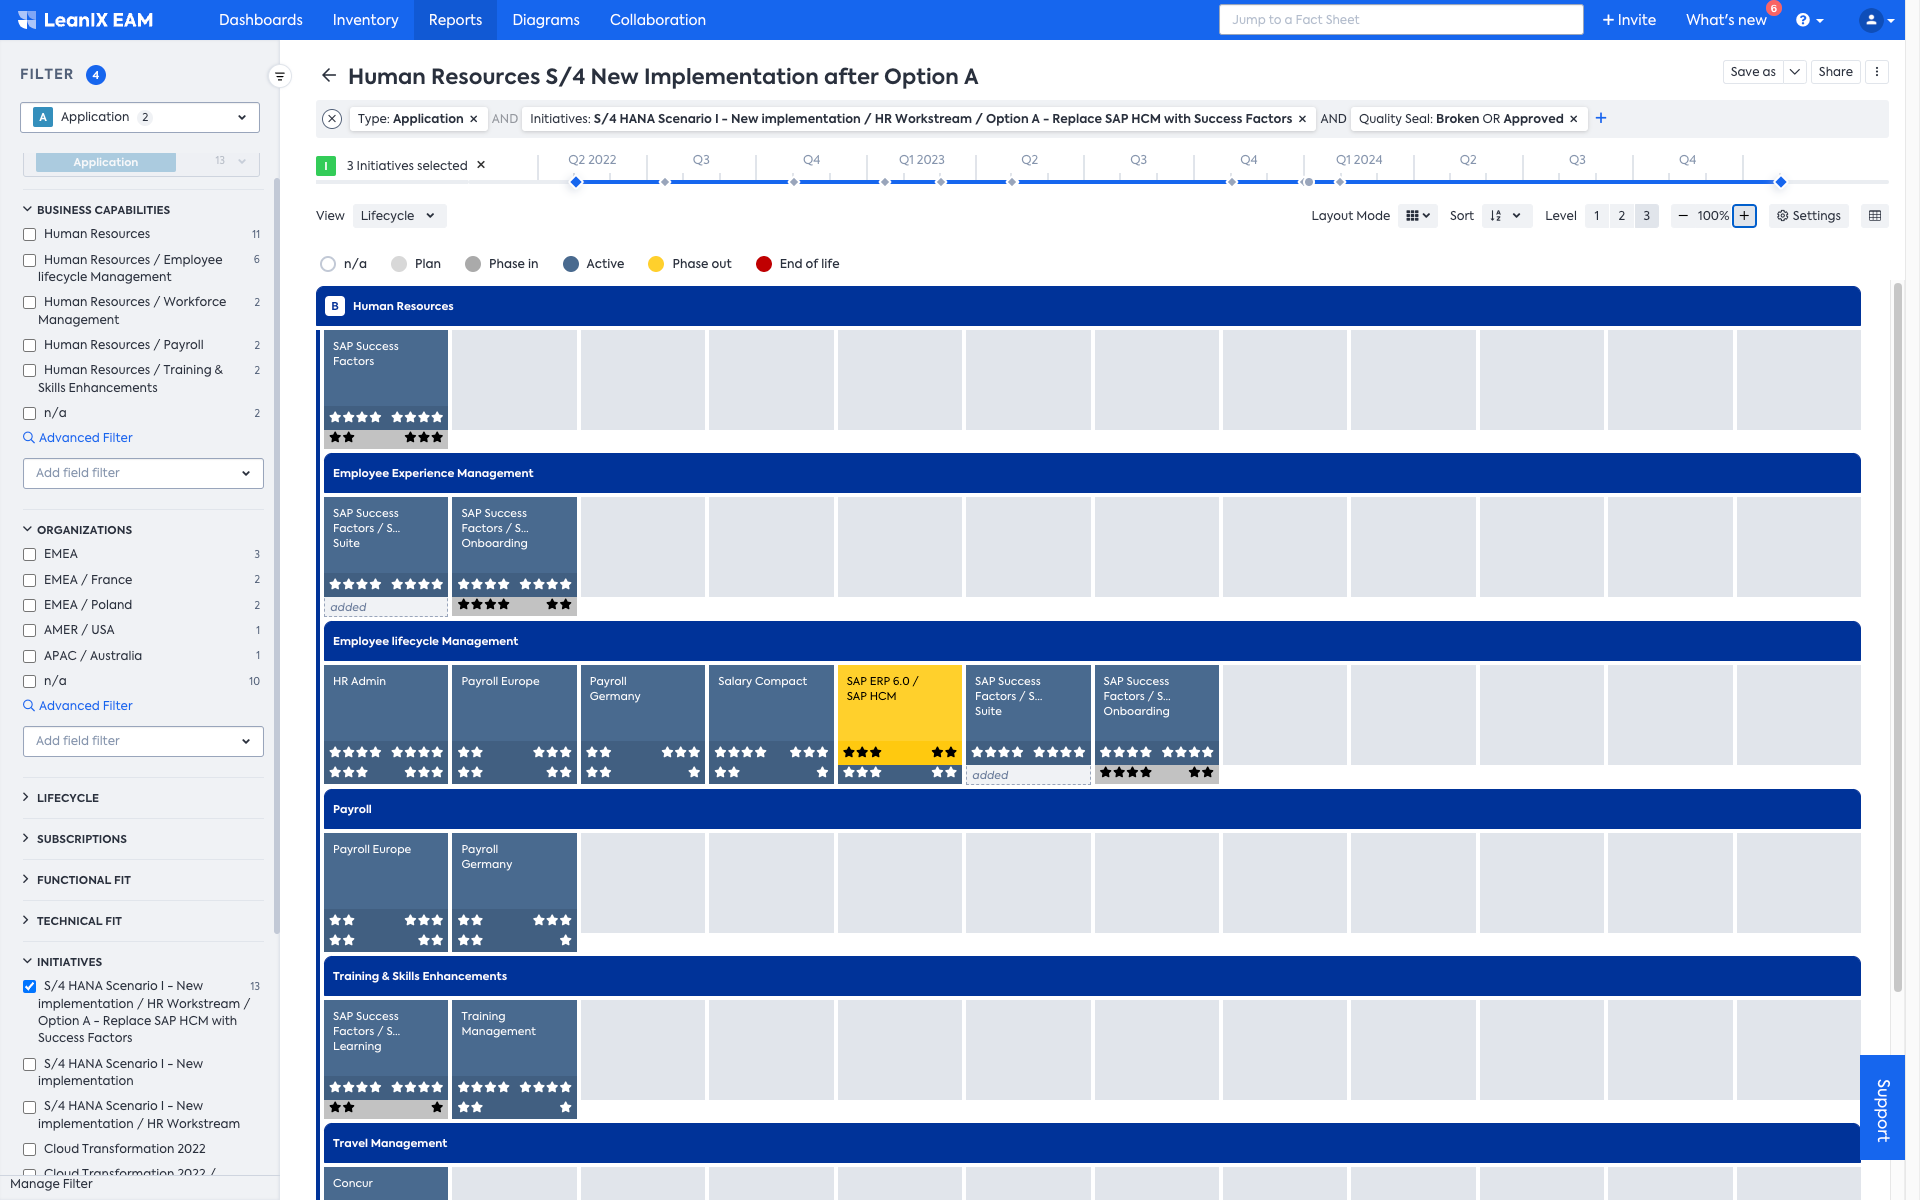
Option A: Application Landscape Reports showing the effect on IT landscape
Example for Option B:
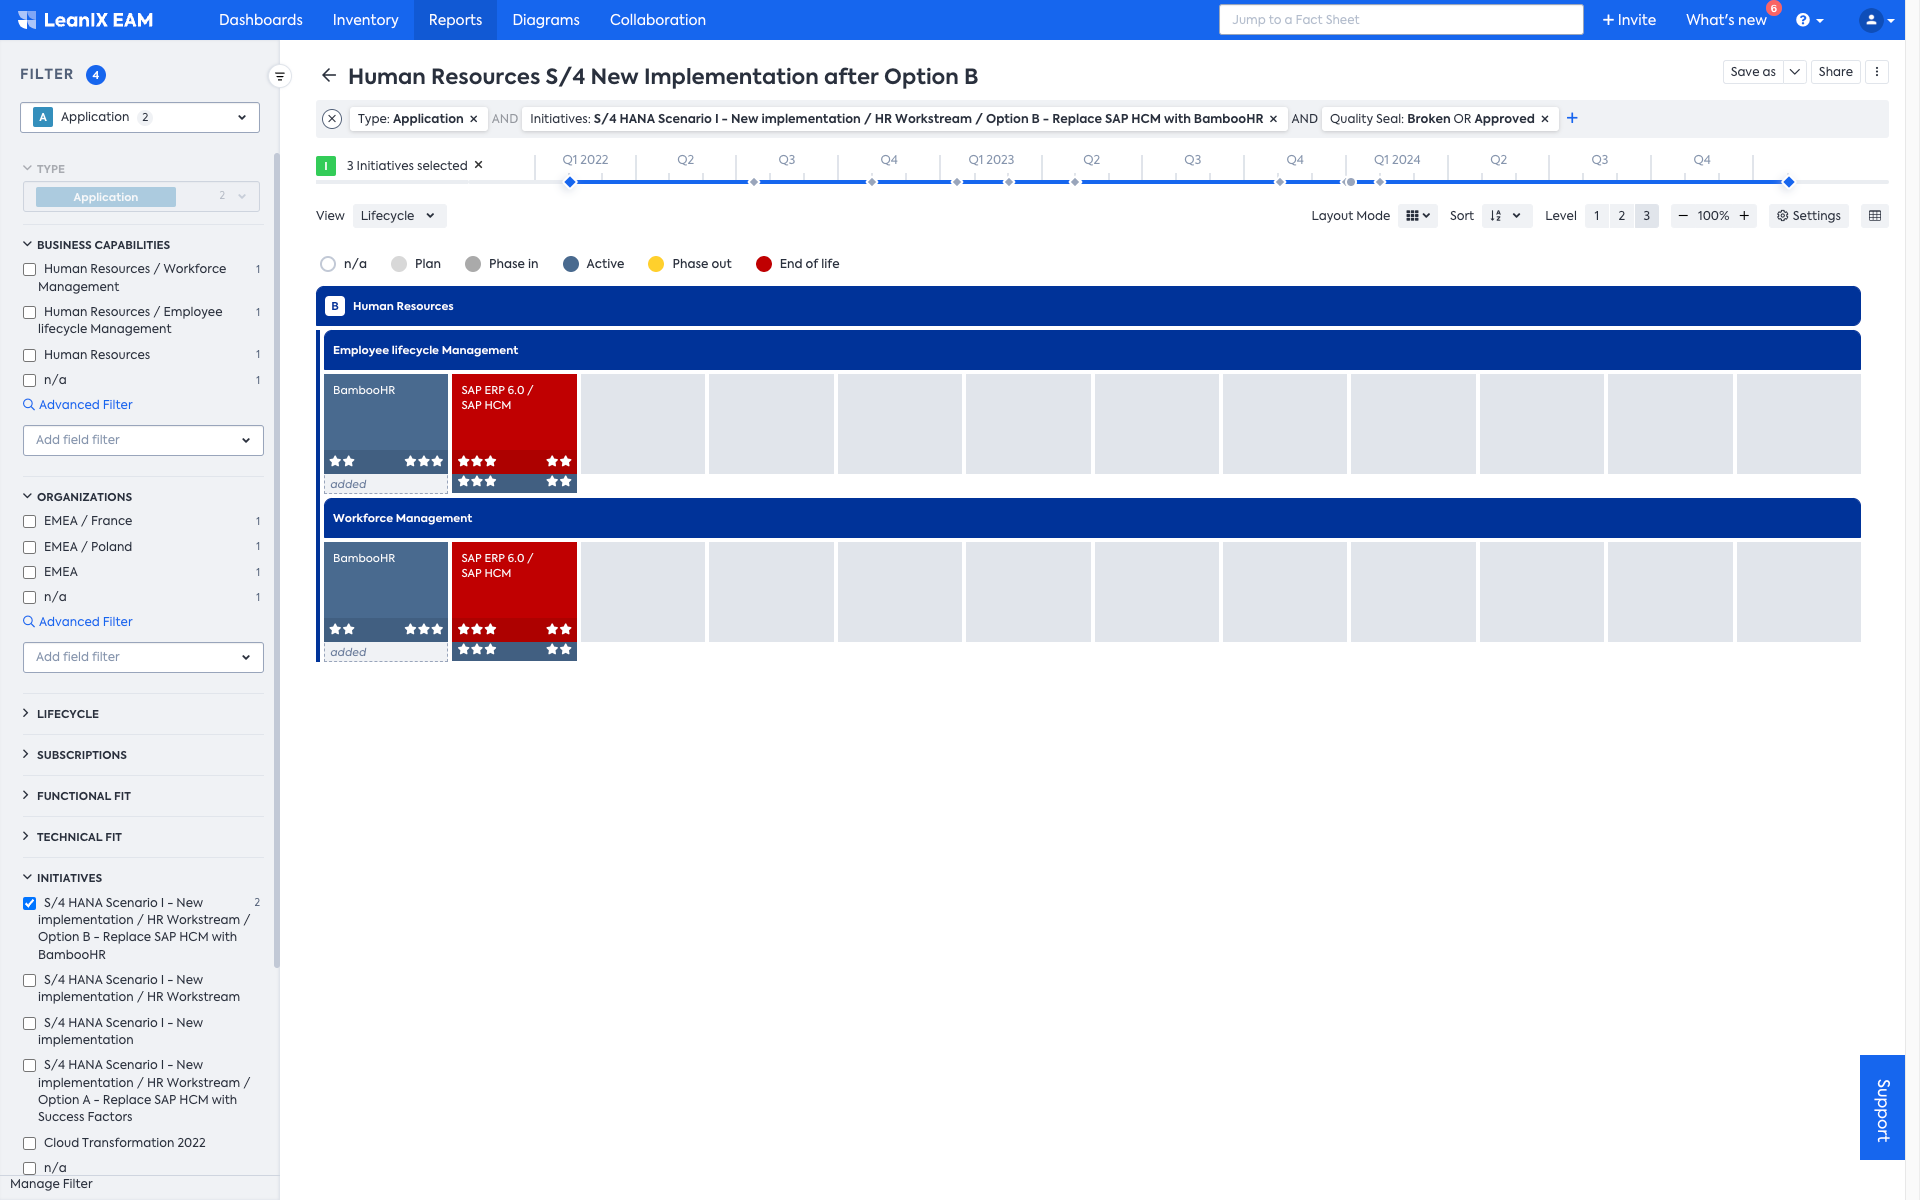
Option B: Application Landscape Reports showing the effect on the IT landscape
-
You can also use the Roadmap Report to see how certain aspects of your landscape change over time due to the selection of one or more Initiatives:
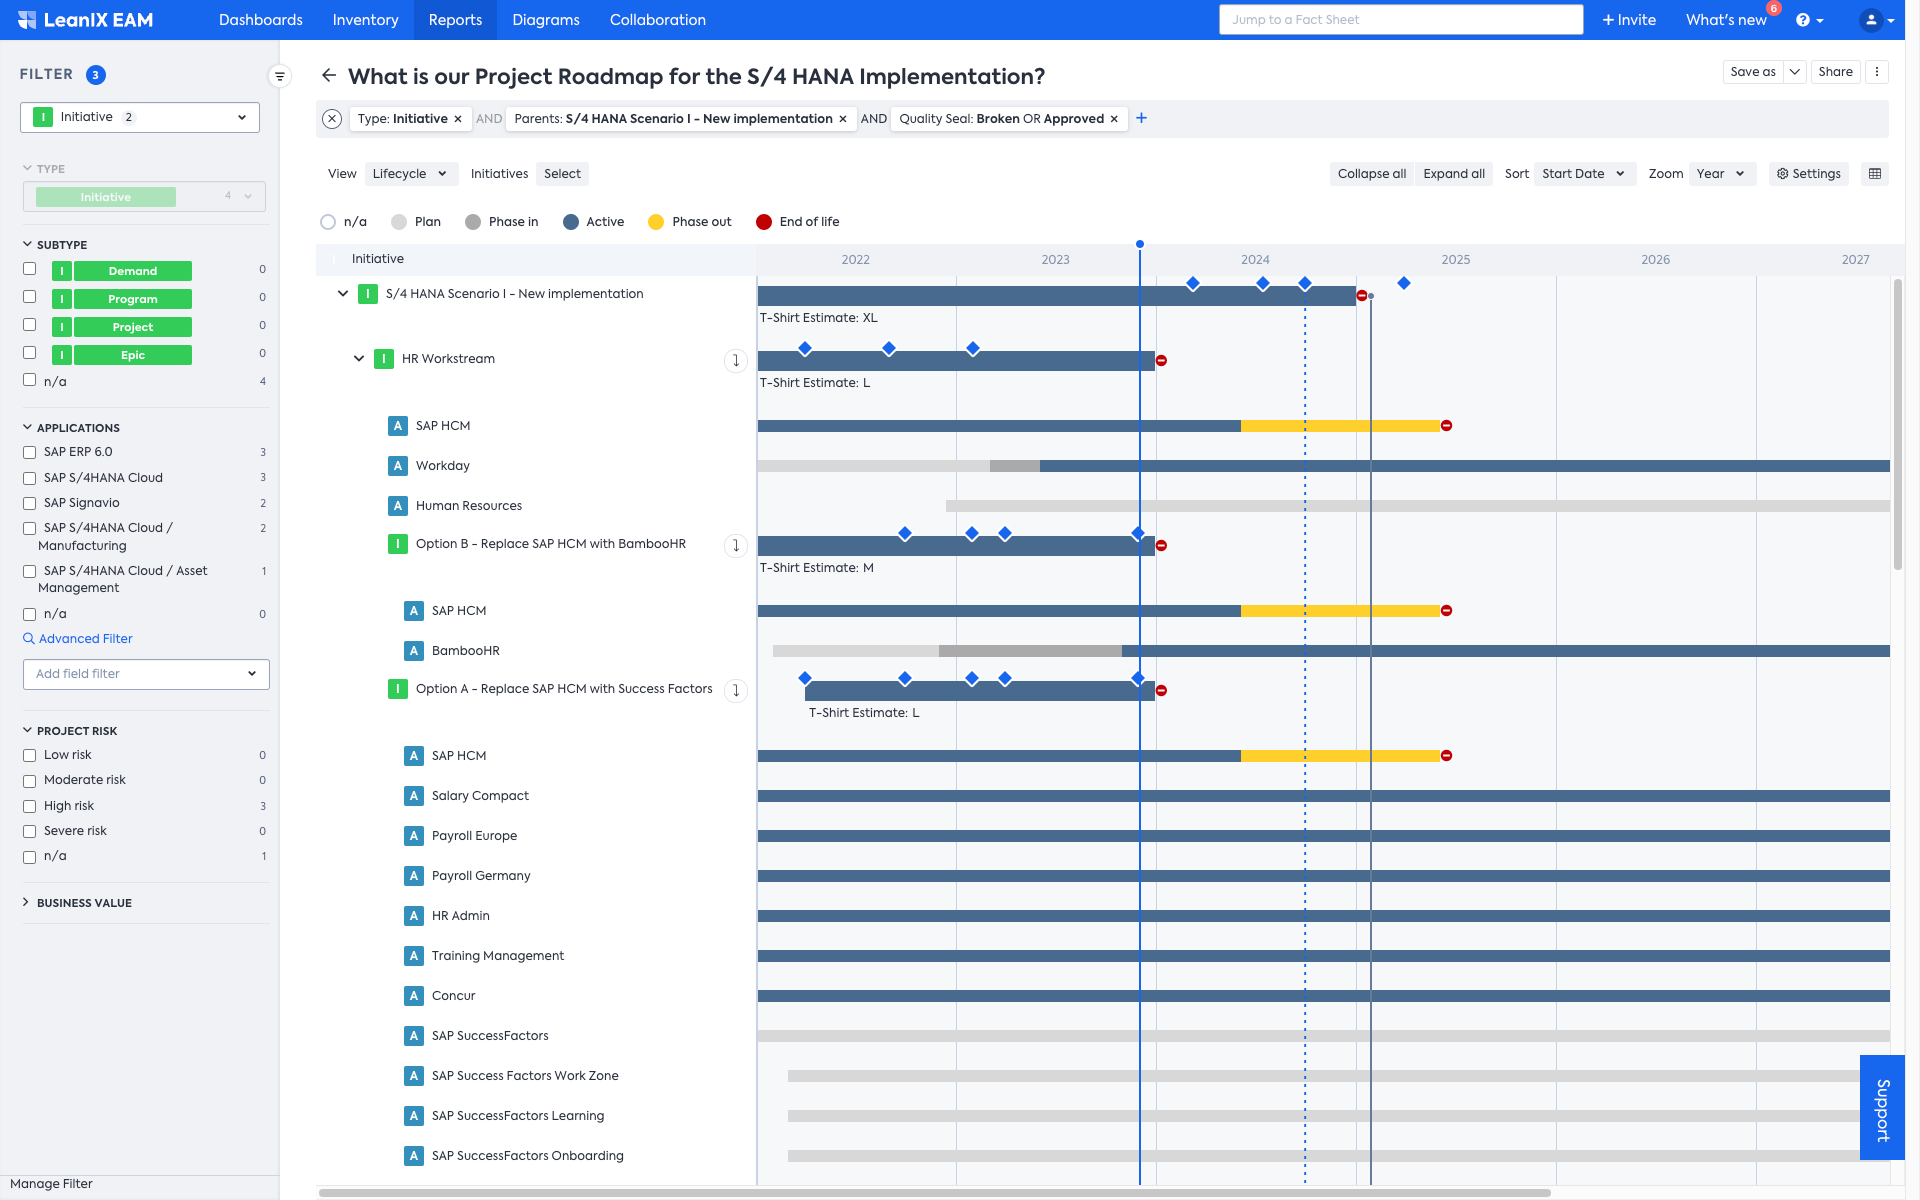
Project Roadmap Report showing impacts of SAP S/4 HANA implementation
-
Interface Circle Map showing how the SAP S/4HANA migration will affect the integration architecture:
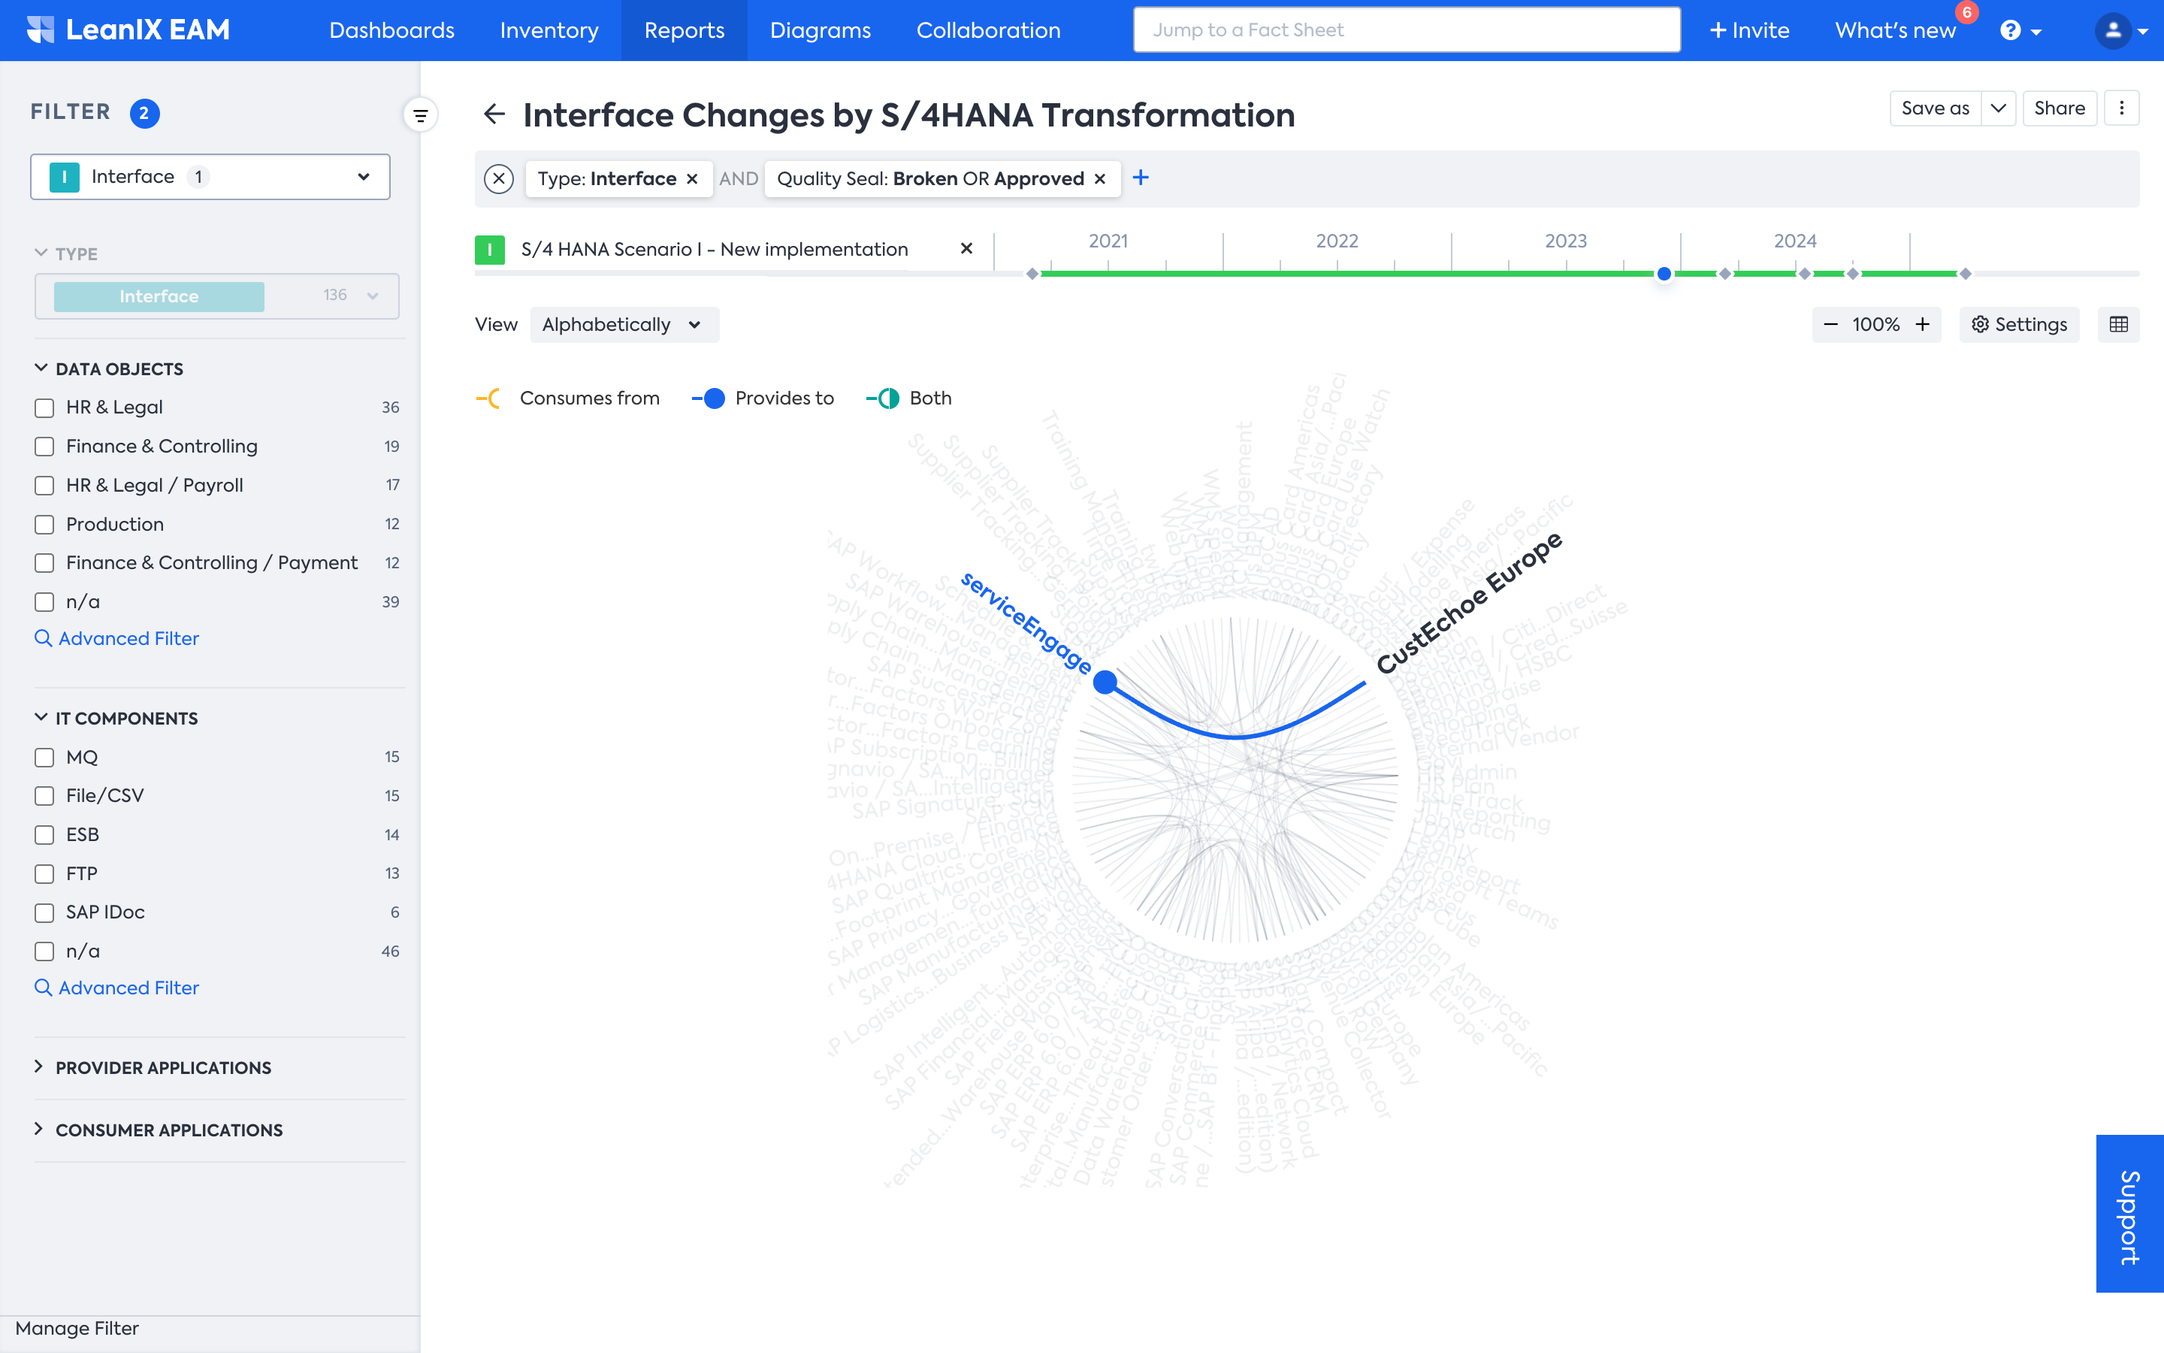
Interface Circle Map showing how the SAP S/4HANA migration will affect the integration architecture
-
The example below displays Impacts in the Application Landscape Report helping you identify deviations from the standard and pinpoint areas where technical debt has been accumulated:
Application Landscape Report showing accumulated technical debt
Step 3. Report and Communicate
As in the previous phases, you will evolve your dashboards for the different stakeholder groups and leverage the above reports to share key insights.
Illustrative Dashboard for Phase 3 (Explore)
In addition, you can add the following KPIs and views to measure the progress of your transformation program:
-
ERP Roadmap with Initiatives and milestones: Roadmap Report providing a high-level overview of the ERP transformation timeline, different projects, and Milestones. It also serves as high-level guidance on which Initiatives to focus on first. This will be a more detailed view since more detailed data collected in phase 3.
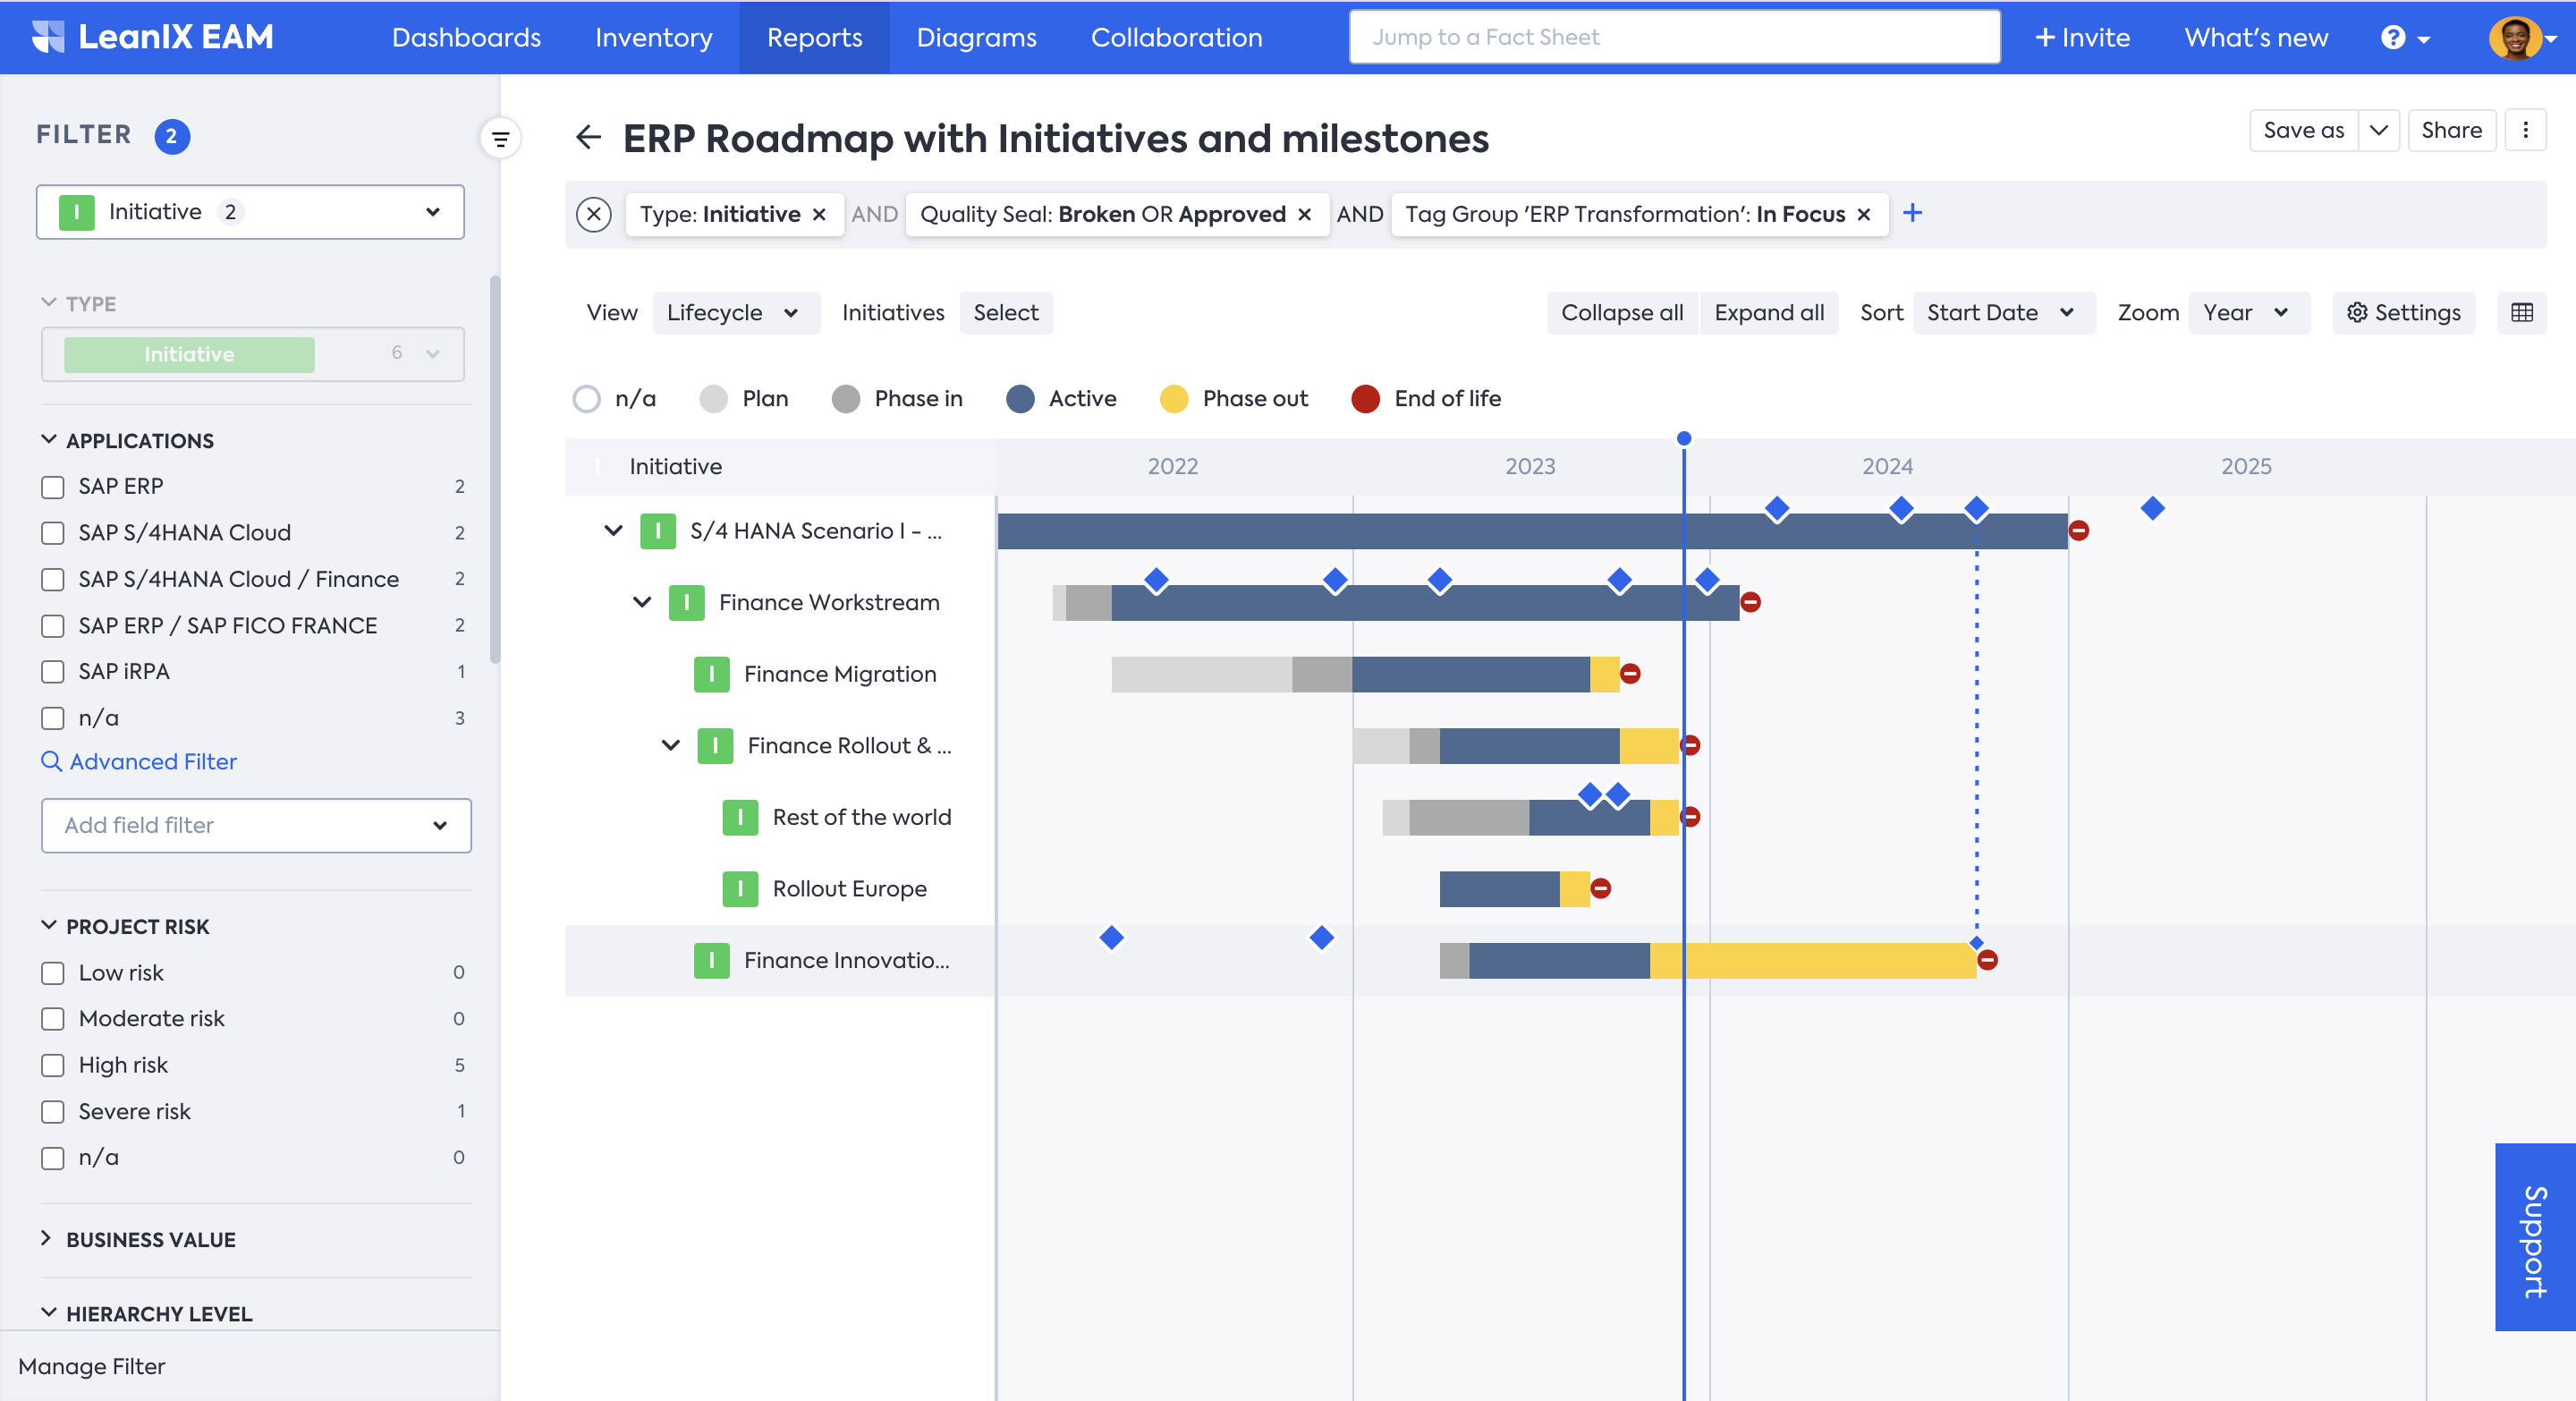
ERP Roadmap with Initiatives and Milestones
-
Quality of Initiatives: Overview of KPIs providing a first high-level overview of the number of Initiatives that are supporting the ERP Transformation, and for how many of those Initiatives mandatory attributes have been filled/assessed (Responsibles, Lifecycles, Business Risks).
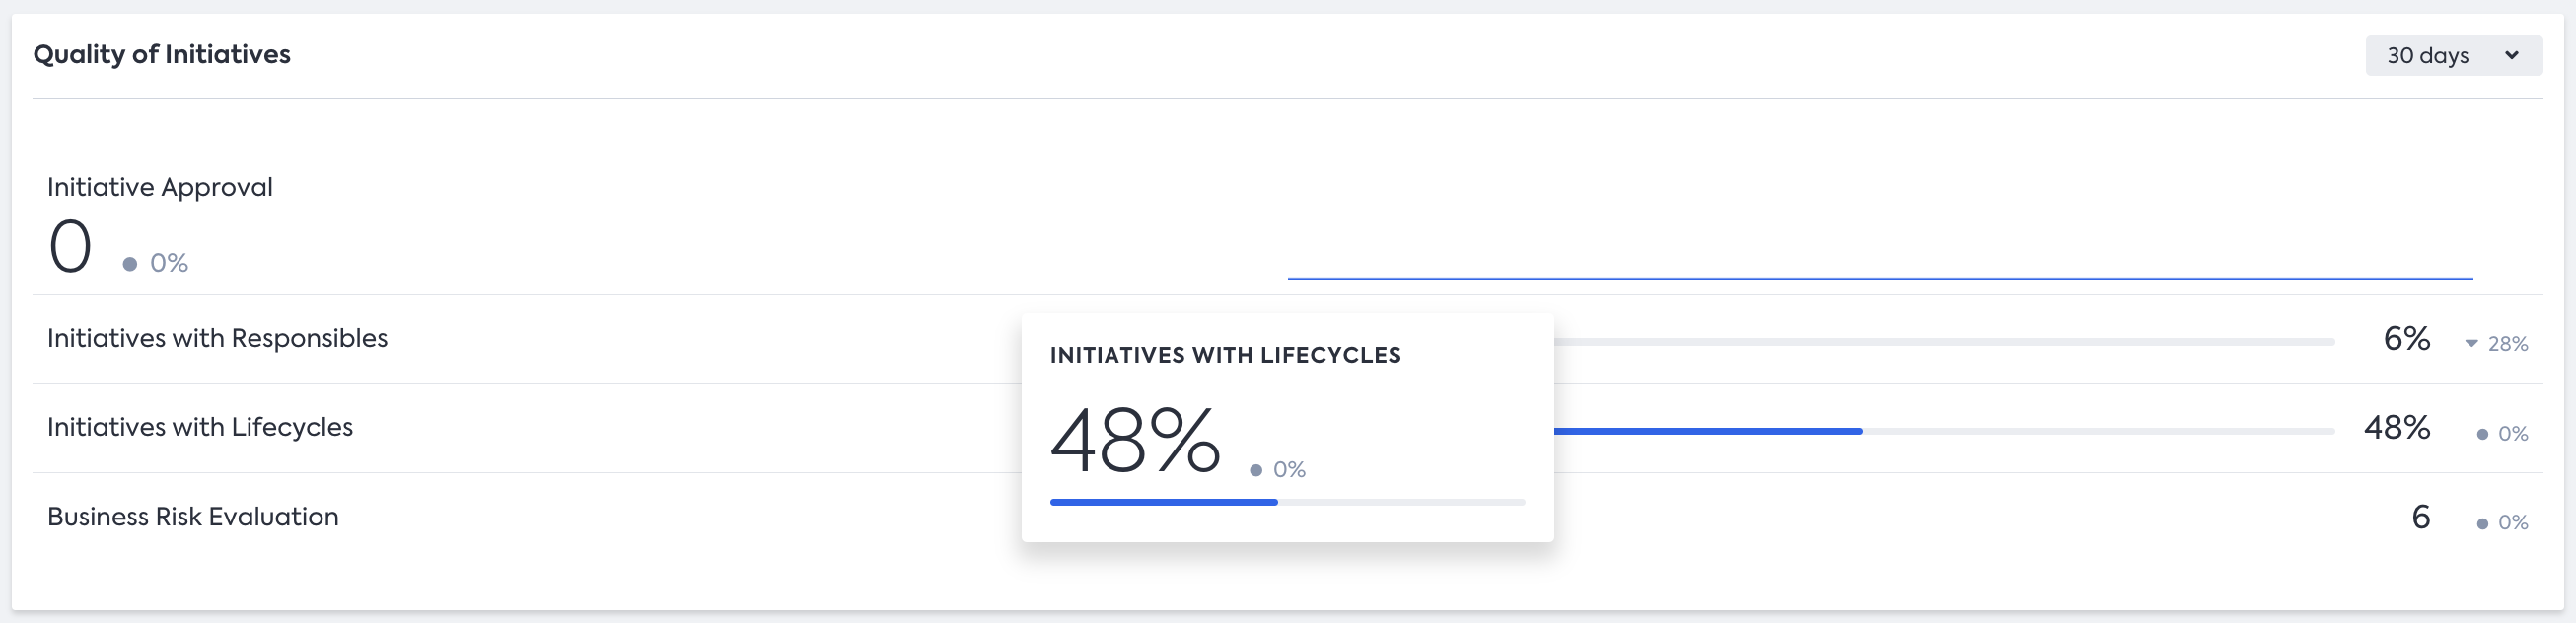
Quality of Initiatives showing the status of Initiative completeness
-
As-Is Application Landscape and To-Be Application Landscape: Build Application Landscape Reports for as-is and the future-state landscape, then add them to the Dashboard to show the contrast and status of progress.
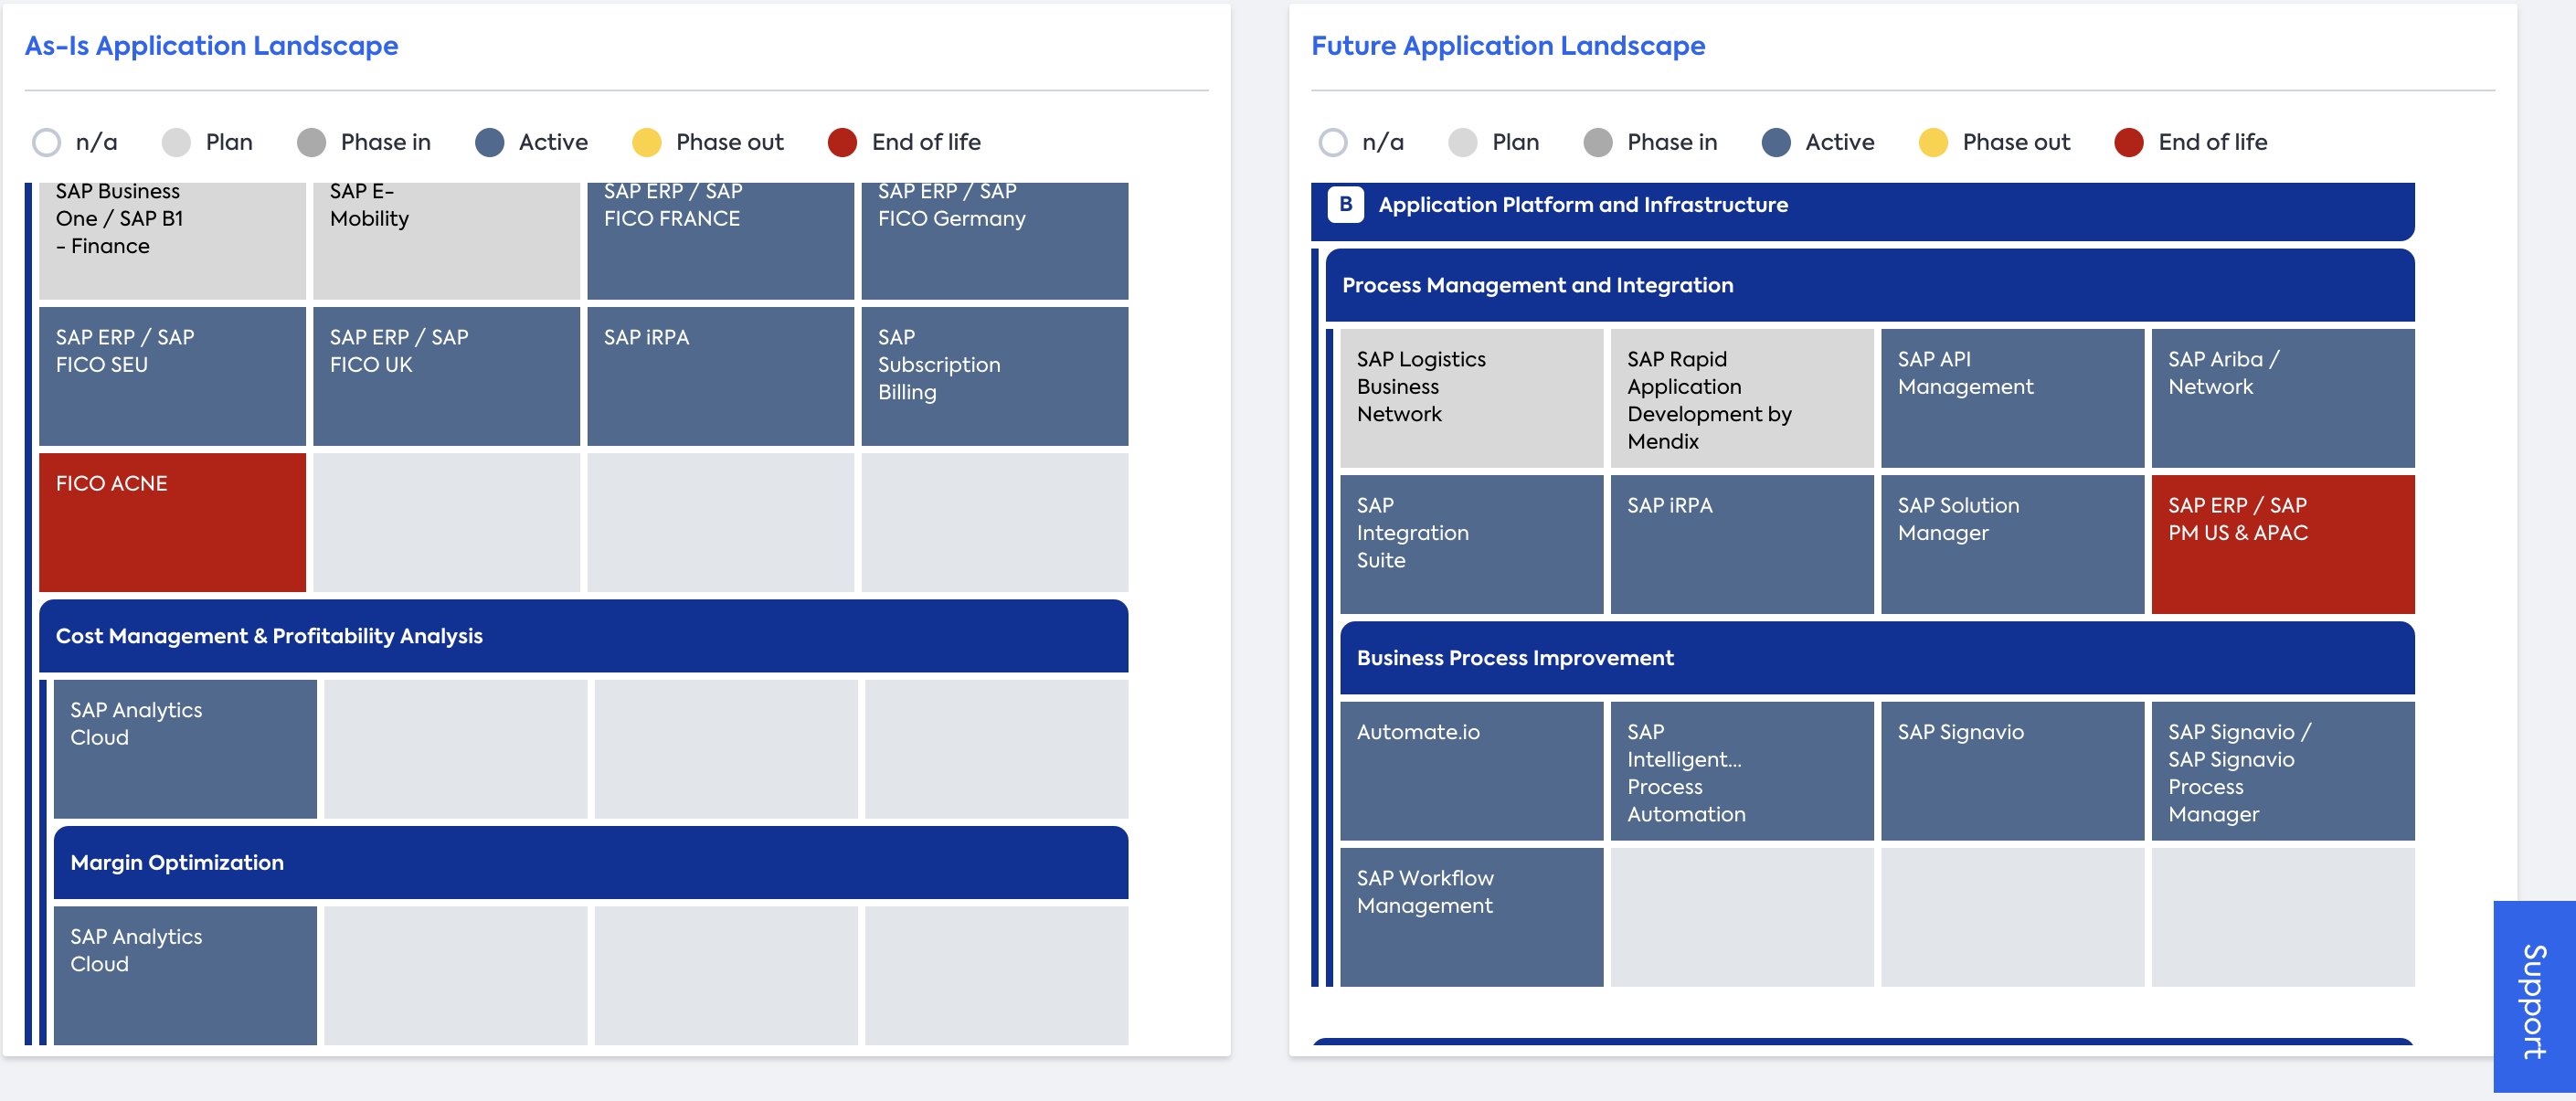
Application Landscape Reports showing the contrast between as-is and the future-state landscape.
Optional: Creating Solution Architecture Diagrams
You can use the SAP LeanIX Diagrams to detail your solution architecture and engage with more technical roles, such as Solution Architects.
At the end of this phase, you have all the data needed for your management to decide on the most suitable transformation scenario, which you will execute in phase 4 (Realize).
Updated 23 days ago