Application Portfolio Management Dashboard
SAP LeanIX offers out-of-the-box dashboards to support users in specific use cases, e.g., Application Portfolio Assessment.
Note
The Application Portfolio Management dashboard is available in all SAP LeanIX products.
Dashboard Structure
The Application Portfolio Management dashboard consists of the following elements:
- Live Applications by Business Capability
- Application run cost broken down by Business Capability
- Portfolio Complexity
- Data Quality KPI
General features of the Dashboard
The dashboard provides the following key capabilities:
- KPI calculation: All KPIs are calculated on a daily basis and are archived in order to provide a KPI history. KPI values are therefore never older than 24 hours. You can click most KPIs in order to navigate to the Inventory and review the Fact Sheets that the KPI has been calculated on.
Deviating Inventory filters
Not all subsets of Fact Sheets used for KPI calculation can already be represented as a filter in the Inventory. This applies in particular to lifecycle filters. Therefore, there can be deviations between the subset of Fact Sheets based on which the KPI is calculated and the Fact Sheets displayed in the Inventory after clicking a KPI. Please note that these discrepancies do not affect the correctness of the KPI calculation. We are actively working on making these filters available in the Inventory as well.
- Filters: All KPIs on the dashboard exclude Applications that are "end of life", meaning that the Application has reached the so-called lifecycle phase. The same holds true for any Fact Sheet that has Quality Seal "Draft" or "Rejected".
- Configuration: As of now, the dashboards aren't editable. Users can create a copy of them and then edit the copies to their desire.
Live Applications by Business Capability
This panel provides an overview of the number of Applications your organization uses and groups them by top-level Business Capabilities. Depending on the situation of your business, this count might be relevant to you, e.g., if you are in a merger scenario, getting rid of redundant Applications, or you might want to track your rationalization efforts.
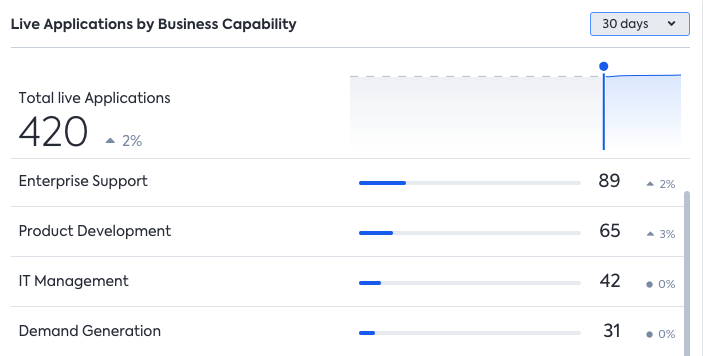
The panel features an overview of the total number of applications and a count for every top-level Business Capability. Additionally, a trend is represented next to each KPI, showing whether the KPI has changed within the selected time interval.
There is also an entry "Missing Business Capability" or "n/A", which shows the number of Applications not supporting a Business Capability (most likely a hint that relations are missing). Currently, this is counting both Applications that don't have a link set and Applications that have been set intentionally to "empty".
Application run cost broken down by Business Capability
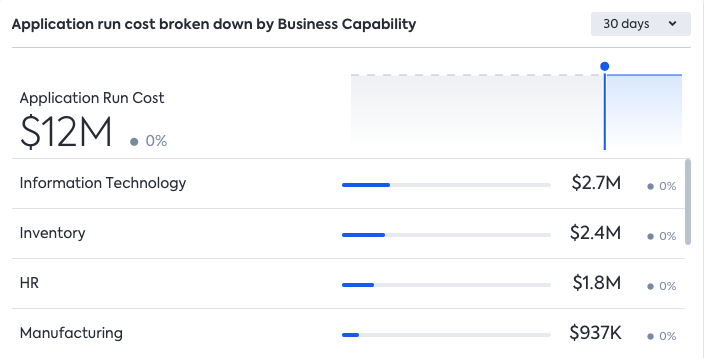
This second panel helps you track the run cost of your Applications as provided by the "Total annual cost" field on the relation between IT Components and Applications.
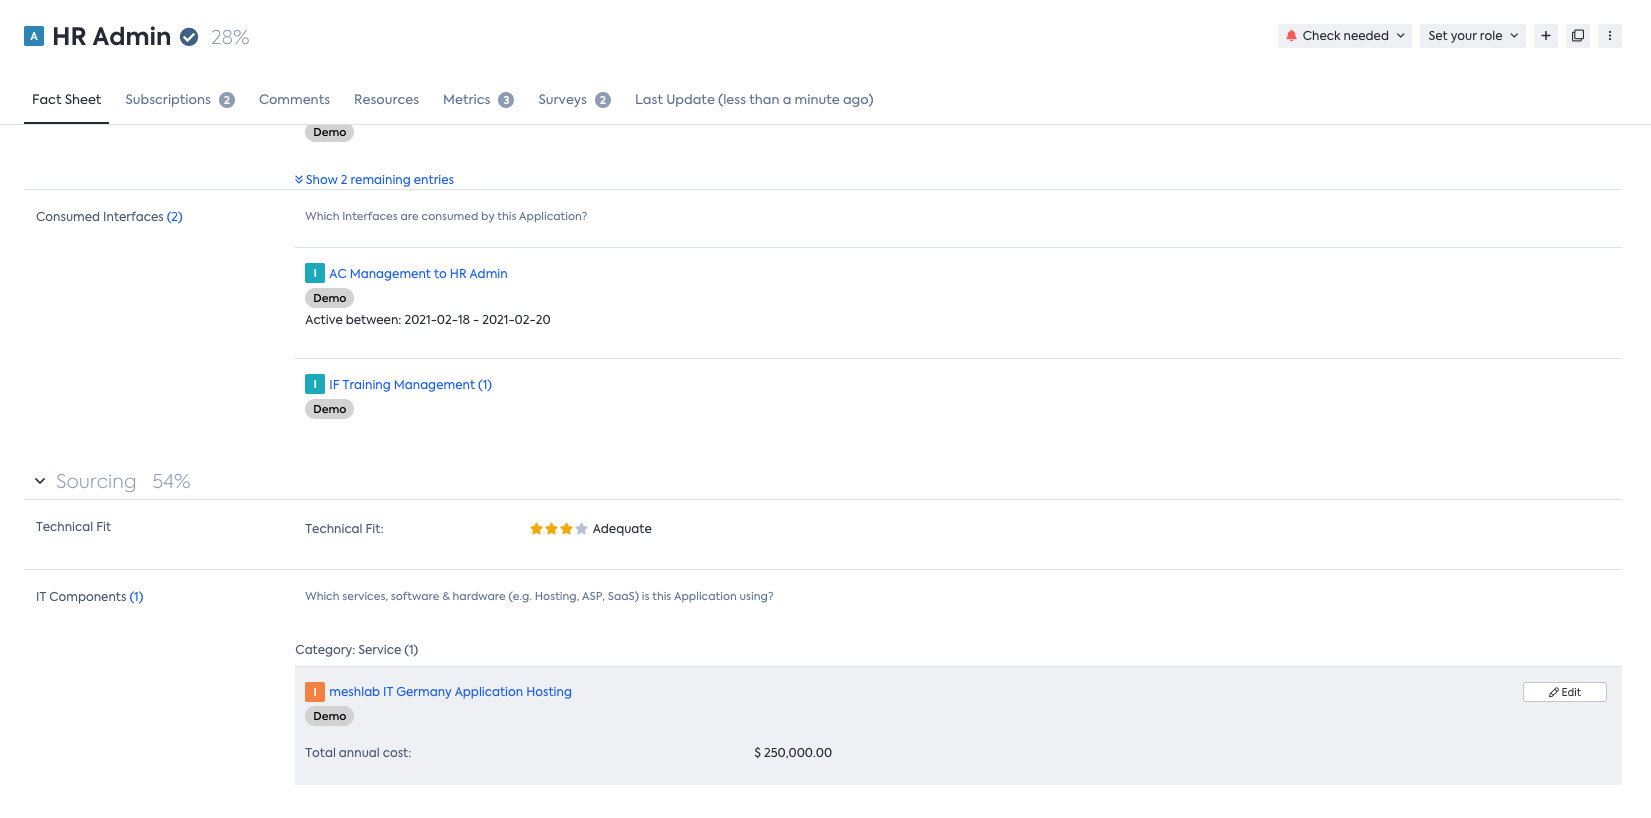
Example of the Application "HR Admin" that is running on an IT Component with a total annual cost specified.
On the panel, users can review the total costs and costs grouped by the different Business Capabilities.
Portfolio Complexity
Your portfolio's complexity can largely impact your organization. If, e.g., some Applications are linked with many Interfaces and support many different Business Capabilities, any change is expensive. The portfolio complexity panel helps you in tracking key KPIs about the interconnectedness of your Applications.
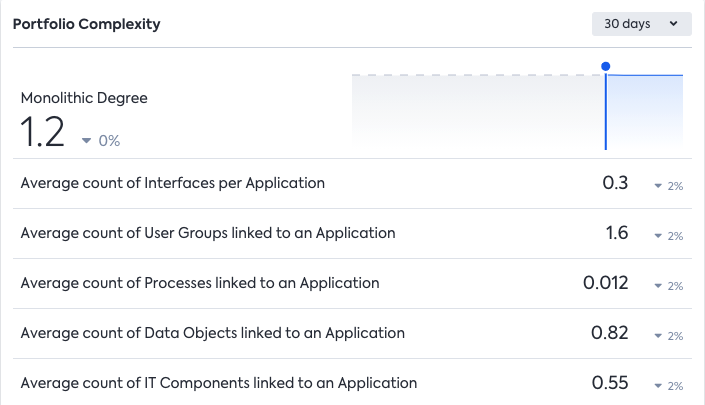
Monolithic Degree
For every Application (with at least one linked BC), we calculate the monolithic degree as follows:
- We retrieve all linked Business Capabilities.
- For all linked Business Capabilities, we determine the level 1 (top-level) Business Capability linked to it.
- We count the amount of unique top-level Business Capabilities as a result.
To determine the monolithic degree of your portfolio, we take the average (mean) of all Applications' monolithic degrees.
As a guideline: A smaller monolithic degree is often preferable.
Average count of Interfaces per Application
We count how many Interfaces (both providing and consuming) are available for every Application and then determine the average (mean) for all Applications. A low value (<1) usually hints at missing data. A high value (>10) hints at high complexity.
Average count of Processes / User Groups / Data Objects / IT Components linked to an Application
All of these KPIs aggregate the average counts of linked Fact Sheets of the specific type per Application. Just like before: A very low value hints at missing data, a very high one hints at high complexity.
Data Quality KPI
This panel allows you to track whether the necessary information is in place to perform your use case on this dashboard.
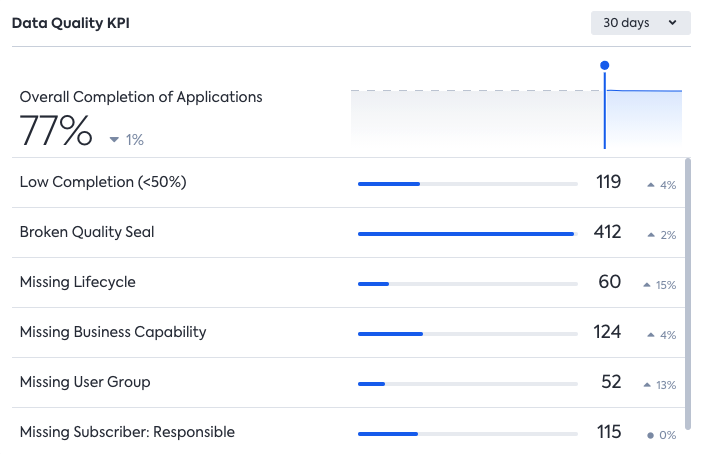
Overall Completion of Applications
Depending on your definition of the completion score on Fact Sheets (and their sections, subsection, and fields), we will aggregate the completion score and show it in this panel.
Low Completion (<50%)
This is the number of Fact Sheets with a completion score below 50%. As we can't express this for now as an Inventory filter, the KPI is not actionable. (We are working on that, though)
Broken Quality Seal
Count of Fact Sheets with a Quality Seal in the state "Broken".
Missing Business Capability / User Group
These are the respective counts of Applications not being linked to any Fact Sheet of the type. As opposed to the "grouped" KPI in the first panel, the intentionally left blank Applications (see Leaving a Relation Empty ) are not included in this count.
Missing Subscriber: Responsible
These are the count of Applications where we couldn't find a subscriber with the subscription type "Responsible".
Updated 9 months ago
