
Radar Report
A Radar report offers a visual representation of fact sheets categorized in rings and sectors. It aids in understanding an organization's tech landscape and evaluate technology standards.
Overview
A radar report provides a visual representation of fact sheets, categorized and arranged in concentric rings and divided in to sectors along two axes. The categorization of fact sheets is determined by the values of fact sheet field or values of tag group assigned to the rings and sectors.
Fact sheets are represented as colorful dots on the radar report, with rings and sectors serving as the two dimensions for clustering them. Typically, application and IT components serve as the base fact sheets for radar reports, but any other fact sheet types can also be used to create a radar report.
Radar report is the optimal tool to have a consolidated view of an organization's technology landscape. It enables stakeholders to visualize technology standardization, to make critical decisions about adopting new technologies, phasing out legacy components, evaluating emerging technology trends and to develop technology strategy.
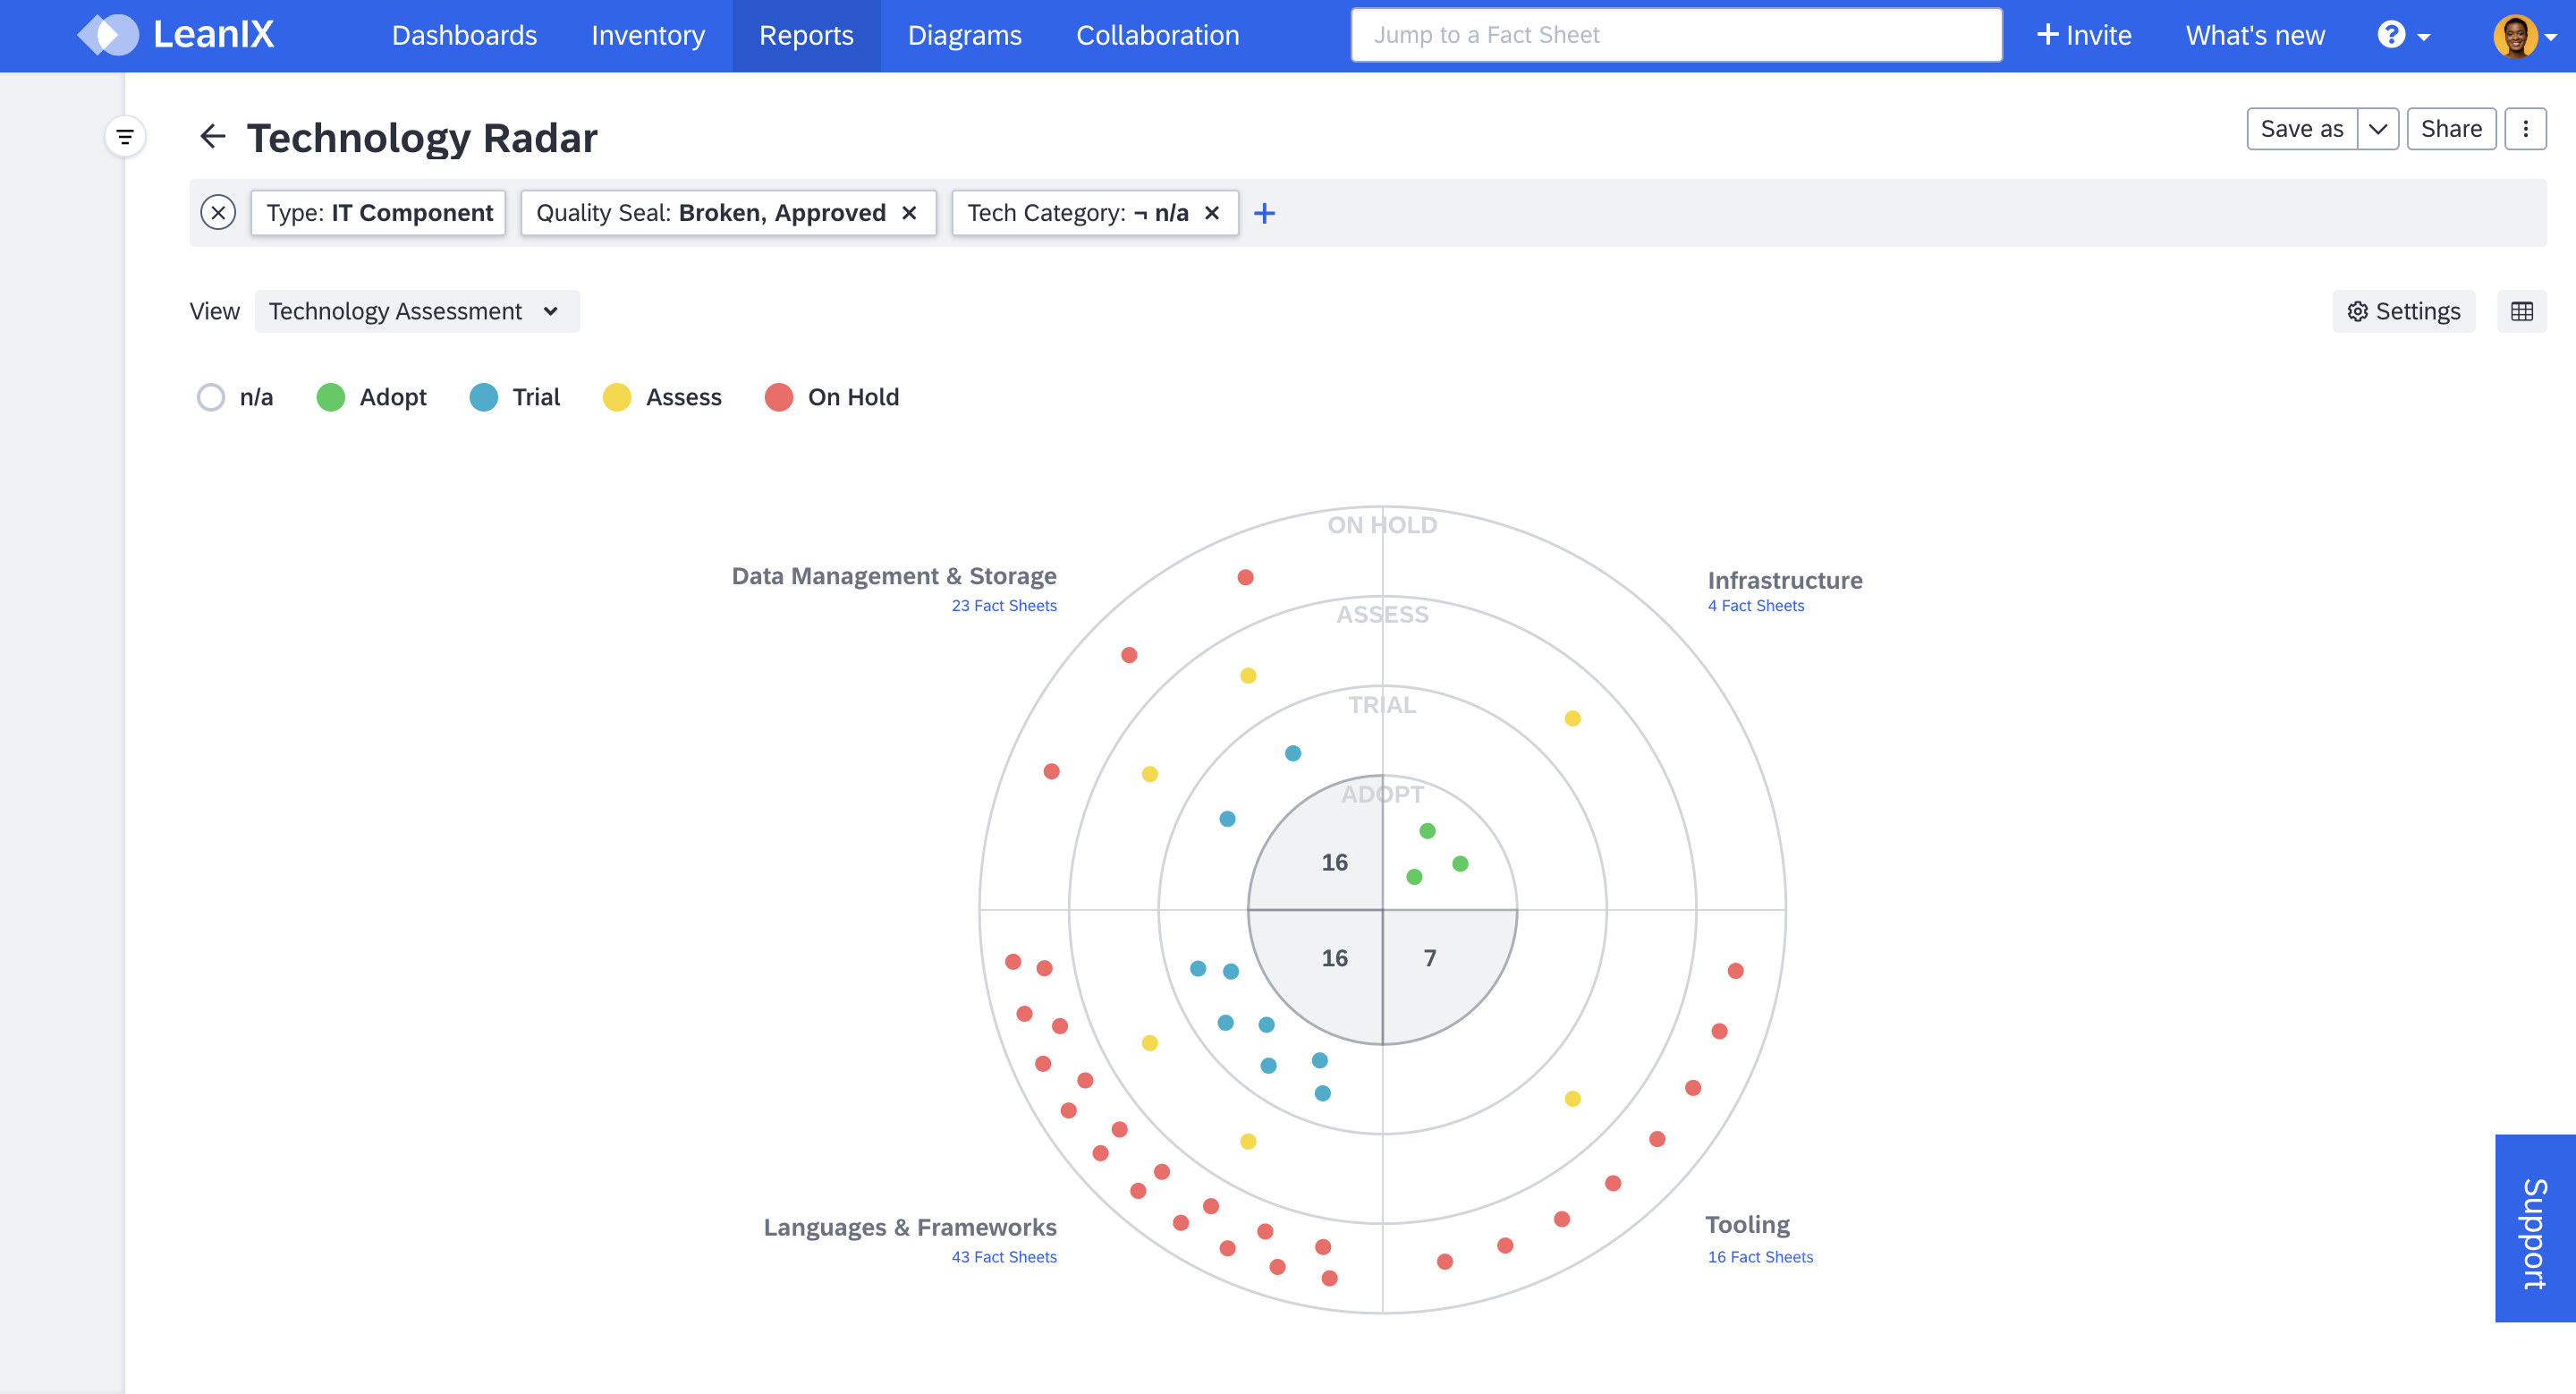
A Technology Radar Report
Technology Assessment View
The Technology Assessment attribute, shown as report view in this guide, is part of the AI governance extension to the meta model. You can activate the AI governance extension from the Optional Features & Early Access section in the administration area. To learn more, see AI Governance Extension to the Meta Model.
Using Radar Report
Configuring Rings and Sectors for Fact Sheet Classification
Fact sheets are categorized based on values of fact sheet fields or tags that are assigned to rings and sectors. It can be configured in report settings.
- Select Settings at the top right corner of the report. It opens the report settings dialog.
- In the report settings dialog, select the field or tag from the drop down menu for Ring Category and Sector Category.
- Click Apply.
Only single-select fields and tag groups can be assigned to rings and sectors, and the order of the rings and sectors is determined by how they are ordered in the meta-model. When using tags, the order is alphabetical. The radar report is limited to displaying up to seven rings. Therefore, the assigned field or tag can have a maximum of 7 values.
Note
- If there are too many dots within a single segment, the report will instead display the number of fact sheets in that segment
- The color code of the fact sheets depends on the ring and sector category.
Applying Views
Applying different views to the report allows for different perspectives and deeper analysis, akin to adding a third dimension for analysis. When applying a view, the color representation of the fact sheets changes. Therefore, it is good to apply the same field or tag group for the view that is assigned for the rings. This facilitates easier consumption of the report.
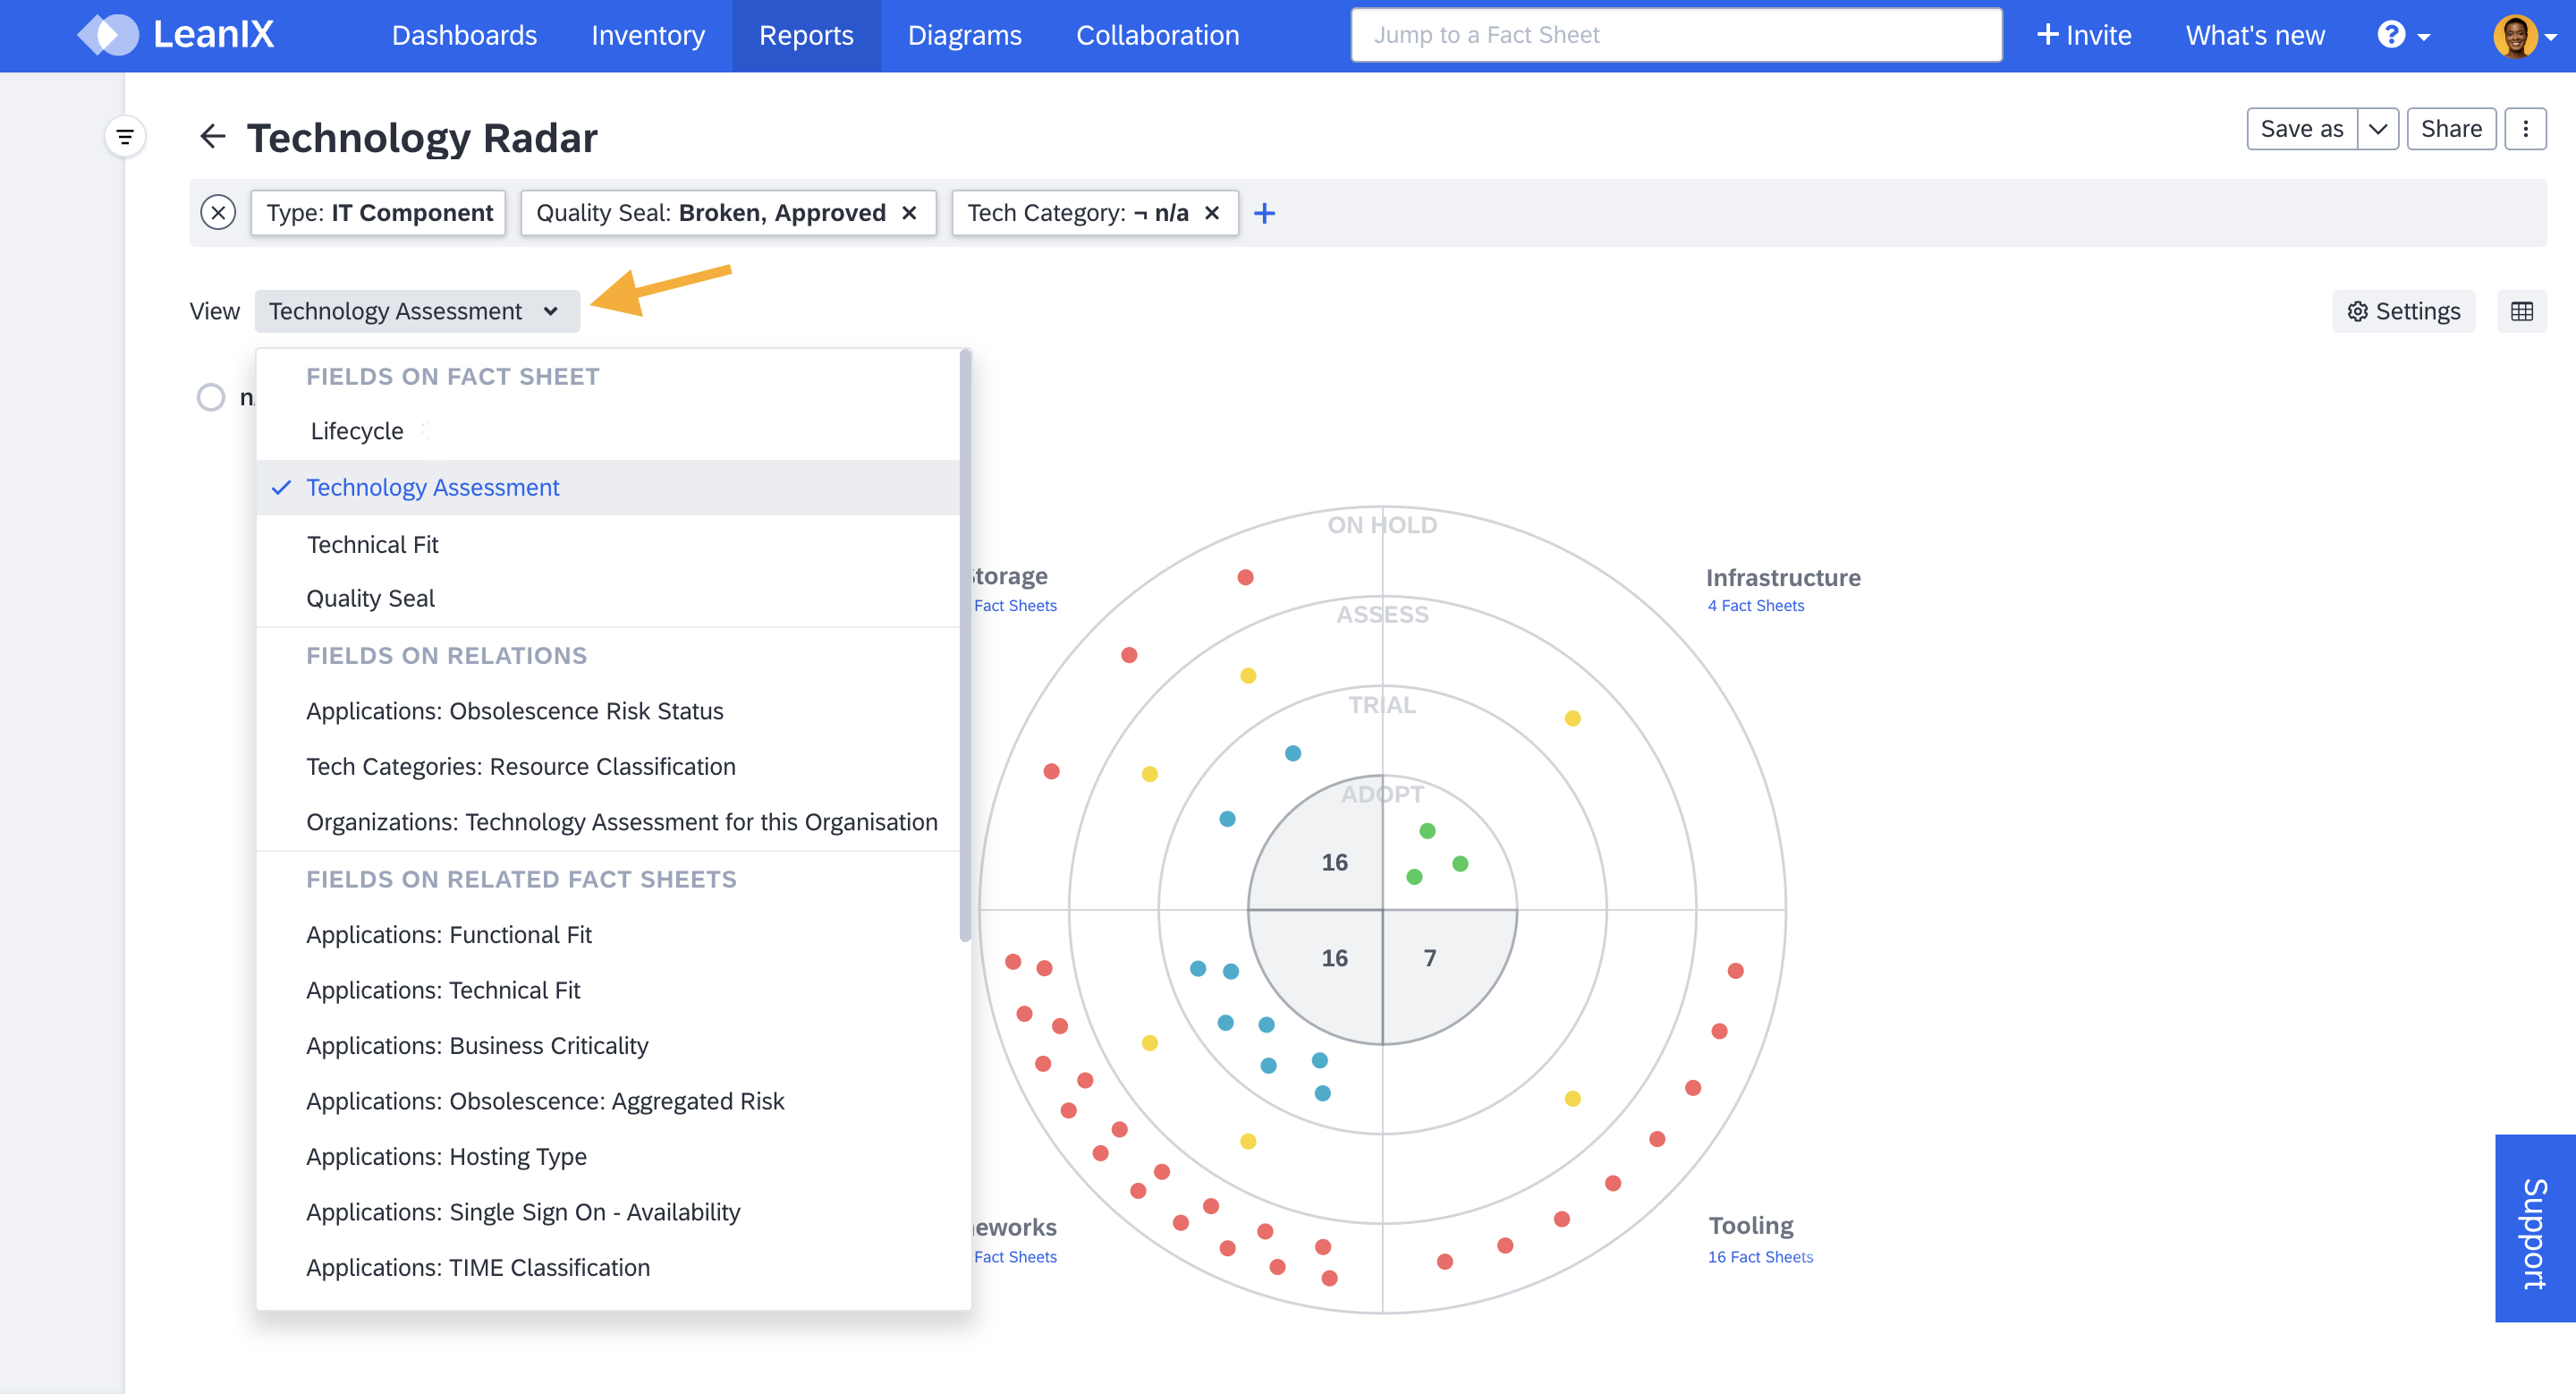
Applying Views in Radar Report
Applying Filters
You can filter data based on specific criteria, such as relations to business capability, IT component, application and more. This allows you to create customized views and narrow down scope by focusing on specific technologies or applications within the report.
Filters can be applied using either the filter bar at the top or the filter facets on the left-hand side, which appear when hovering the mouse pointer on the left side of the window. For more information on applying Filters, see Applying Filter in Reports.
'OR' operator for filtering is currently not supported in radar reports.
Side Panel for Additional Information
When you click on any sector in the radar report, a side panel opens up offering additional information about the applied view, the specific sector you clicked on, and the ring it belongs to. For example, in a tech radar report, this information could include the category and assessment of a particular technology.
Similarly, if you click on a single dot within the radar report, side panel offers details of the selected fact sheet. This allows you to quickly edit the information in the fact sheet, for example to quickly change the assessment category or perform other related actions.
Editing Fact Sheet Fields in Side Panel of Report
Organization-Specific Technology Assessment
You can assign different assessments for the same IT component across different business units, lines of business, or legal entities. You can do that by moving the technology assessment field to the relation between the IT component and the organization fact sheet in the meta model. This allows you, for example, to assess an IT component as 'Adopt' for one organization and 'Trial' for another organization where that IT component has a different purpose.
In the radar report, you can select such single-select fields on relation as a parameter for either the sector or the ring. When you do, a dialog will prompt you to choose a specific organization, ensuring the generated report is built specifically for the selected organization.
Note
The radar report does not support aggregating data from multiple relations simultaneously.
Updated 3 months ago