
Reports and Roadmaps
Reports offer valuable insights throughout—from gaining clarity and visualizing target architecture to comparing scenarios, planning roadmaps, and monitoring progress.
Note
SAP LeanIX Architecture and Road Map Planning was previously known as Business Transformation Module (BTM).
Reports play a vital role in guiding your transformation journey. They serve as powerful tools for analysis, decision-making, and communication with stakeholders. From gaining a clear view of your initiative portfolio to visualizing the target architecture, comparing scenarios, planning roadmaps, and monitoring progress, reports provide valuable insights.
SAP LeanIX Architecture and Road Map Planning further strengthens the reporting capabilities of SAP LeanIX with the following features:
- Reports are enriched with Impacts: A new View Impact Type in reports allows you to see how various applications are impacted because of an Initiative and understand the detailed impacts of future changes, including dependencies between people, data, and infrastructure. Learn more about Impacts in Impacts.
- Roadmap Reports are enriched with Milestones: This allows you to visualize and understand major milestones of your initiatives, keep track of your modernization plans, and ensure IT transformation is on time, scope, and budget. Learn more about Milestones in Milestones.
- Timeline Projections: Reports with timelines are enriched with Project/Initiative projections. It helps you compare and understand how your IT landscape changes at different points in time, based on the projected Initiatives.
Visualizing Future Changes of Transformations
To visualize the future changes that the transformations will bring to your IT landscape, do the following:
-
Navigate to reports with a timeline.
-
Click on Add an Initiative + button located on the left side of the timeline.
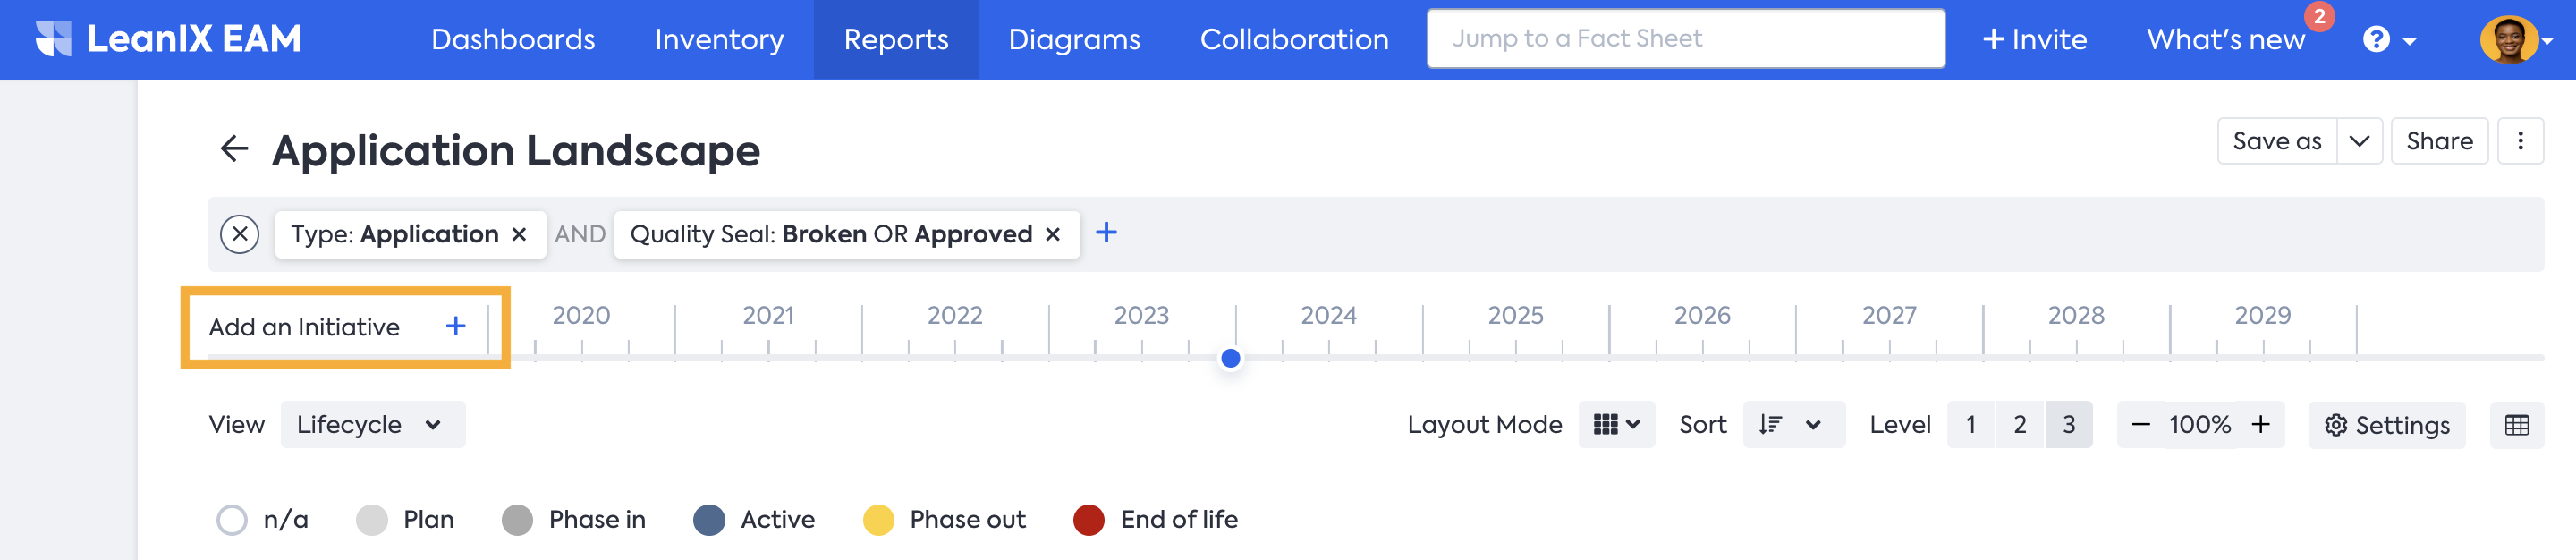
Adding Initiative to the timeline
-
From the selection window, select the Initiatives that include the Transformations whose impact you wish to visualize. Selecting the parent project is sufficient to view all the impacts; there's no need to choose every project in the hierarchy.
-
Click Use Selected Fact Sheets.
With this, the impacts of the selected projects become visible in the report. Navigate to any point in time by clicking on the timeline. To compare the changes between two points in time, hold down the shift key and click on two points along the timeline.
If you want to view only the changes, go to the report settings and check the Show only changed Fact Sheets box.
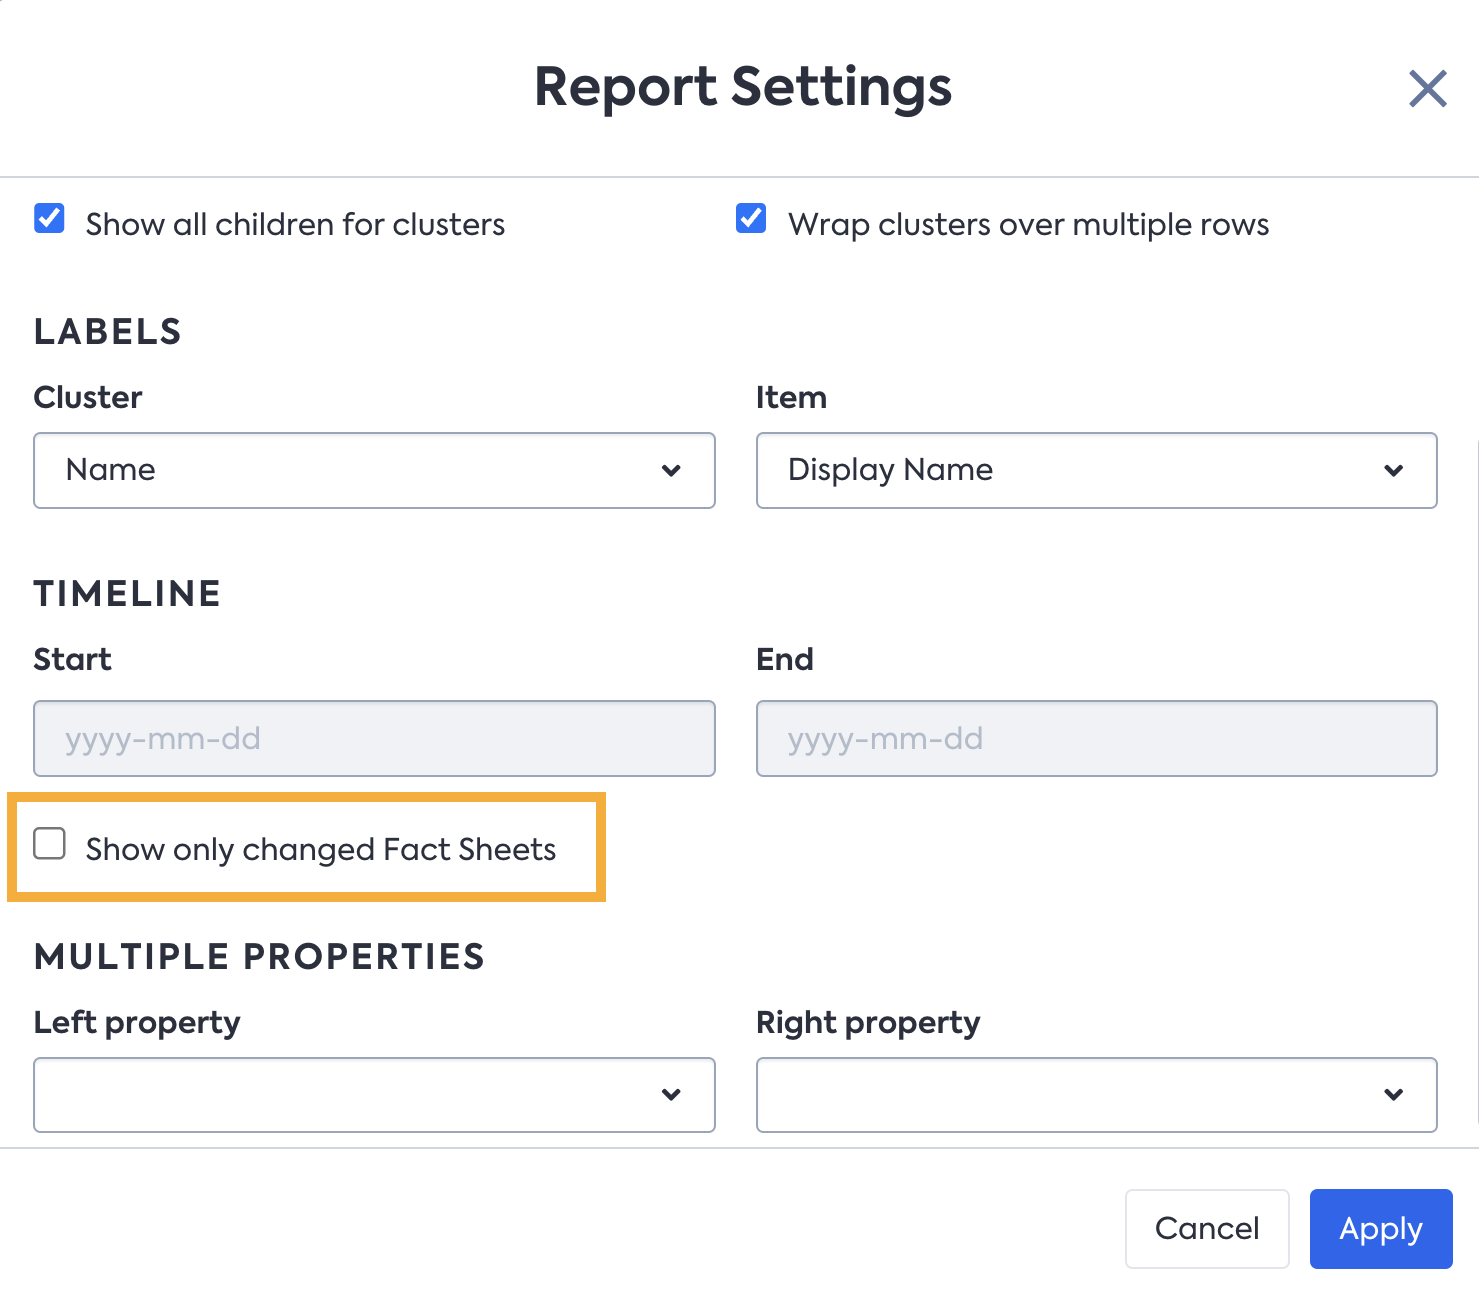
Report Setting to see only changed Fact Sheets
Roadmap Reports in SAP LeanIX Architecture and Road Map Planning
Roadmap Report gives a timeline representation of an organization's enterprise architecture elements. It visualizes the strategic initiatives, projects, and priorities that the organization plans to undertake to achieve its desired future state. It helps you monitor and manage initiatives and projects. Regular updates enable a continuous assessment of progress and identification of new opportunities to improve your organization's architecture.
For more information on Roadmap reports, including their features and guidance on working with them, see Roadmap Report.
SAP LeanIX Architecture and Road Map Planning enables you to visualize milestones of your projects in Roadmap reports, which help you keep track of your modernization plans, and ensure IT transformation is on time, scope, and budget. To learn more about Milestones, see Milestones.
Visualize Dependencies
Roadmap Reports play an important role in understanding dependencies within your transformation projects. The dependency lines featured in the roadmap highlight relationships between projects, such as ‘Requires’ / ‘Required by’ and ‘Blocks’ / ‘Blocked by.’
- Requires / Required By: This type of dependency indicates one project requires the completion of the other to be considered complete. Both projects can run in parallel, but the required project has to be finished before the project that requires it.
- Blocks / Blocked By: This type of dependency indicates a situation where one project obstructs or is obstructed by another to begin.
The Initiative Fact Sheets display the ‘Requires’ and ‘Required by’ fields by default. However, to make the ‘Blocks' and 'Blocked by’ fields visible, you need to move them from the 'Unused Fields and Relations section' through Fact Sheet configuration. For details, see Unused Fields and Relations.
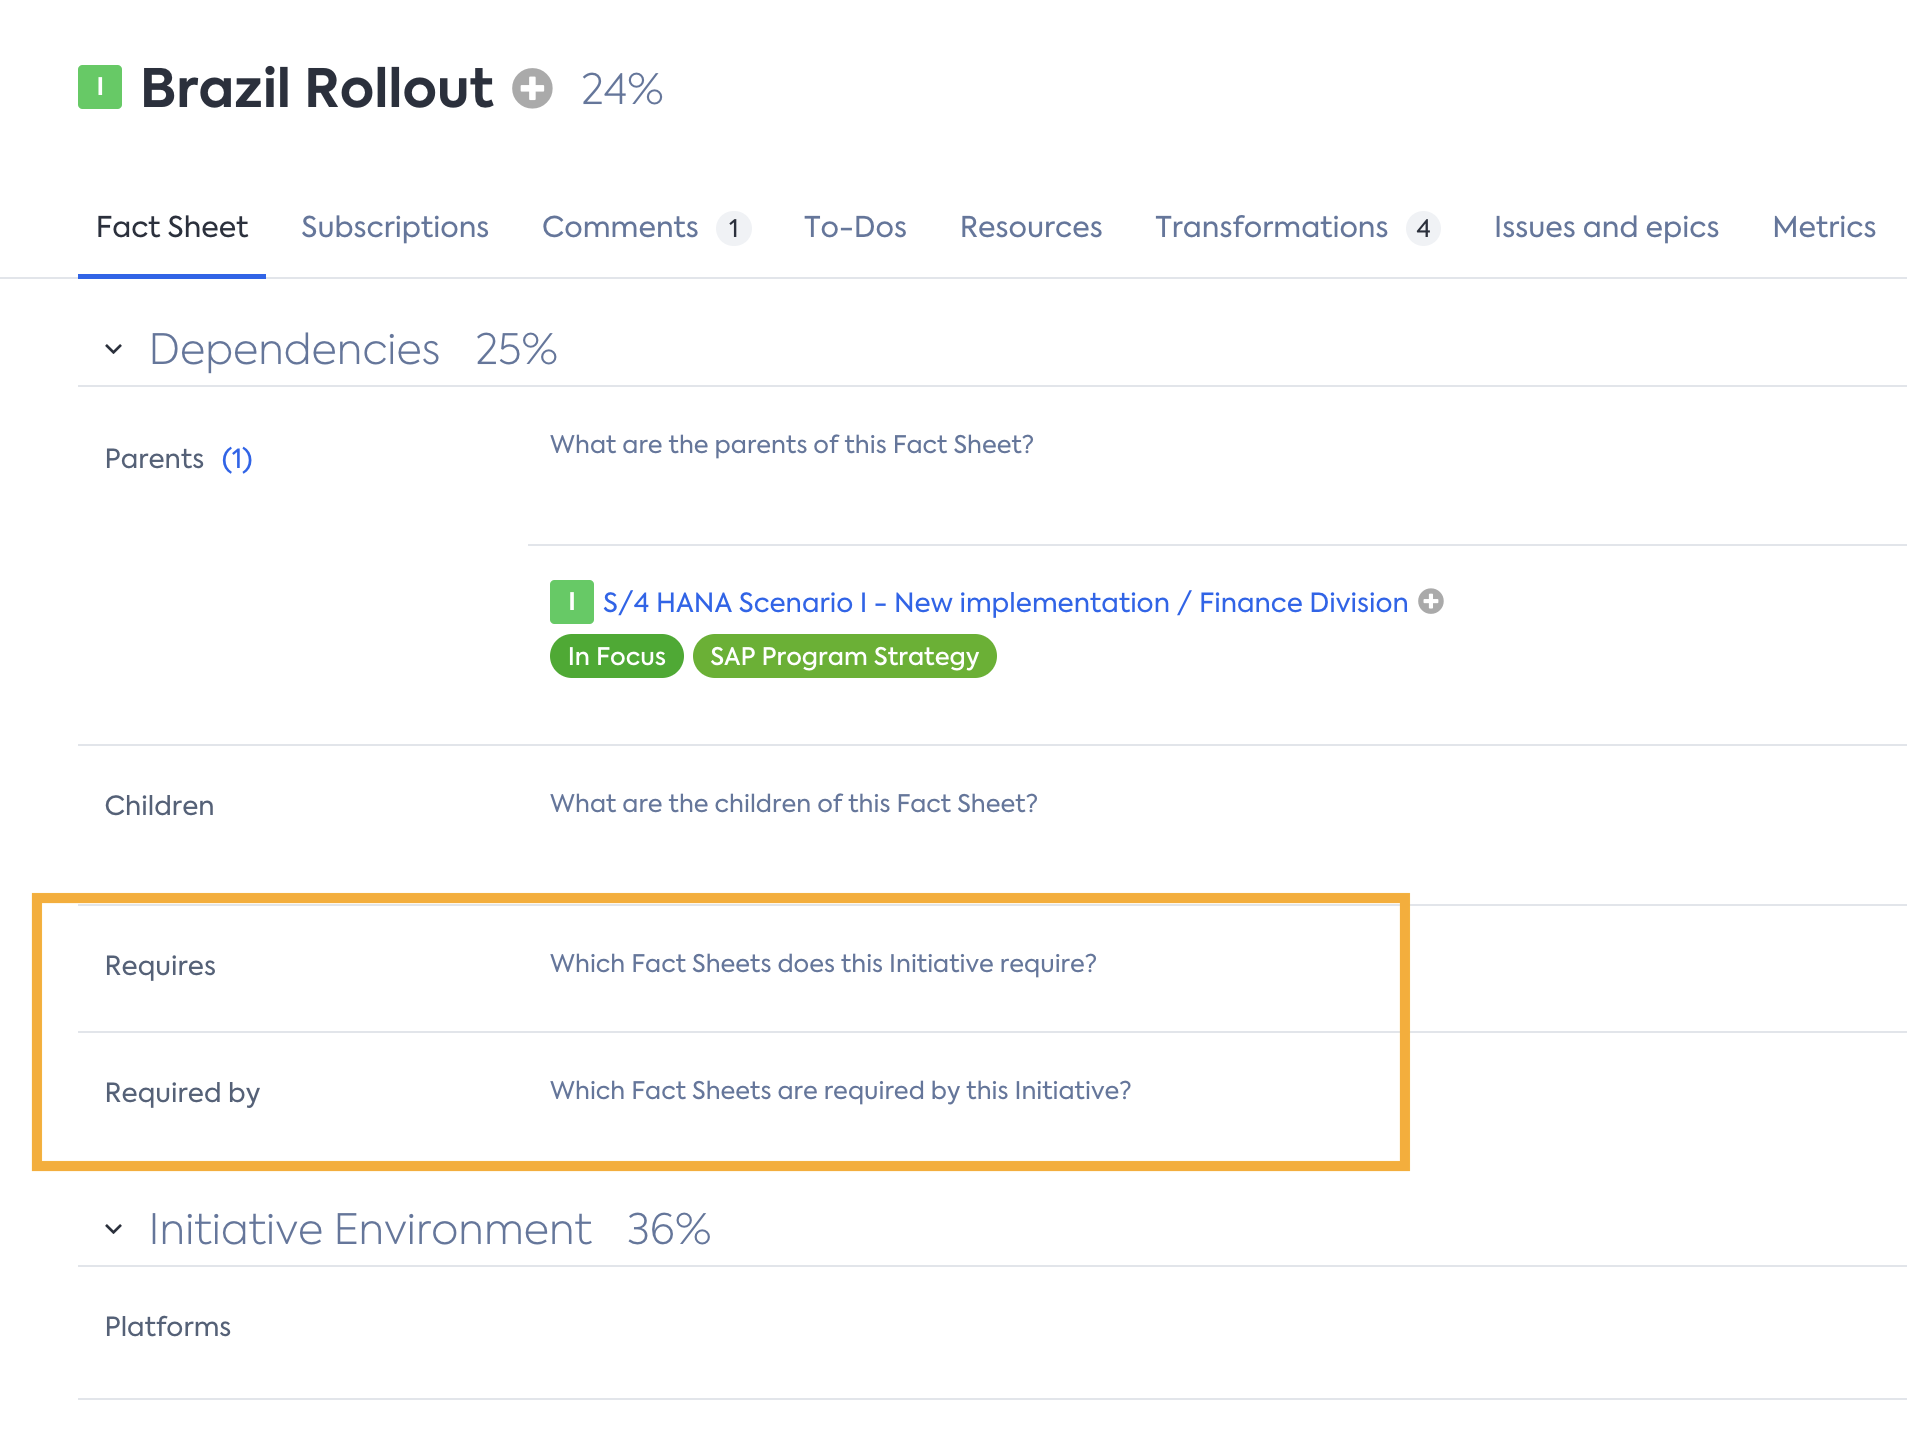
Modeling dependencies in Initiative Fact Sheet
In the Roadmap reports, the 'Requires / Required by' dependencies are displayed via an end-to-end line. If the dependency is met, the line will be grey. If the dependency is not met, the line will be red.
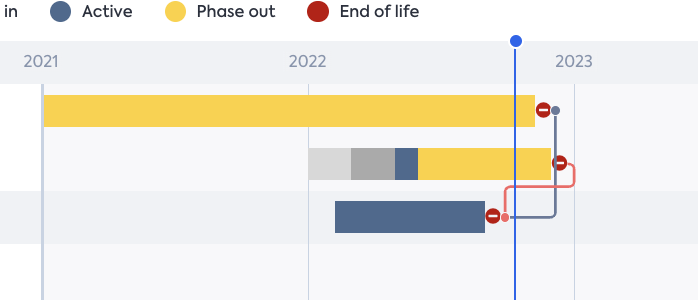
'Requires / Required by' dependencies
The 'Blocks’ / ‘Blocked by’ dependencies are displayed via a start-to-end line. If the dependency is met, the line will be grey. If the dependency is not met, the line will be red.
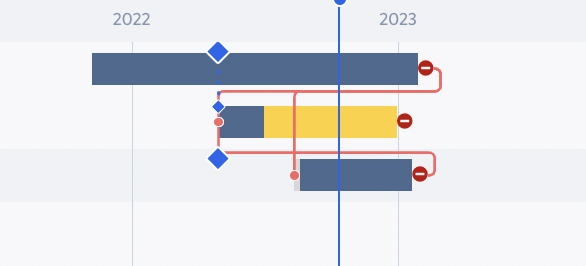
'Blocks’ / ‘Blocked by’ dependencies
Updated about 2 months ago