
Using Reports
Using reports in SAP LeanIX is a straightforward process that can provide valuable insights and analytics on your organization's IT landscape. Here are the steps to create, customize, and use reports in SAP LeanIX:
Accessing Report
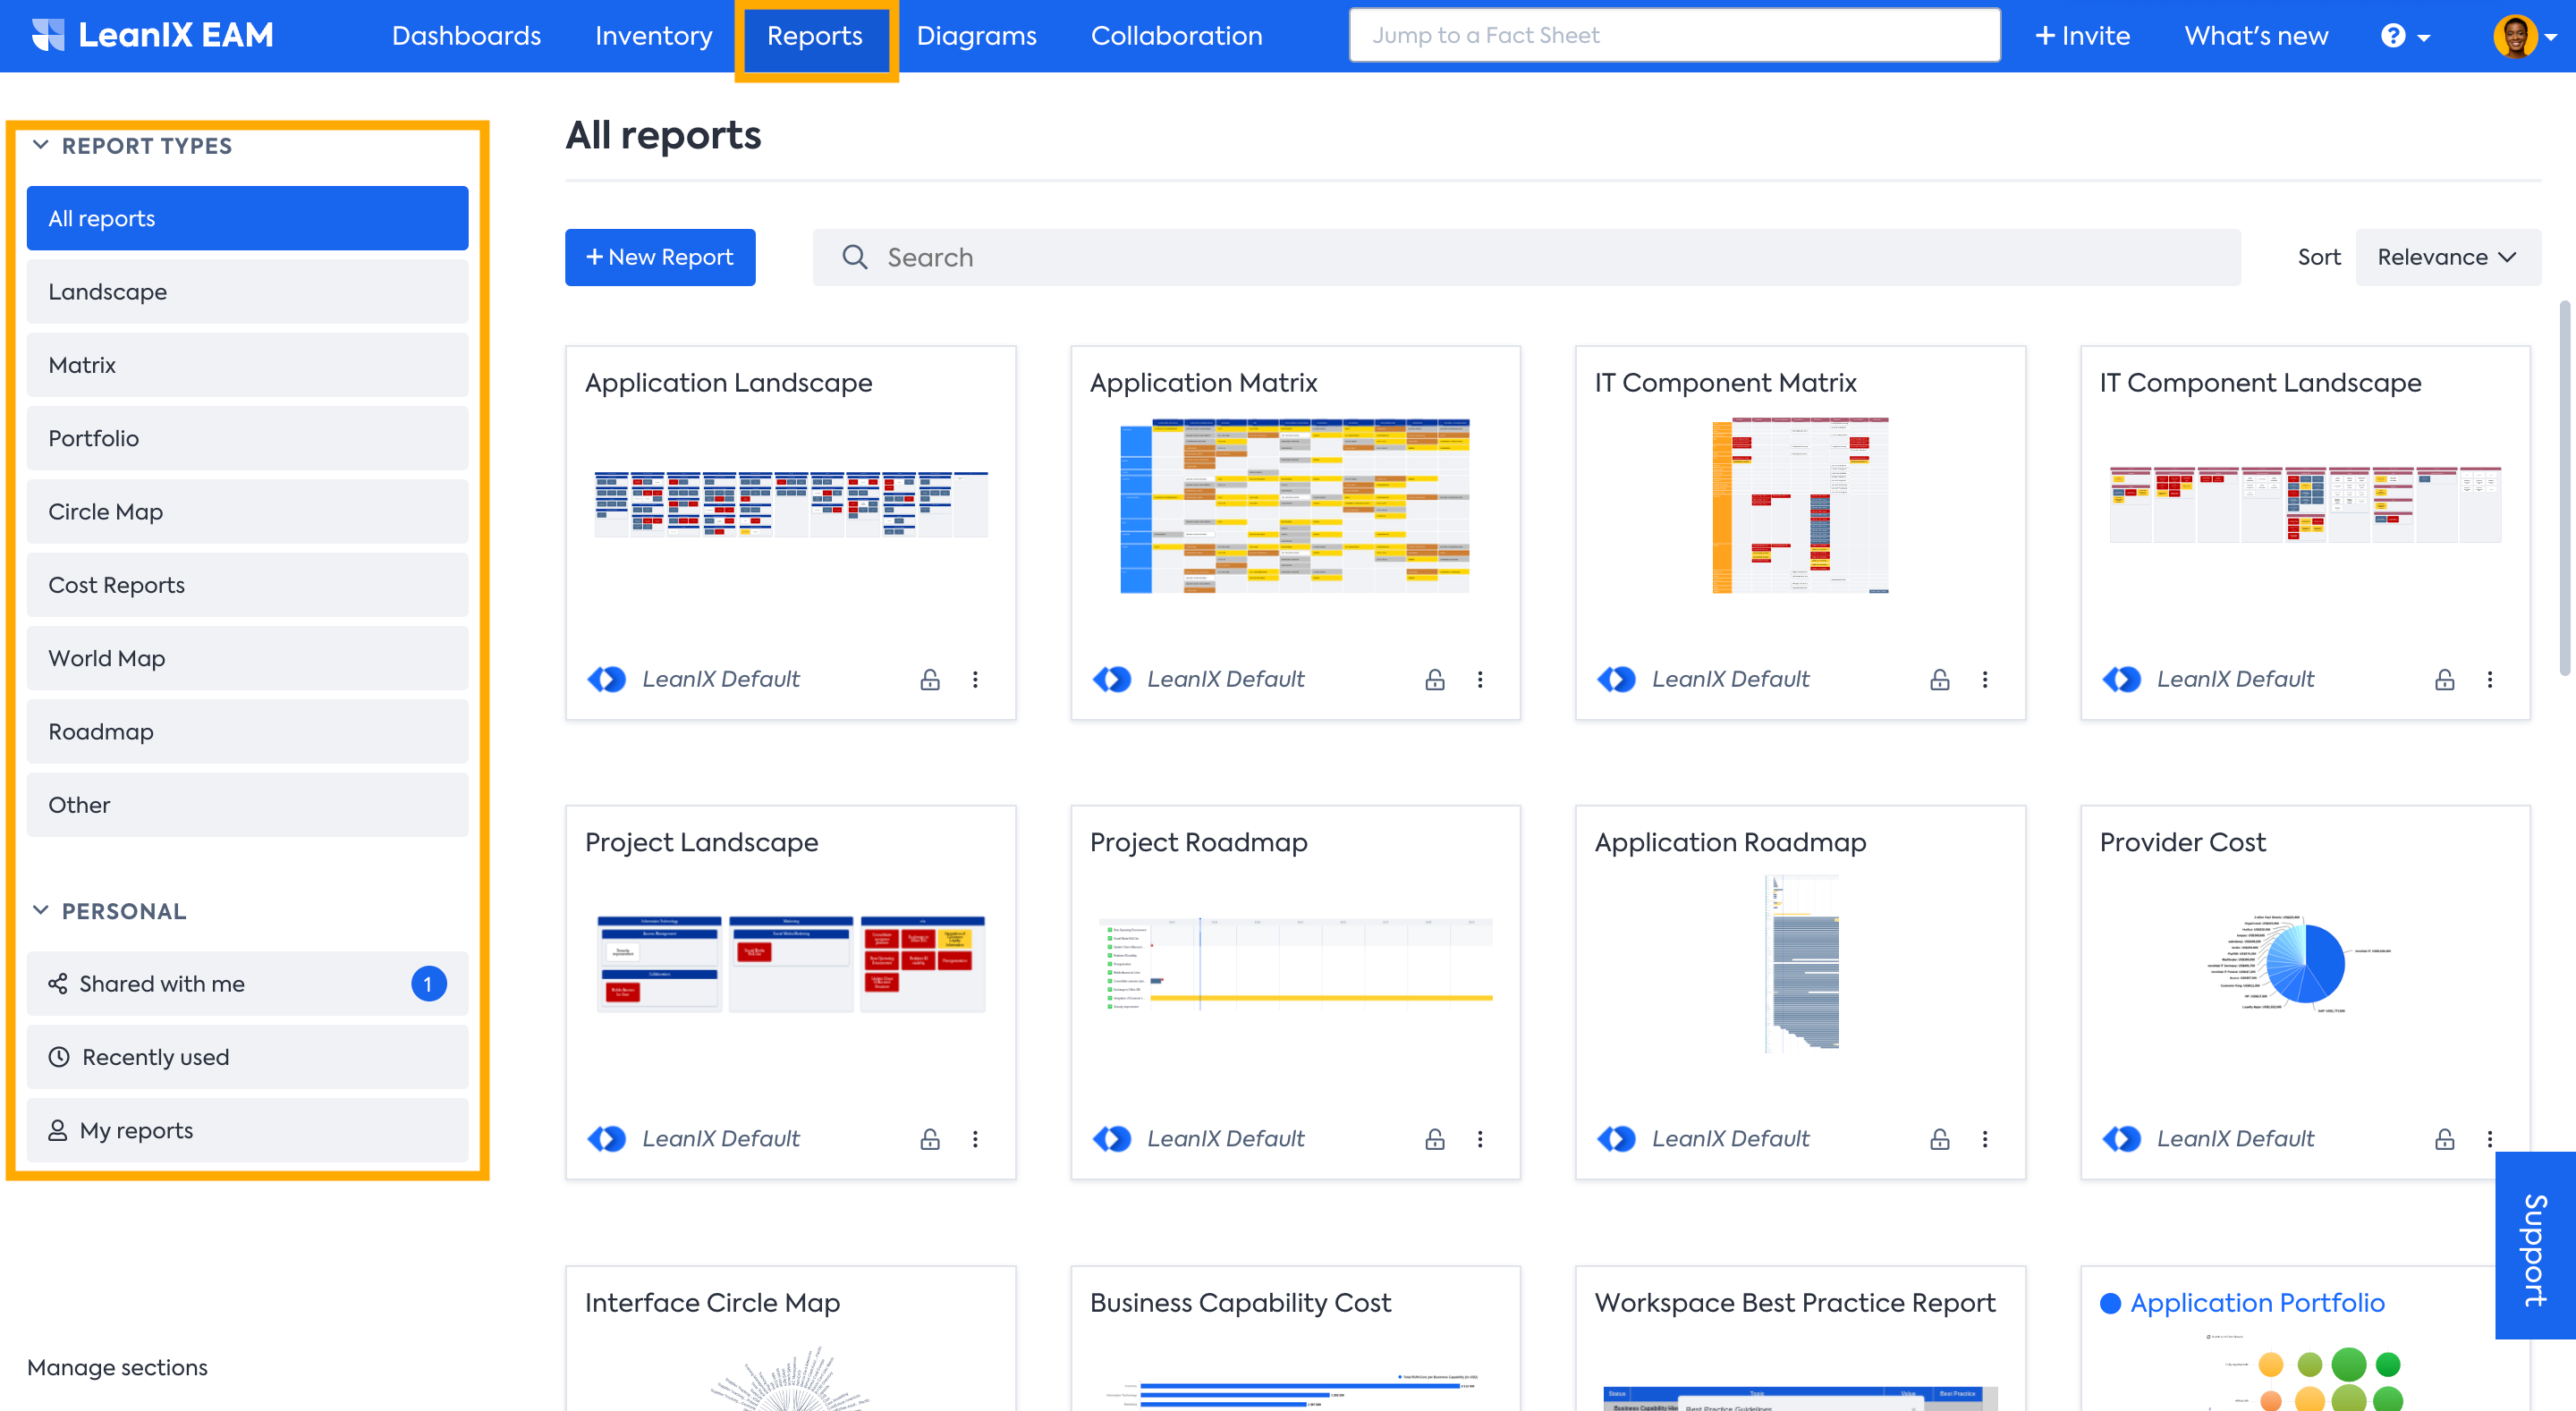
To access the Reports feature in SAP LeanIX from your workspace, simply click on the Reports tab at the top of the page. You'll find various report types on the left pane for easy access. Admins can create Collections to efficiently organize and group reports in the left navigation panel, introducing individual categories among reports and diagrams.
In the Report tab, you can view an overview of all your available reports. You can also search for a particular report type or access reports you've created.
Using Report
As all SAP LeanIX Reports are interactive, you can create your custom reports by making use of various features such as:
- Apply Filter
- Adjust View
- Clustering
- Apply further report-specific configuration
Apply Filter
For all Reports, the same filter functionality is available as in the Searching and Filtering in the Inventory. You can use the filter bar on top or filter facets on the left-hand side, which becomes visible when you move the mouse pointer to the left side of the window.
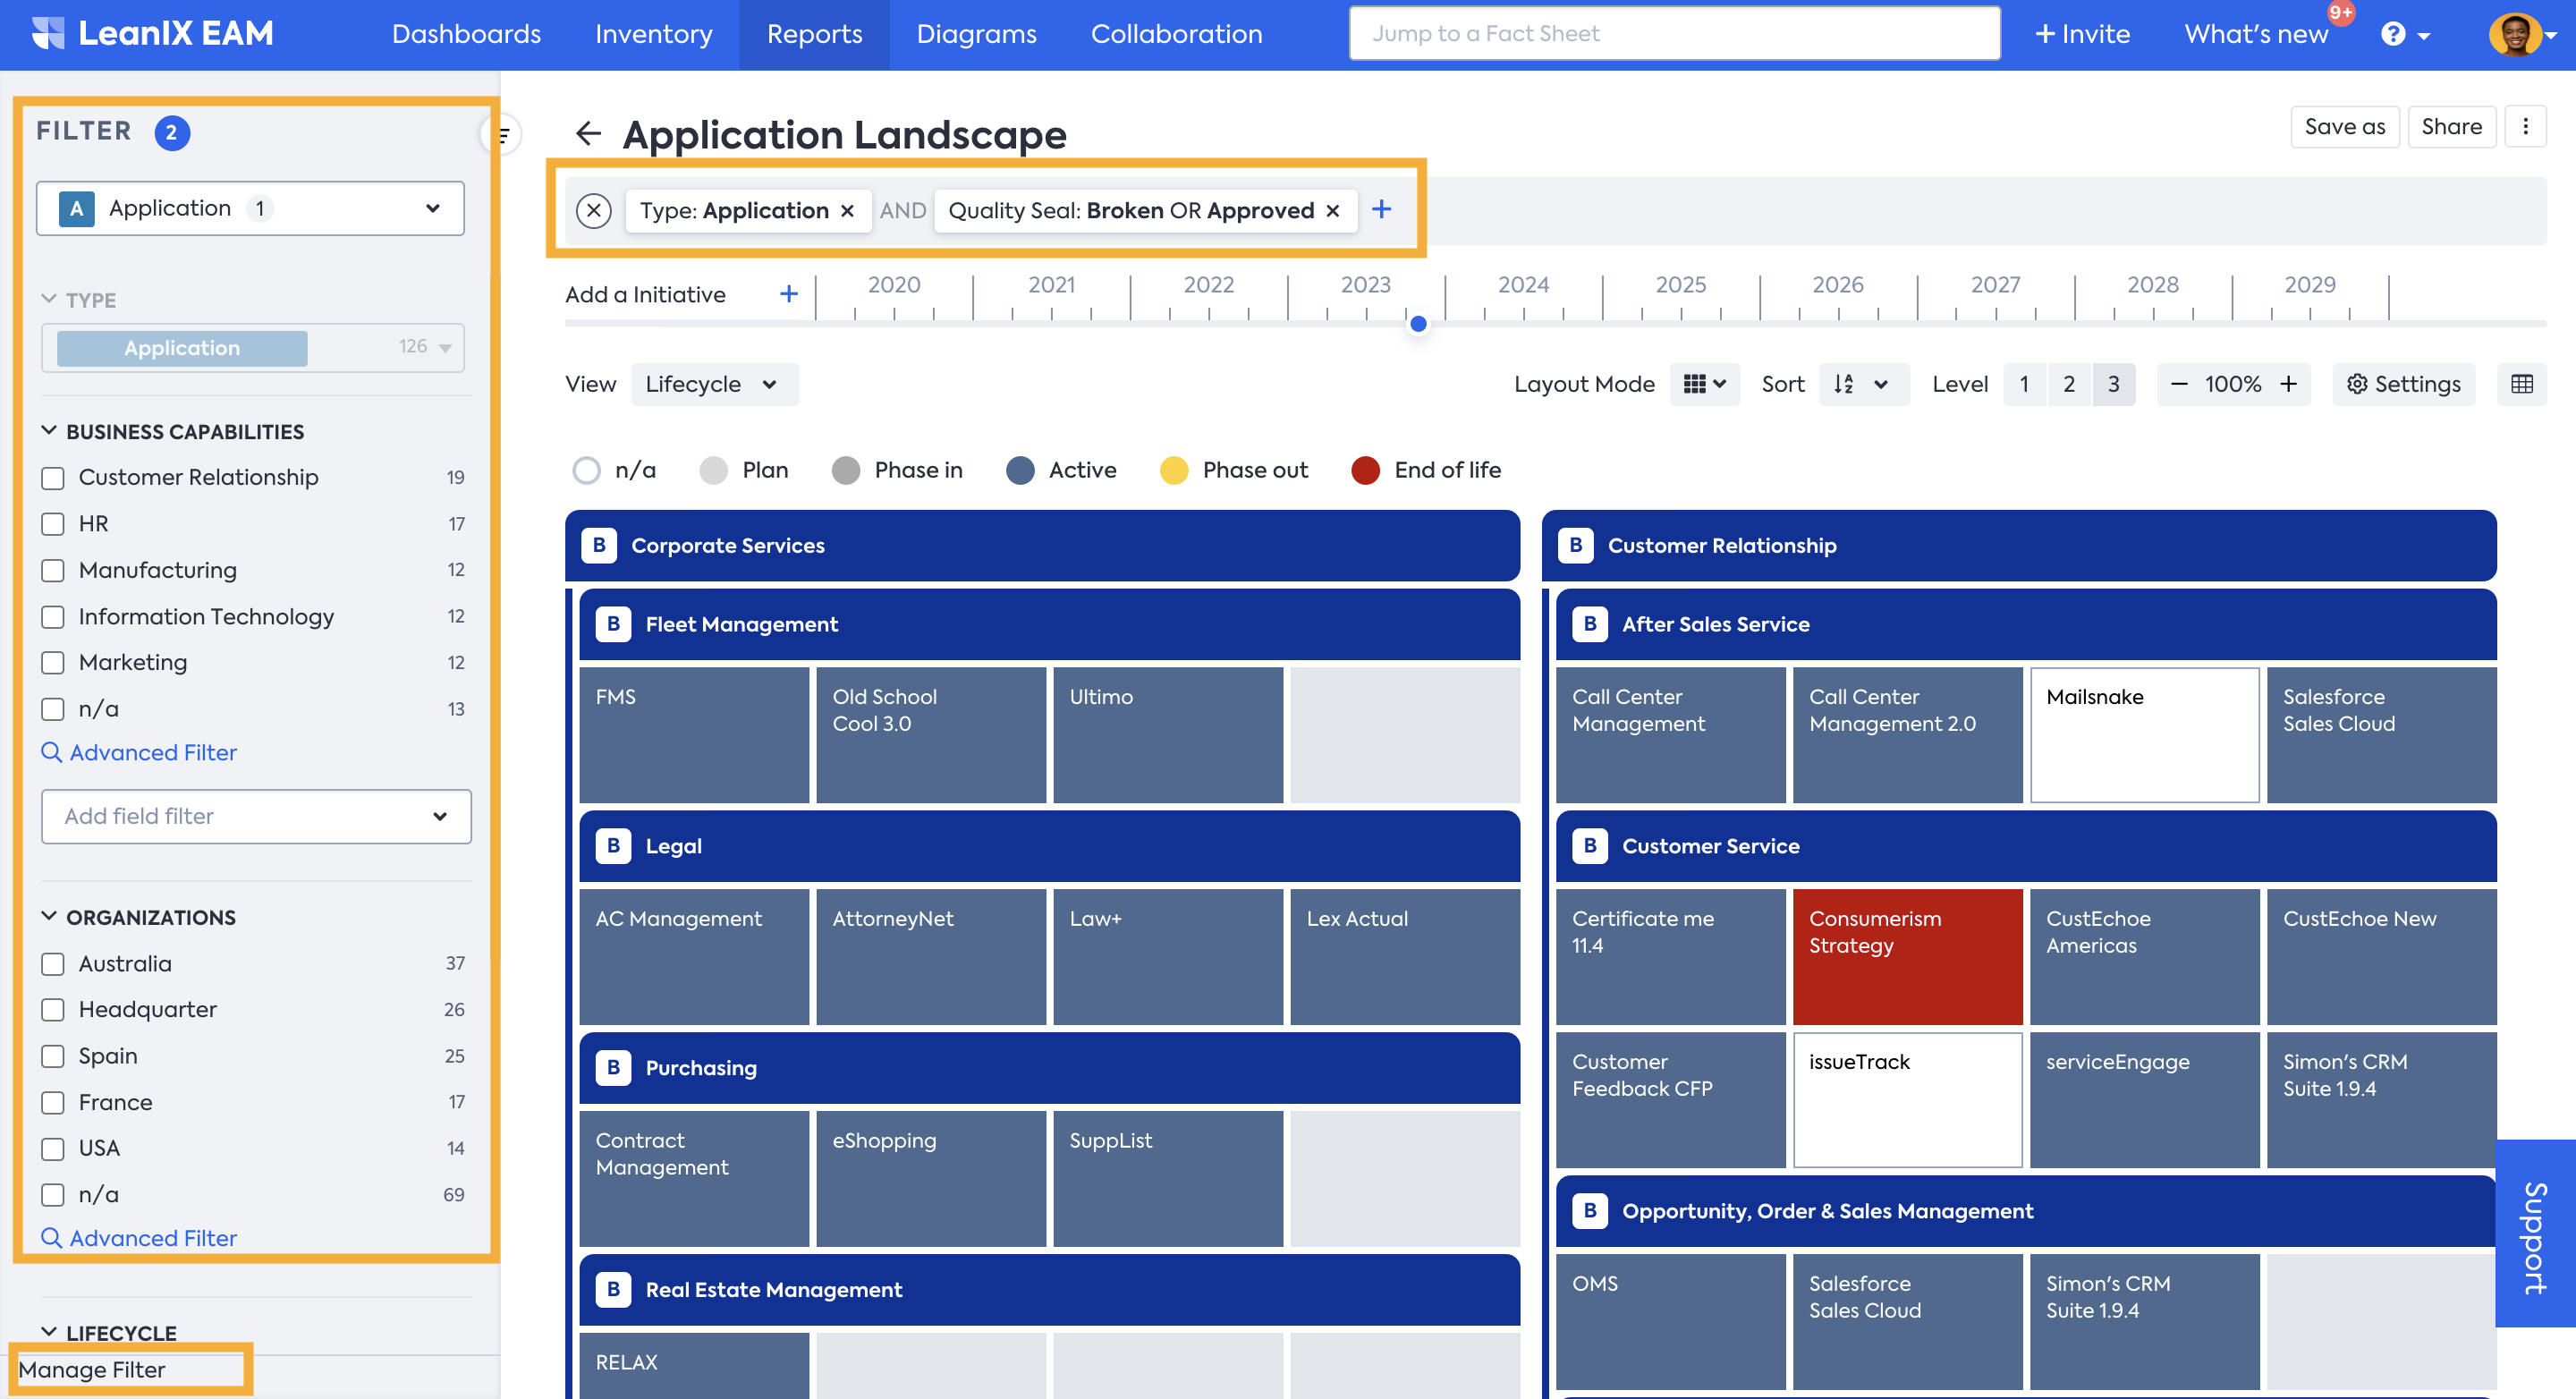
The filter facet displays relevant filters tailored to the report type. For additional options, you can access Manage Filter, where you can add more filter criteria to the panel.
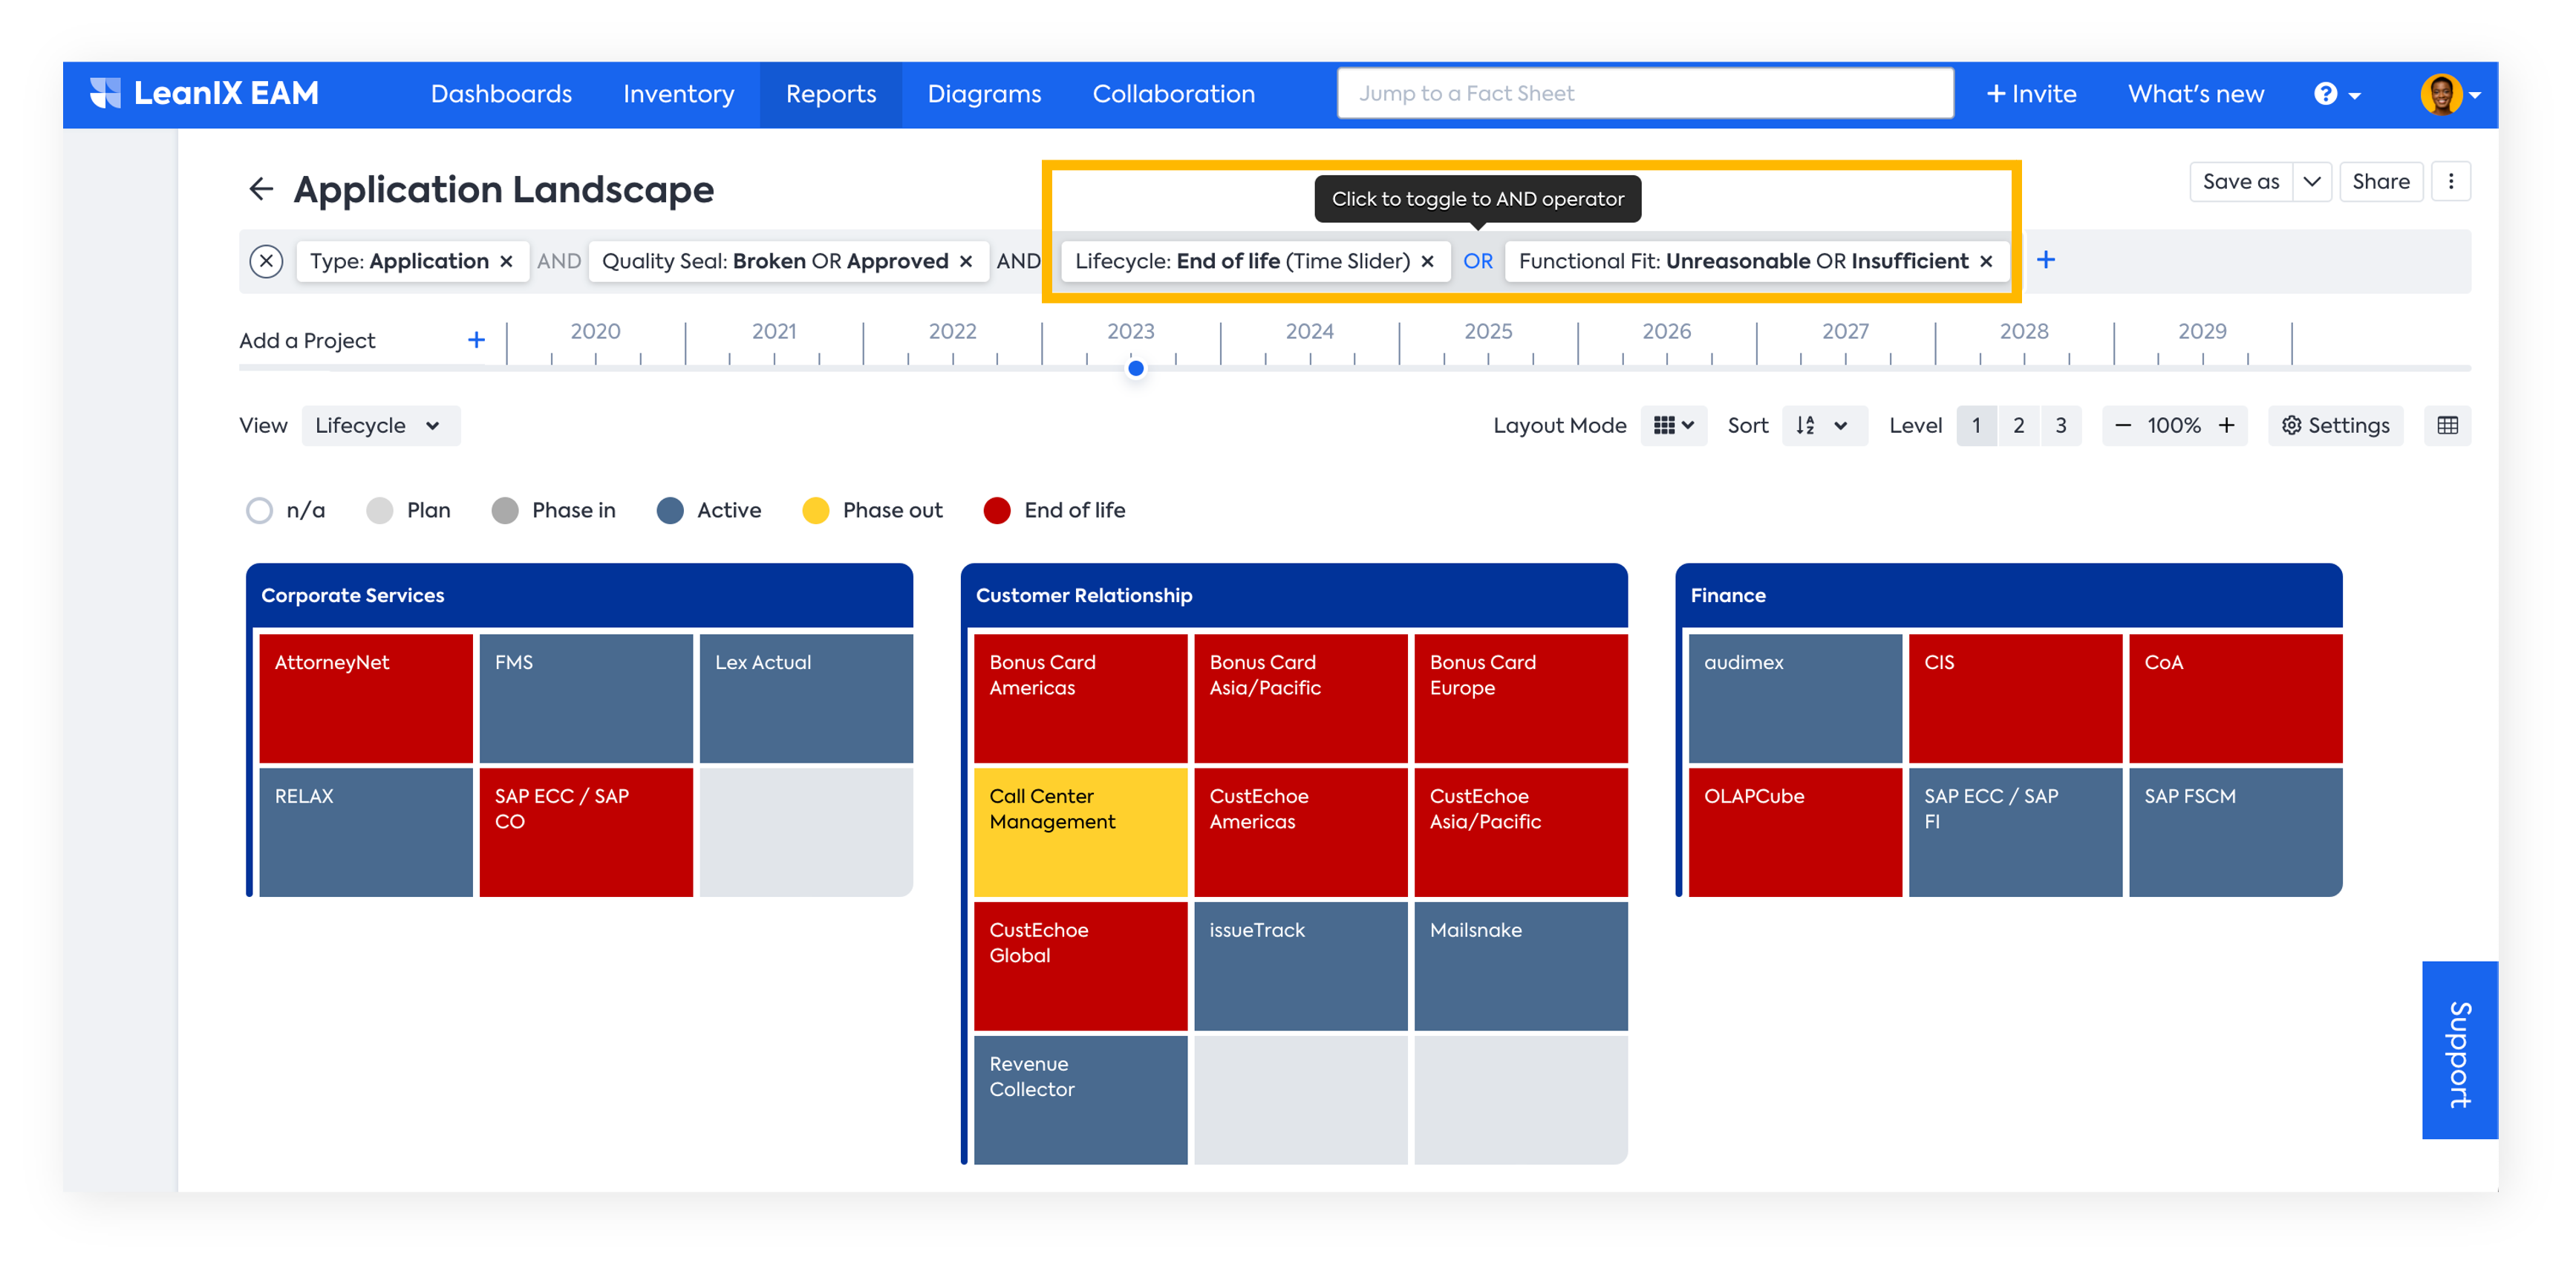
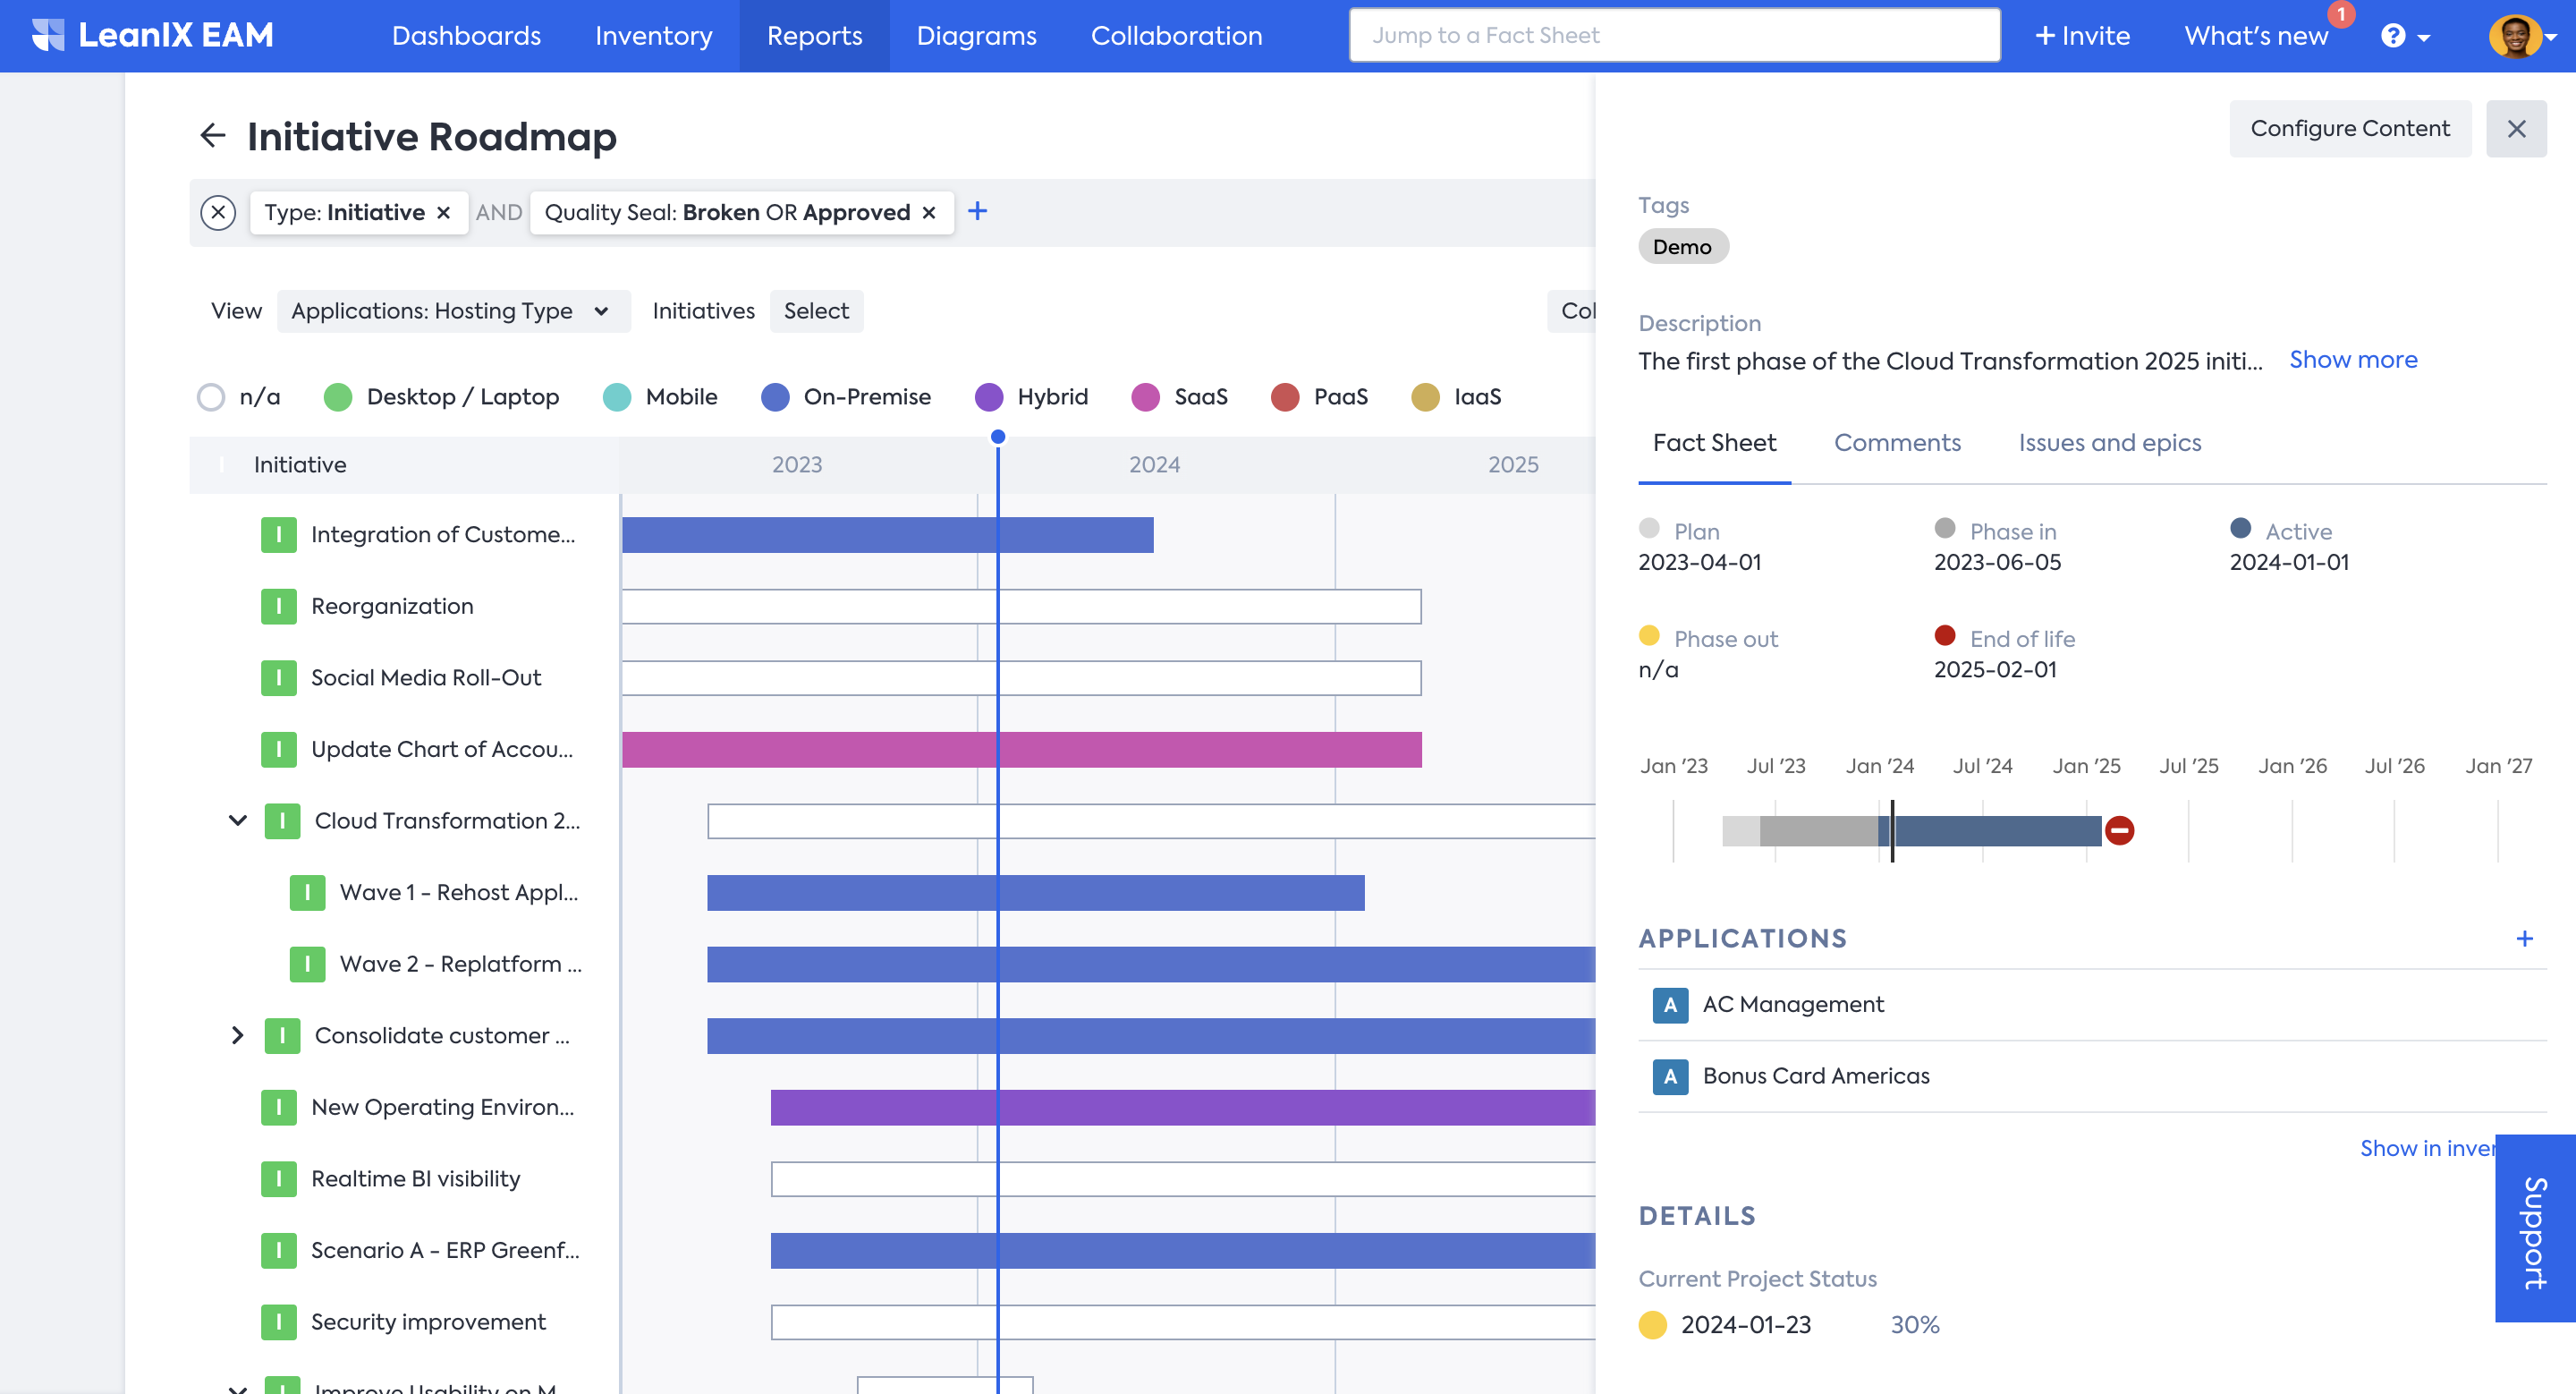
You can make use of the 'OR' operator in your filtering to exclude things from the result. The 'OR' operator in SAP LeanIX reports enhances filtering flexibility, enabling more customized reports. This feature is accessible in out-of-the-box reports such as Landscape, Matrix, Portfolio, Roadmap, and Interface Circle Map. It will also be available for the Inventory filters in 2024. To use it, apply filters as usual and toggle between 'AND' and 'OR' in the smart search bar, as illustrated in the below picture.
Information
Please note that when an 'OR filter is applied, the Show in Inventory function will be disabled, and you will be notified. This limitation is due to the unavailability of 'OR' filters in the inventory at the moment.
Apply View
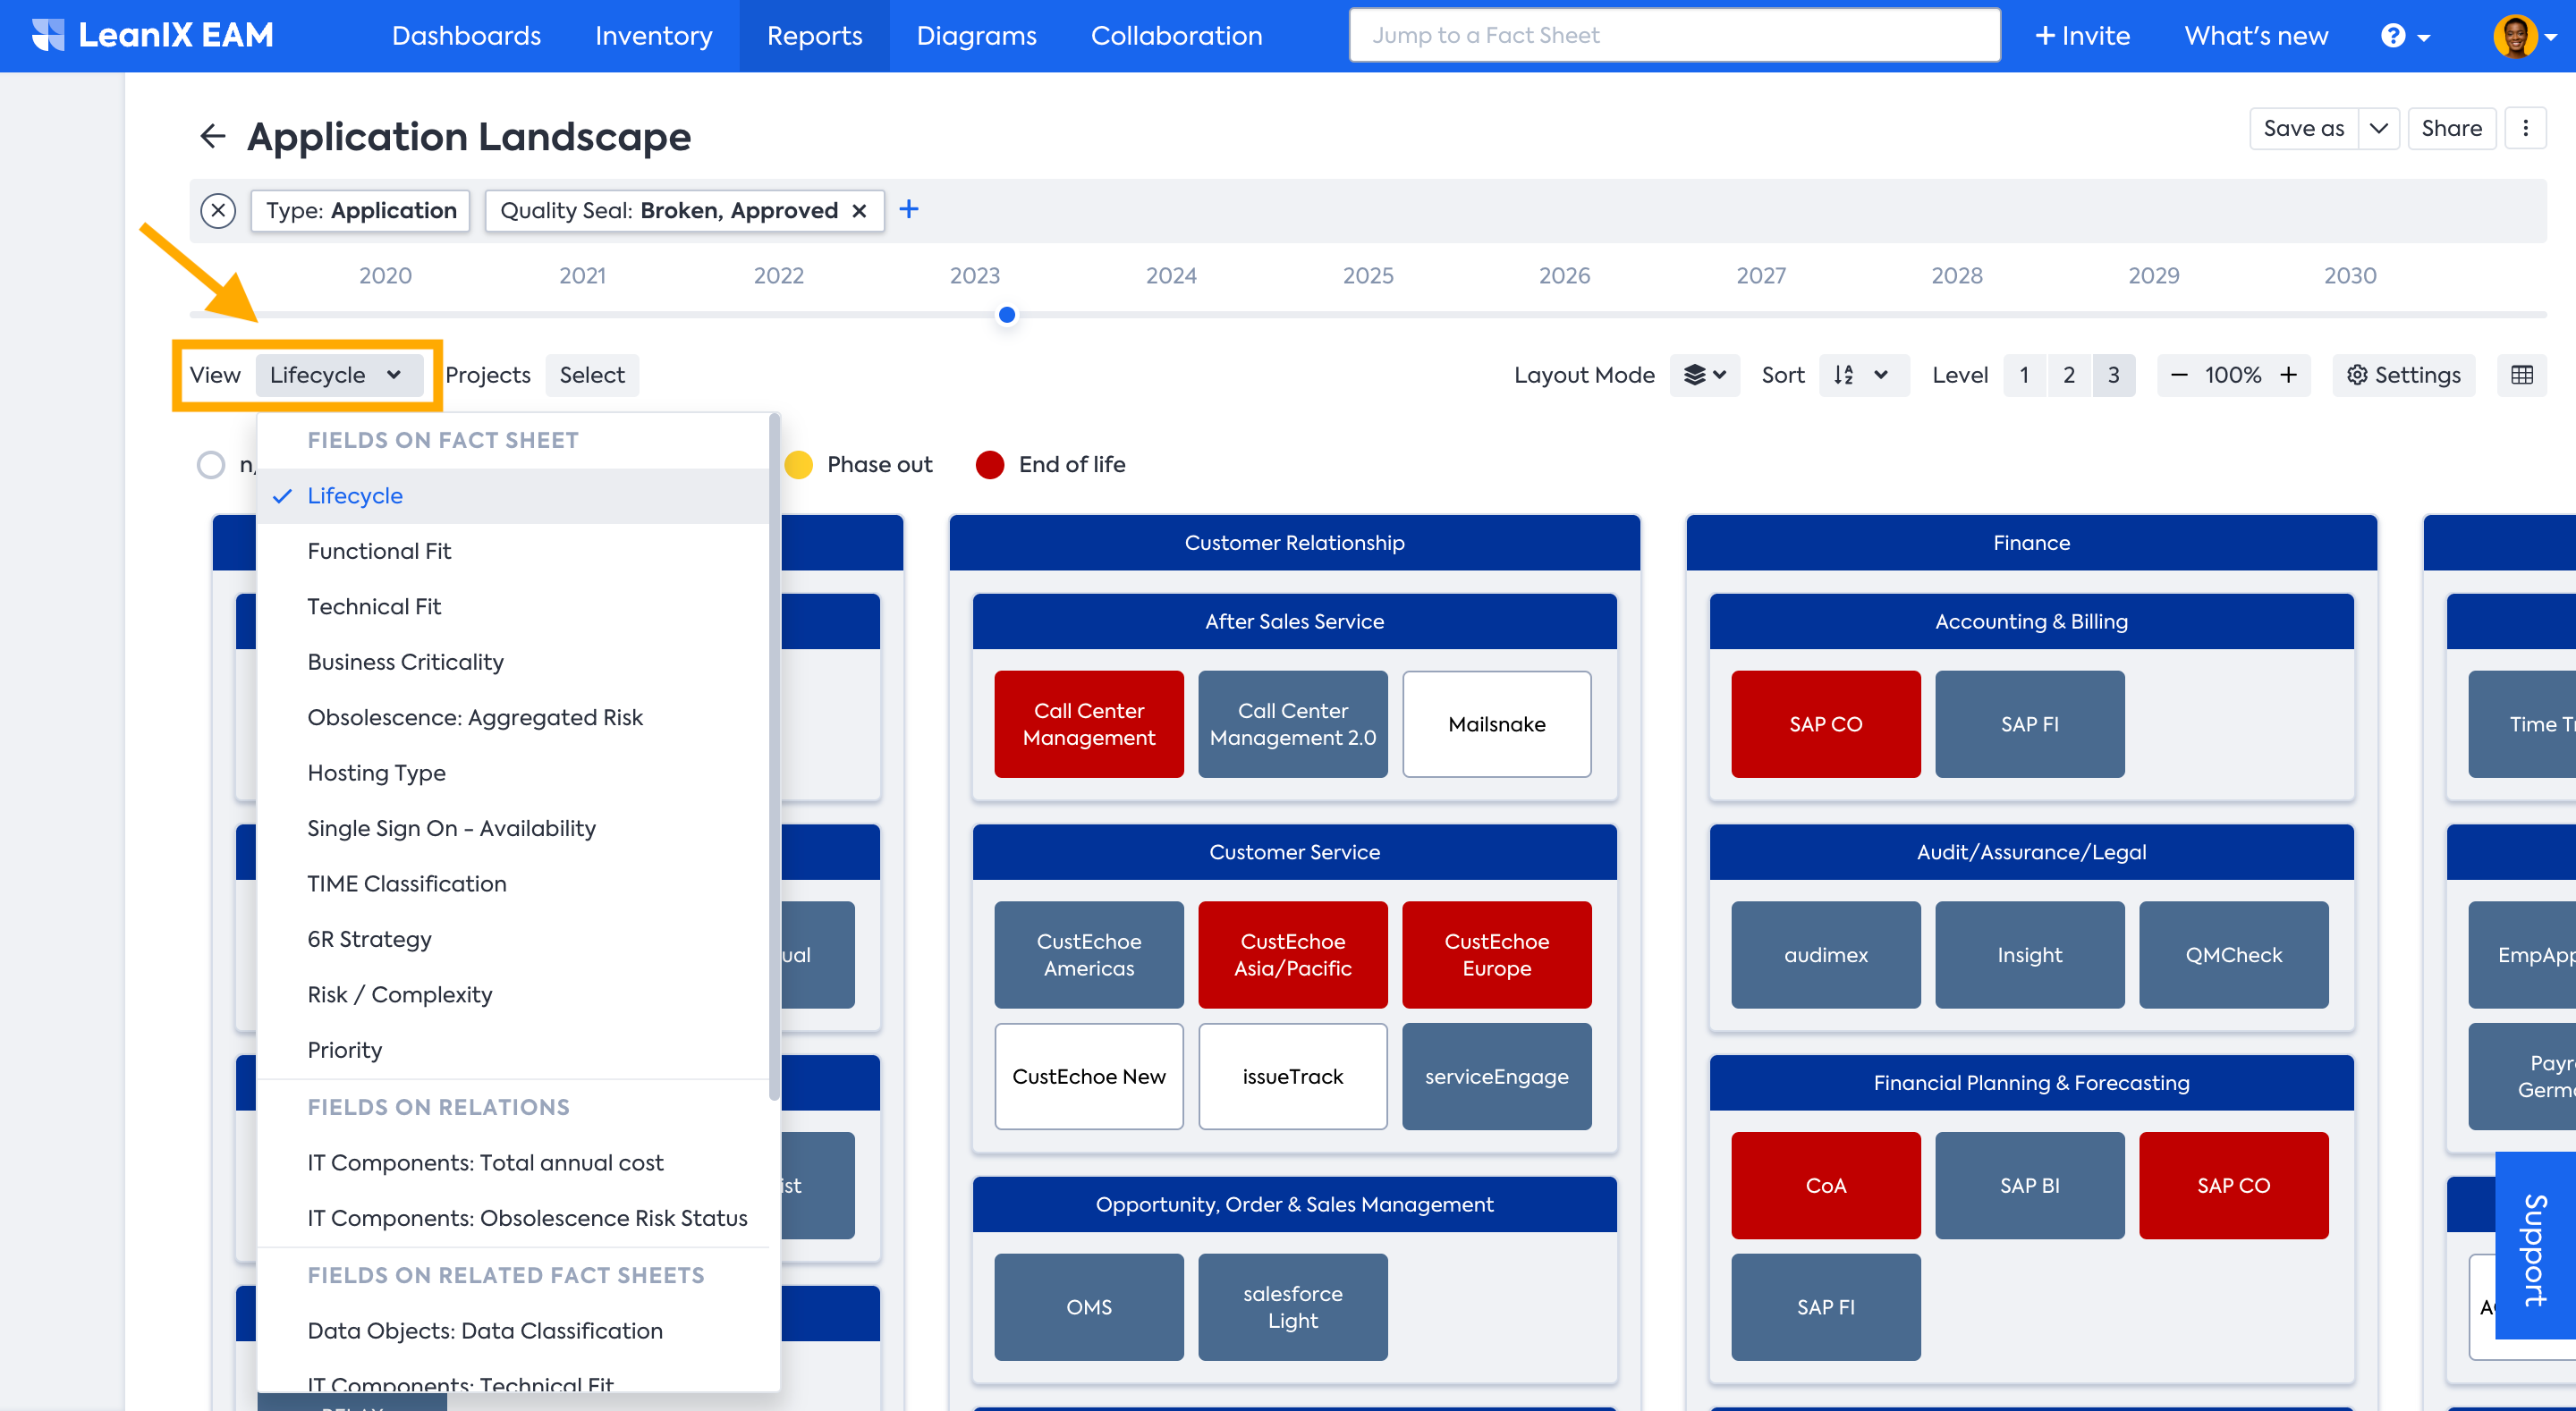
You can select from a range of distinct views when generating a report. Views are essentially attributes or relations represented through a color-coded visualization. Each view offers a distinctive viewpoint on the data, allowing users to obtain more comprehensive insights. Views can be derived from a variety of sources, including fields on Fact Sheets, fields on relationships, fields on related Fact Sheets, and tags. For further information regarding the significance of views, refer to the documentation on Report Views.
Clustering
Clustering allows grouping of Fact Sheets based on Relations, Fields and Tags. Clustering makes it easier for you to organize and understand information. It helps you see patterns and relationships more clearly, making it simpler to grasp the structure of your IT landscape.
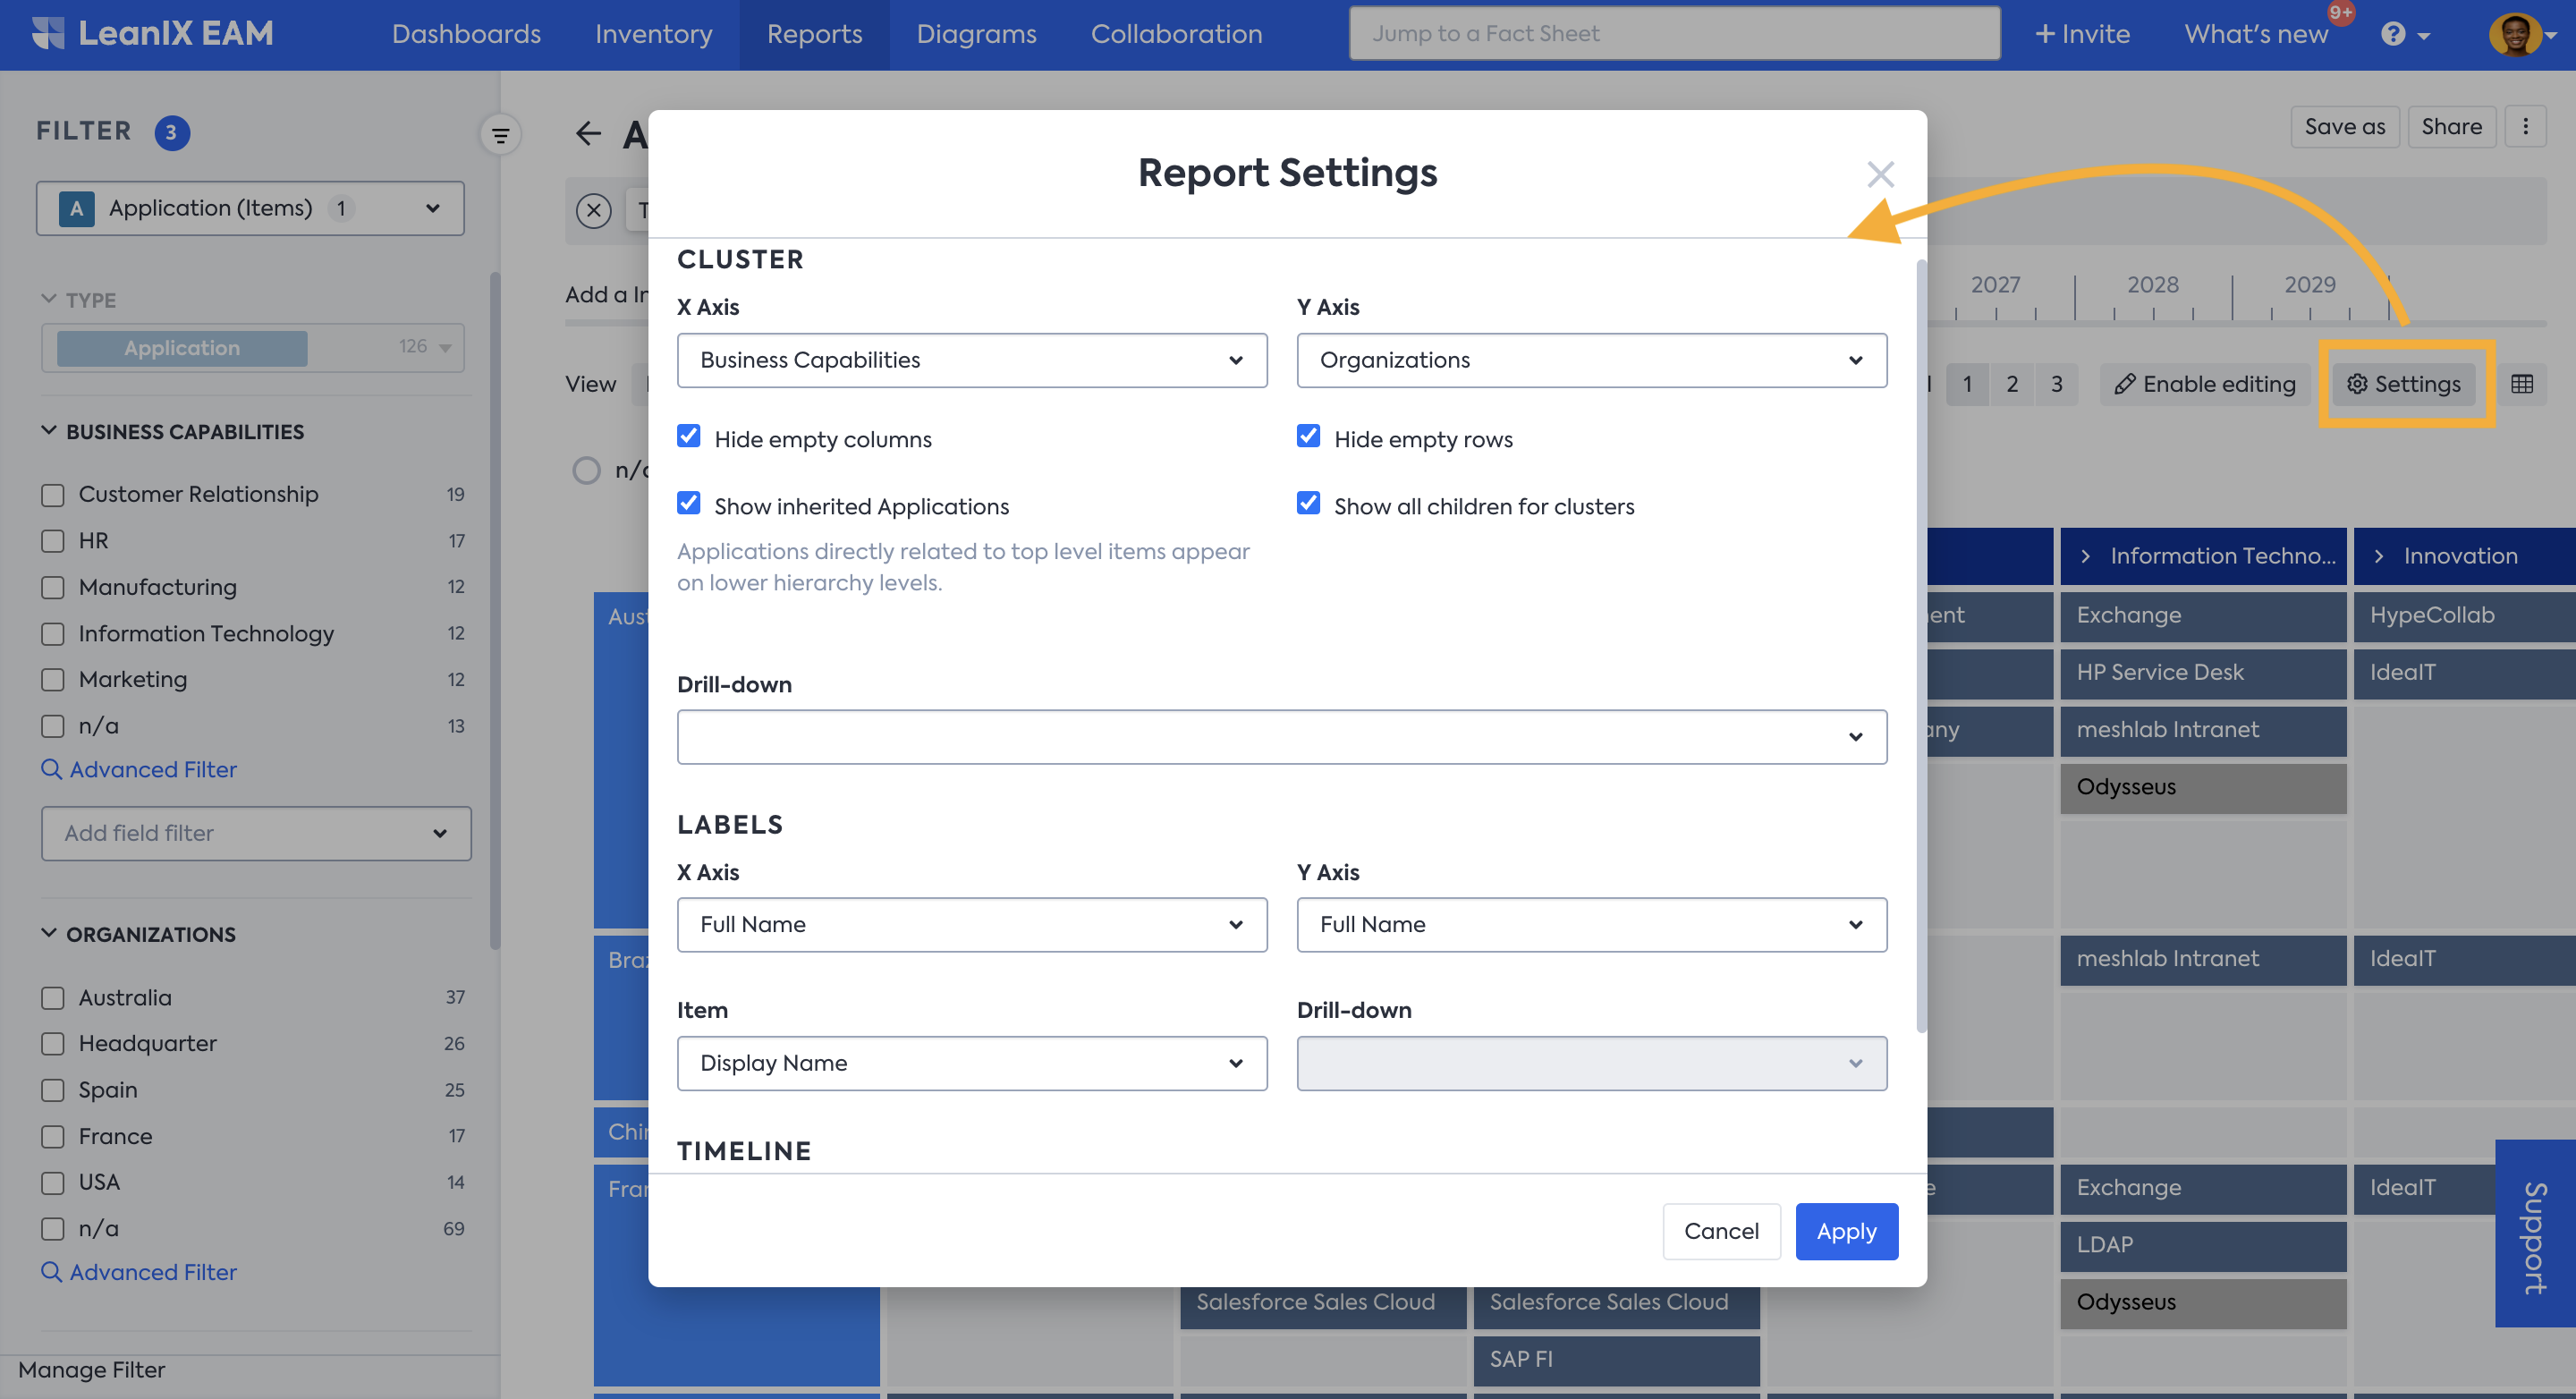
To apply clustering based on different criteria, go to Report's Settings and from the Cluster by drop down menu choose the needed criteria.
Clustering
In Landscape Reports it is possible to cluster by so-called 'self-referencing' relations: relations to subtypes of the same Fact Sheet type. That means, you can cluster by 'Children', 'Predecessors', 'Successors', and all other direct relations.
Report-specific configuration
Further configuration of reports is possible in the Reports Settings menu and is report-specific. Common configurations include clustering Fact Sheets based on a specific type, setting timeline parameters to visualize data within a specific time frame, selecting different parameters for the X and Y axes, and choosing left and right properties to display on Fact Sheet items in the report.
Note
Only single select fields can be used for clustering in reports.
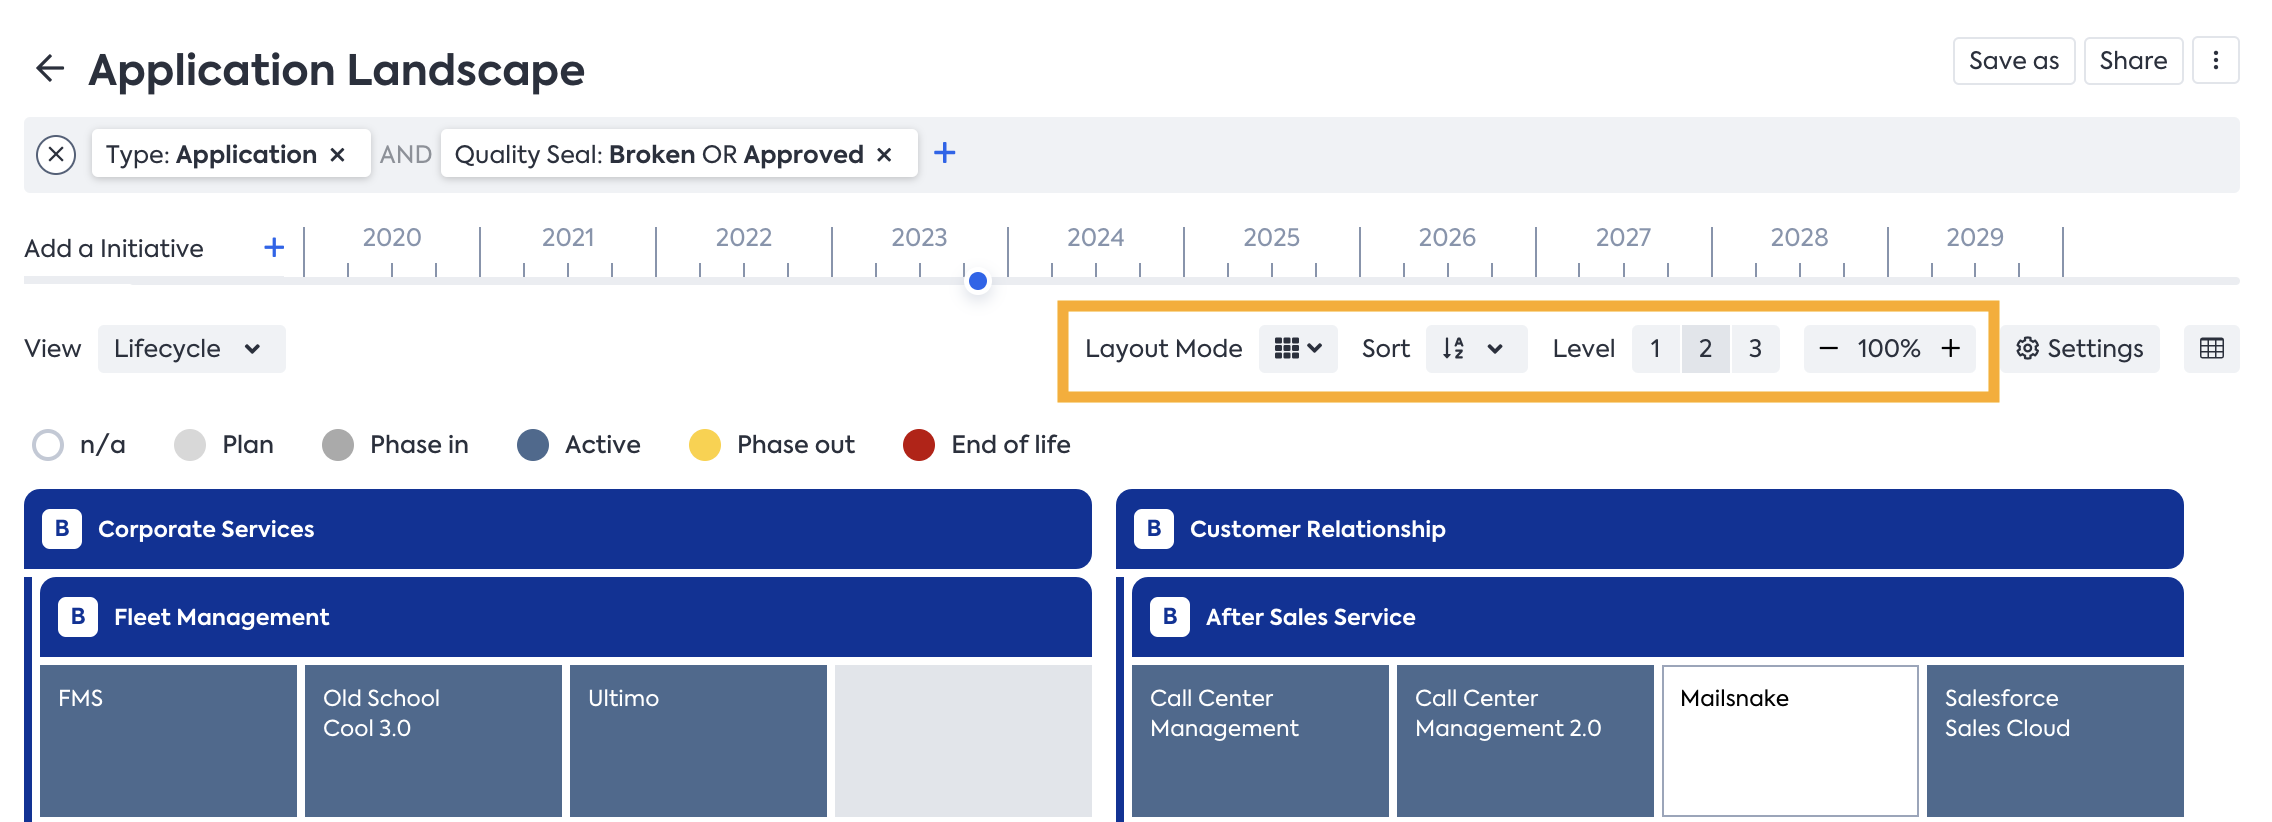
Adjacent to the Settings, there are additional choices for structuring reports effectively. You can customize the order of appearance through Sorting, specify the hierarchy level for information display with the Level option, and switch the Layout Mode of the Report between Stacked, Detailed, or Rolled-Up modes according to your requirements.
Side Panel
Clicking on any Fact Sheet in a report opens a side panel on the right. This panel gives a quick overview of essential information about the Fact Sheet. It gives you the convenience of accessing information without switching between reports and Fact Sheets.
The displayed Fact Sheet fields in the side panel depend on the chosen view. You can edit the information within the side panel by clicking on the field you want to update.
In Landscape, Matrix, Roadmap, and Circle Map reports you can also configure which fields and relations you want to be displayed in the side panel. To configure the content of the side panel, do the following:
- Click on Configure Content at the top of the side panel to open Side Panel Settings.
- In Side Panel Settings, add desired fields and relations by clicking the '+' icon.
- If you want, you can rearrange the order of added fields by dragging and dropping.
- Click Apply to see the new fields in the side panel.
- If you want these fields visible even when you open the report next time, click Save from the drop-down menu located at the top right of the report.
Configuring the side panel of the report
Your ability to configure the side panel content depends on your permissions at the report and field levels. In other words, if a user lacks permission to view or edit a specific field in the metamodel, the same restriction applies to the side panel configuration.
You can configure and see most fields and relations using the configuration panel, except base fields such as name and description, location, and multi-select fields. Also, if a field or relation is part of an inactive section in the Fact Sheet, it will not appear on the side panel.
While Project Status is a multi-select field, it is configurable, but only the Current Project Status is displayed on the side panel.
In the side panel, you can also comment and reply to comments just as you would on the Fact Sheet. Furthermore, from the side panel, you can quickly navigate to the Fact Sheet by clicking on the Fact Sheet’s name at the top.
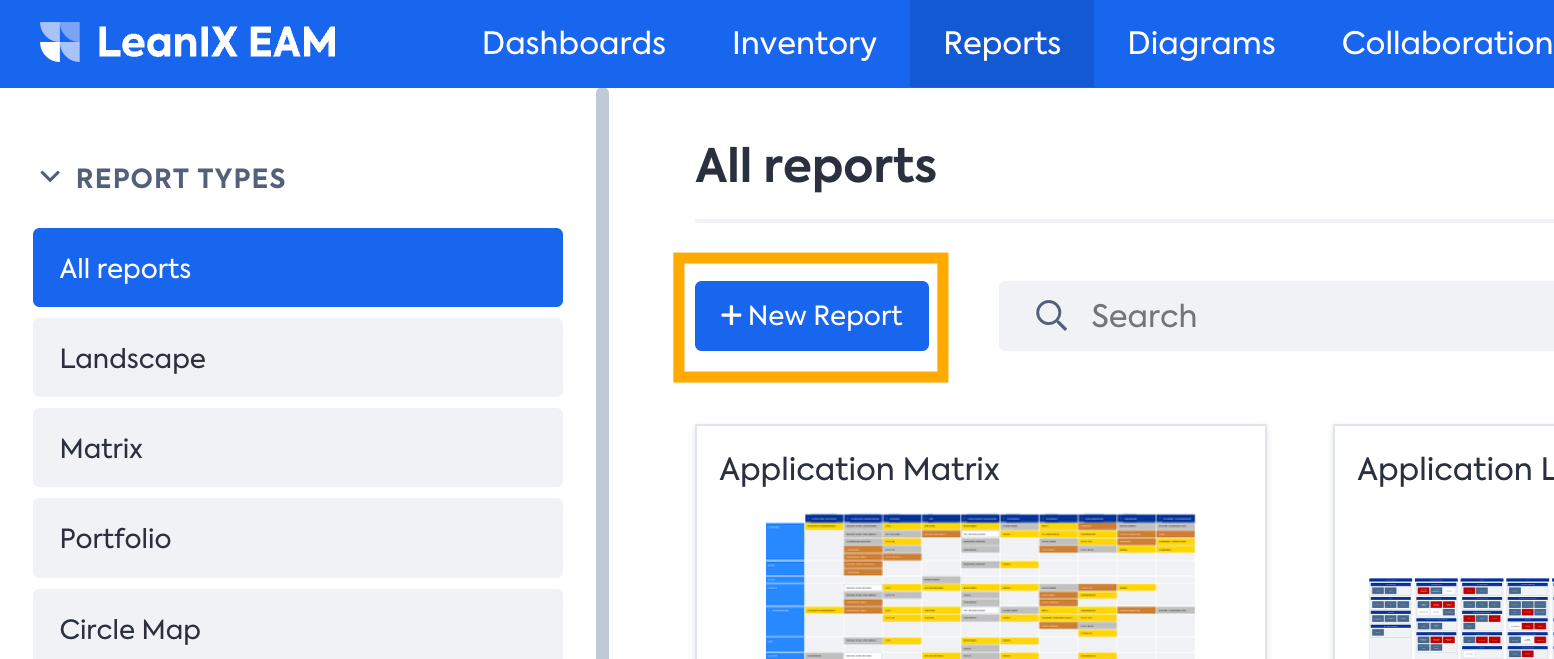
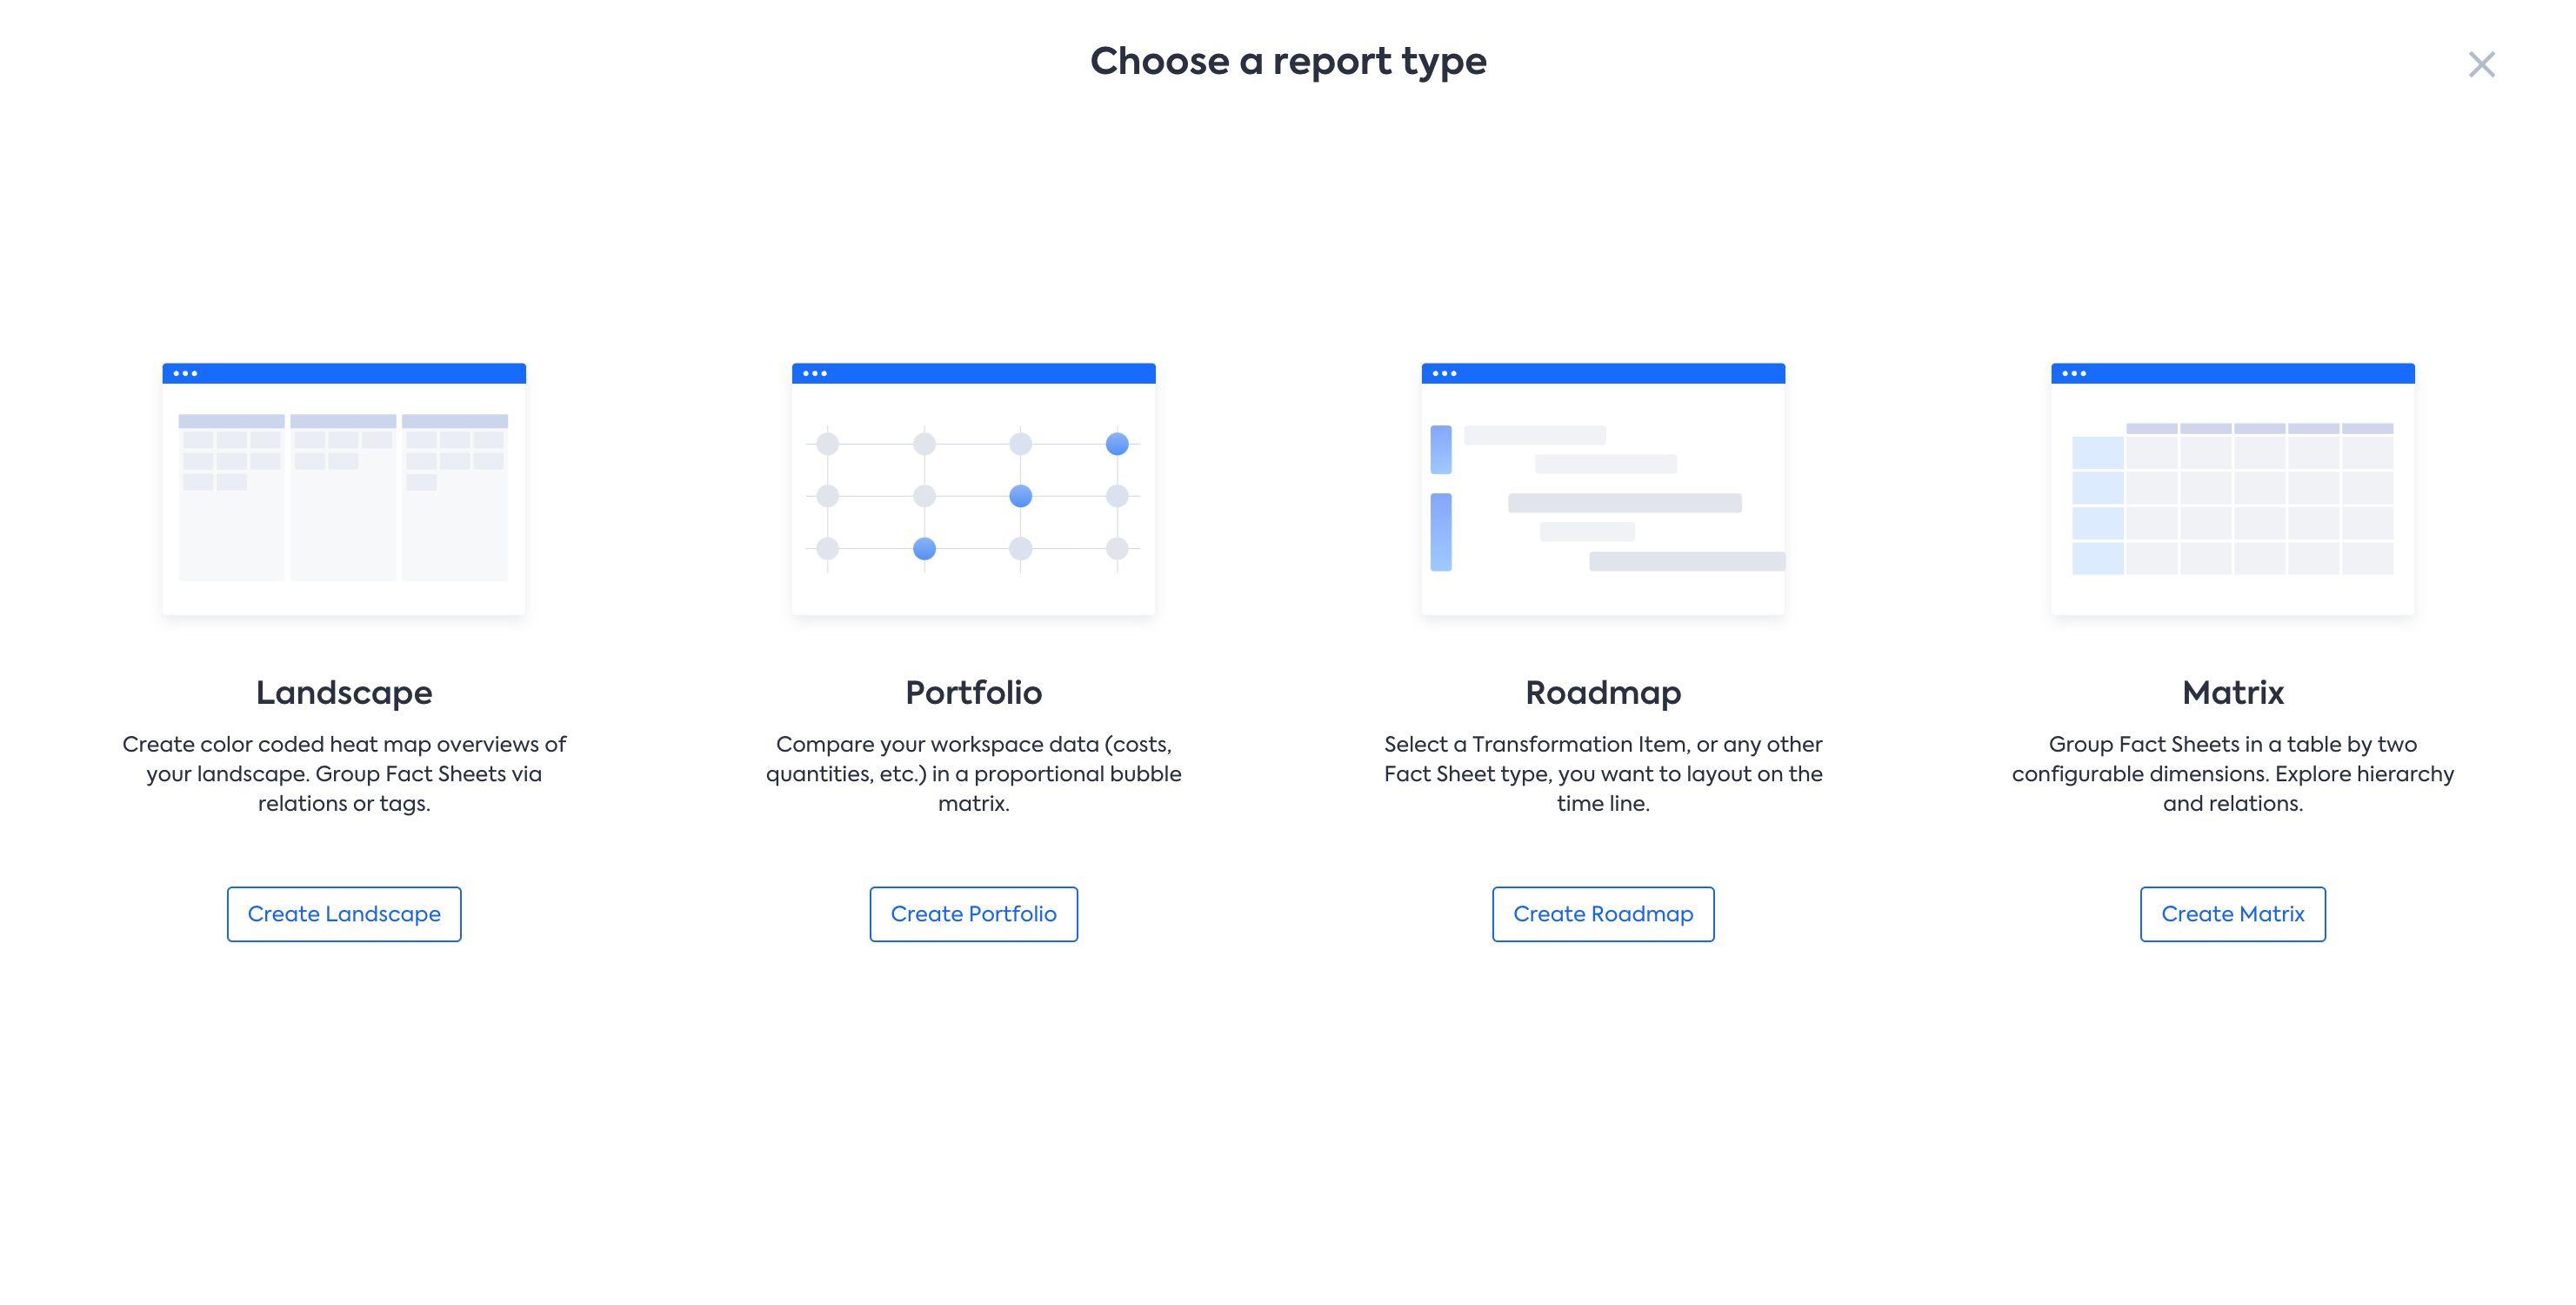
Creating a New Report
To create a new report, you can click on the New Report button and choose Report Type. You can choose from 4 types of reports: Matrix, Portfolio, Roadmap, and Landscape Report.
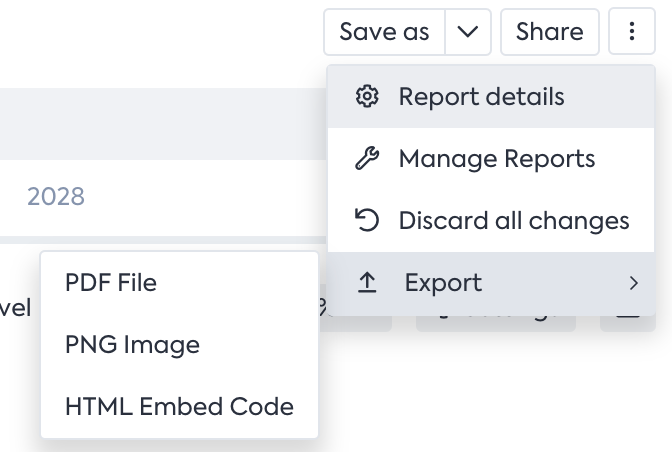
Exporting and Sharing Reports
Export and Share: Once you have customized your report, you can export it in various formats, such as PDF, PNG Image, or HTML Embed Code, and share it with stakeholders. With the HTML Embed Code, you can embed and have live data from the SAP LeanIX inside a tool such as Confluence and PowerPoint (using a Web Viewer add-ins). Admins and members can export reports. However, it depends on whether they have export permission for the fact sheet types included in the report. For more details, see Report Permissions.
Seeing Complete Data in a Report
Sometimes, one or more Fact Sheets are not included in Reports due to missing data. Does this message look familiar?
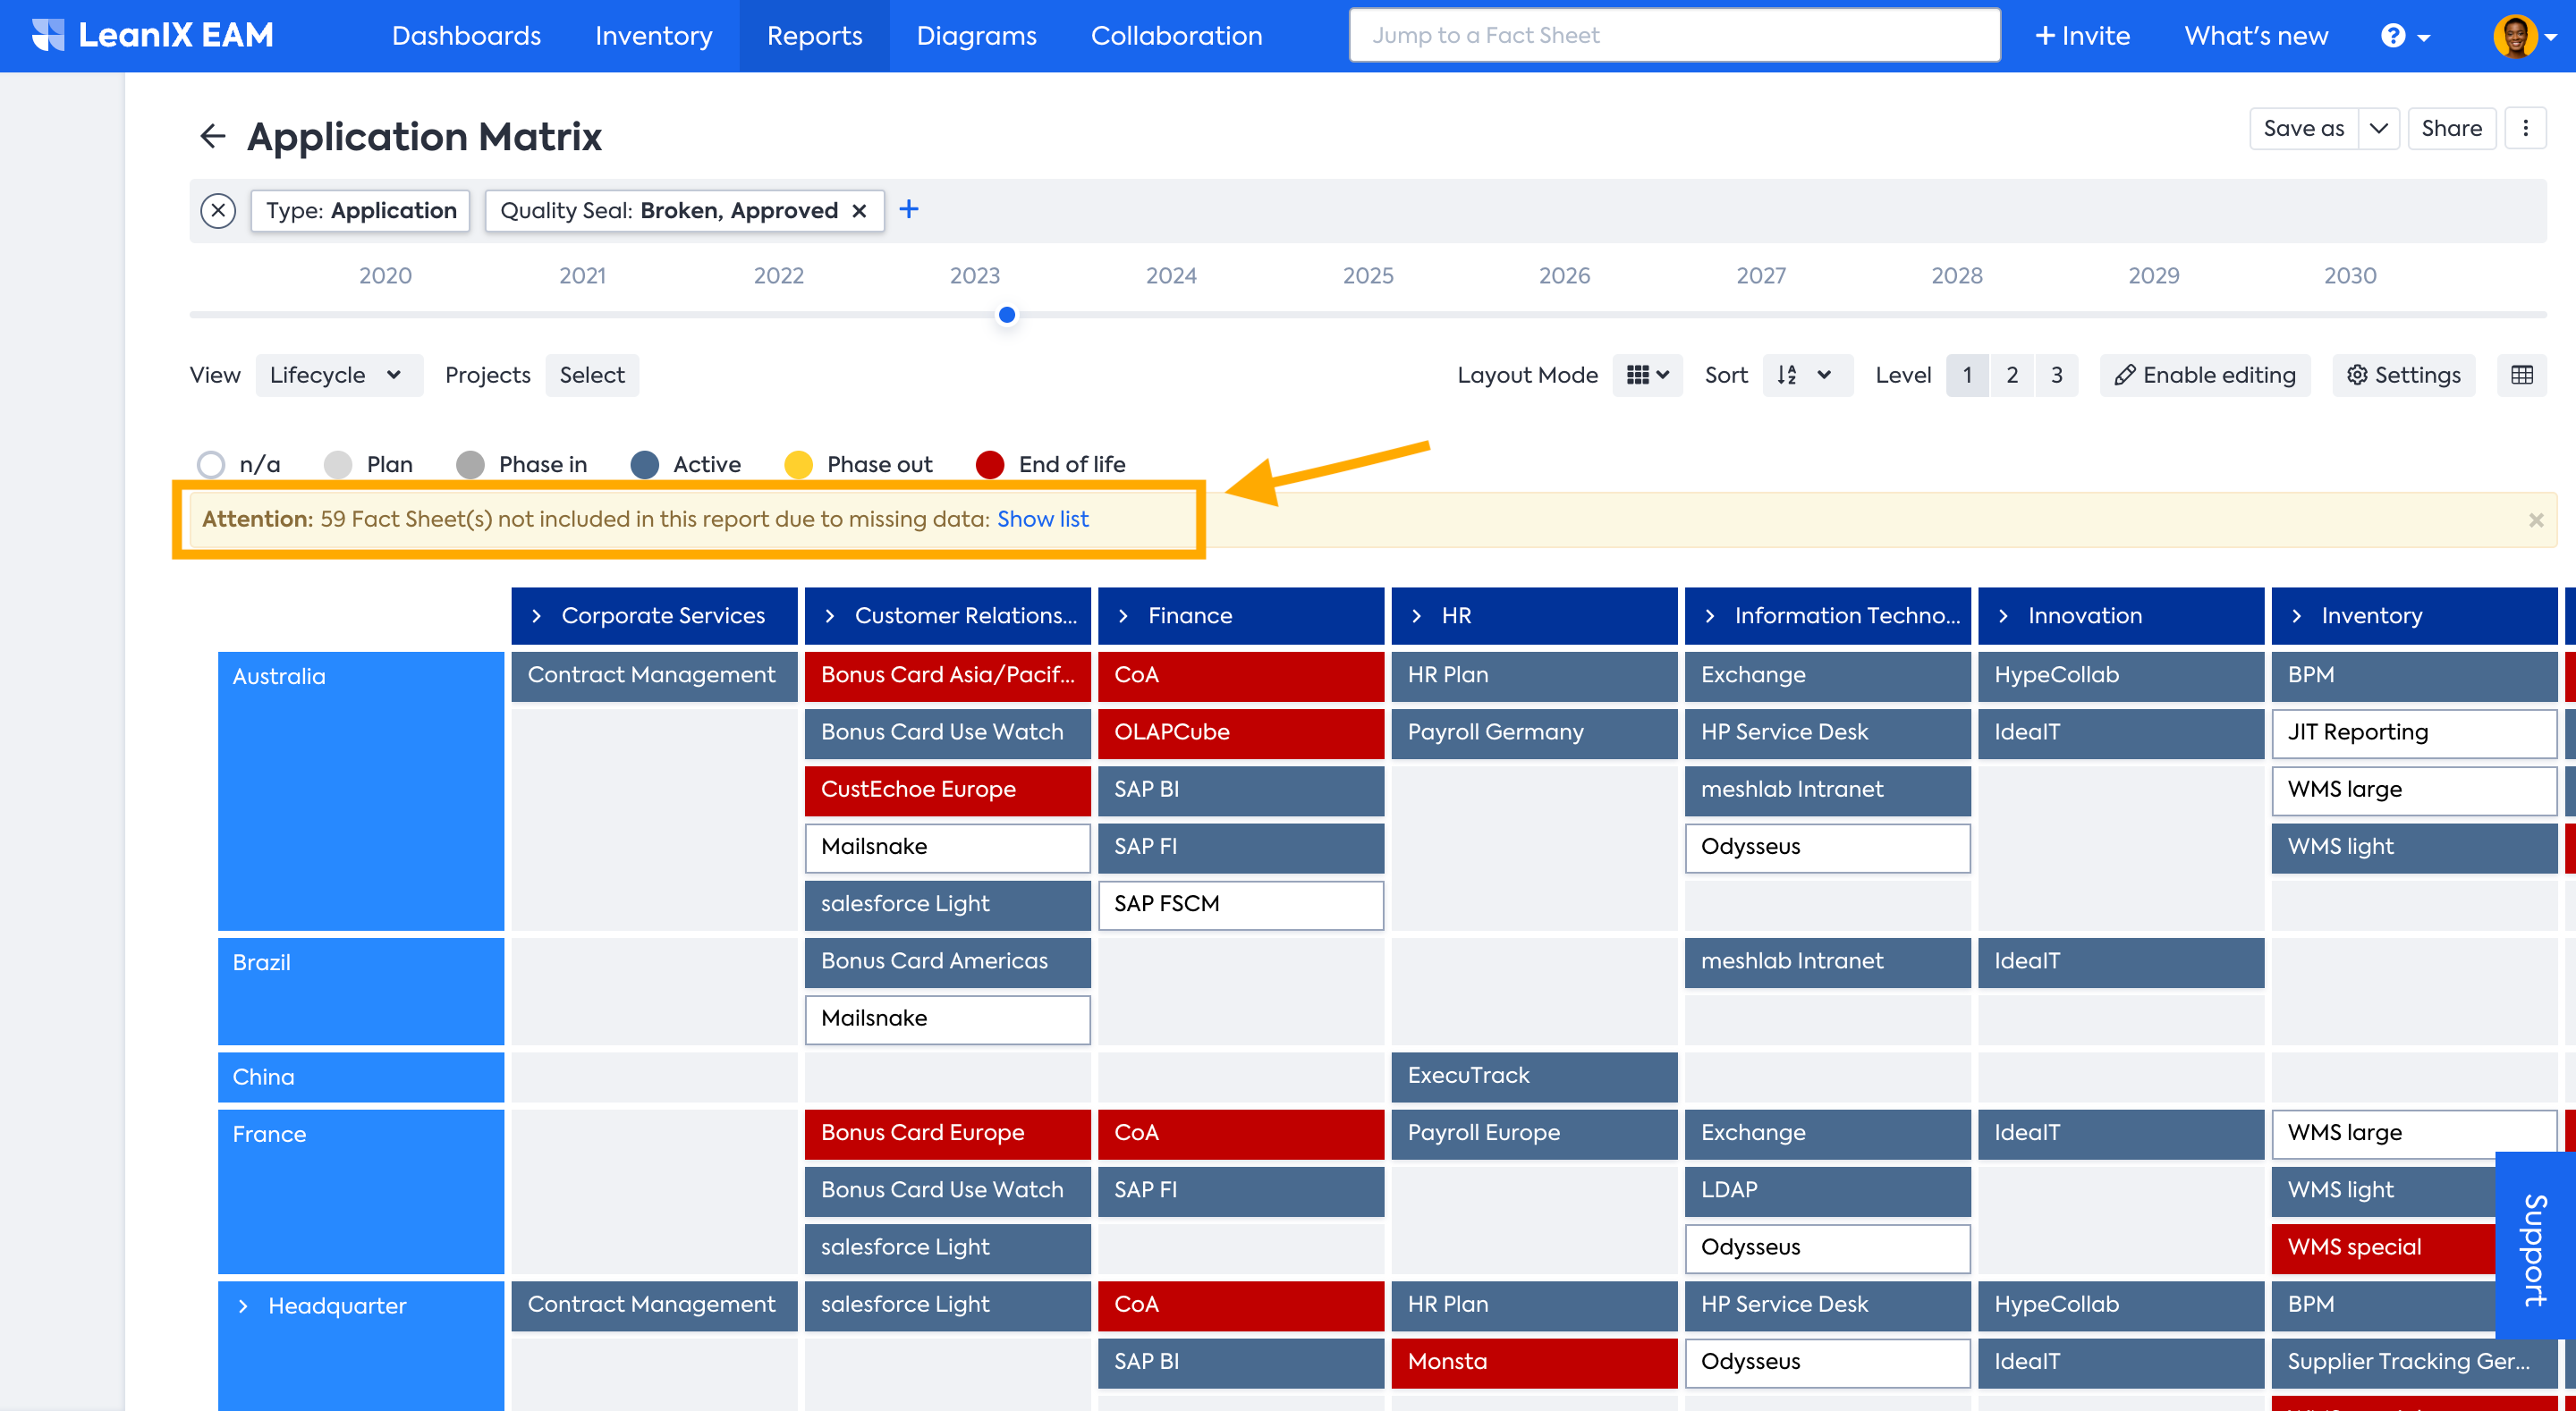
Clicking on the Show list link will open a pop-up window providing a list of all Fact Sheets that are not included in the report due to missing data.
To ensure that all the Fact Sheets are included in a Report without any missing data, you must fill in the necessary attribute fields in the Fact Sheets. You may refer to the tables below. It gives you an overview of all standard Reports in SAP LeanIX and shows which Fact Sheet types, relations, and attribute fields are needed to complete them.
Tip
For better readability of the below matrix, download the PDF version.
 the above matrix in PDF form here](https://files.readme.io/a0fd8a5-Screenshot_2023-10-20_at_09.56.08.png)
Necessary Attributes To Be Filled In Fact Sheets To Ensure Inclusion of All Fact Sheets in Reports
Marking a Report as a Favorite
You can mark a report as a favorite to have quick access to frequently used reports. To mark a report as a favorite, click on the star icon on the report. Reports marked as favorites are indicated by a blue star. Further, you can access all your favorite reports in one place inside the Favorites collection, under your personal section.
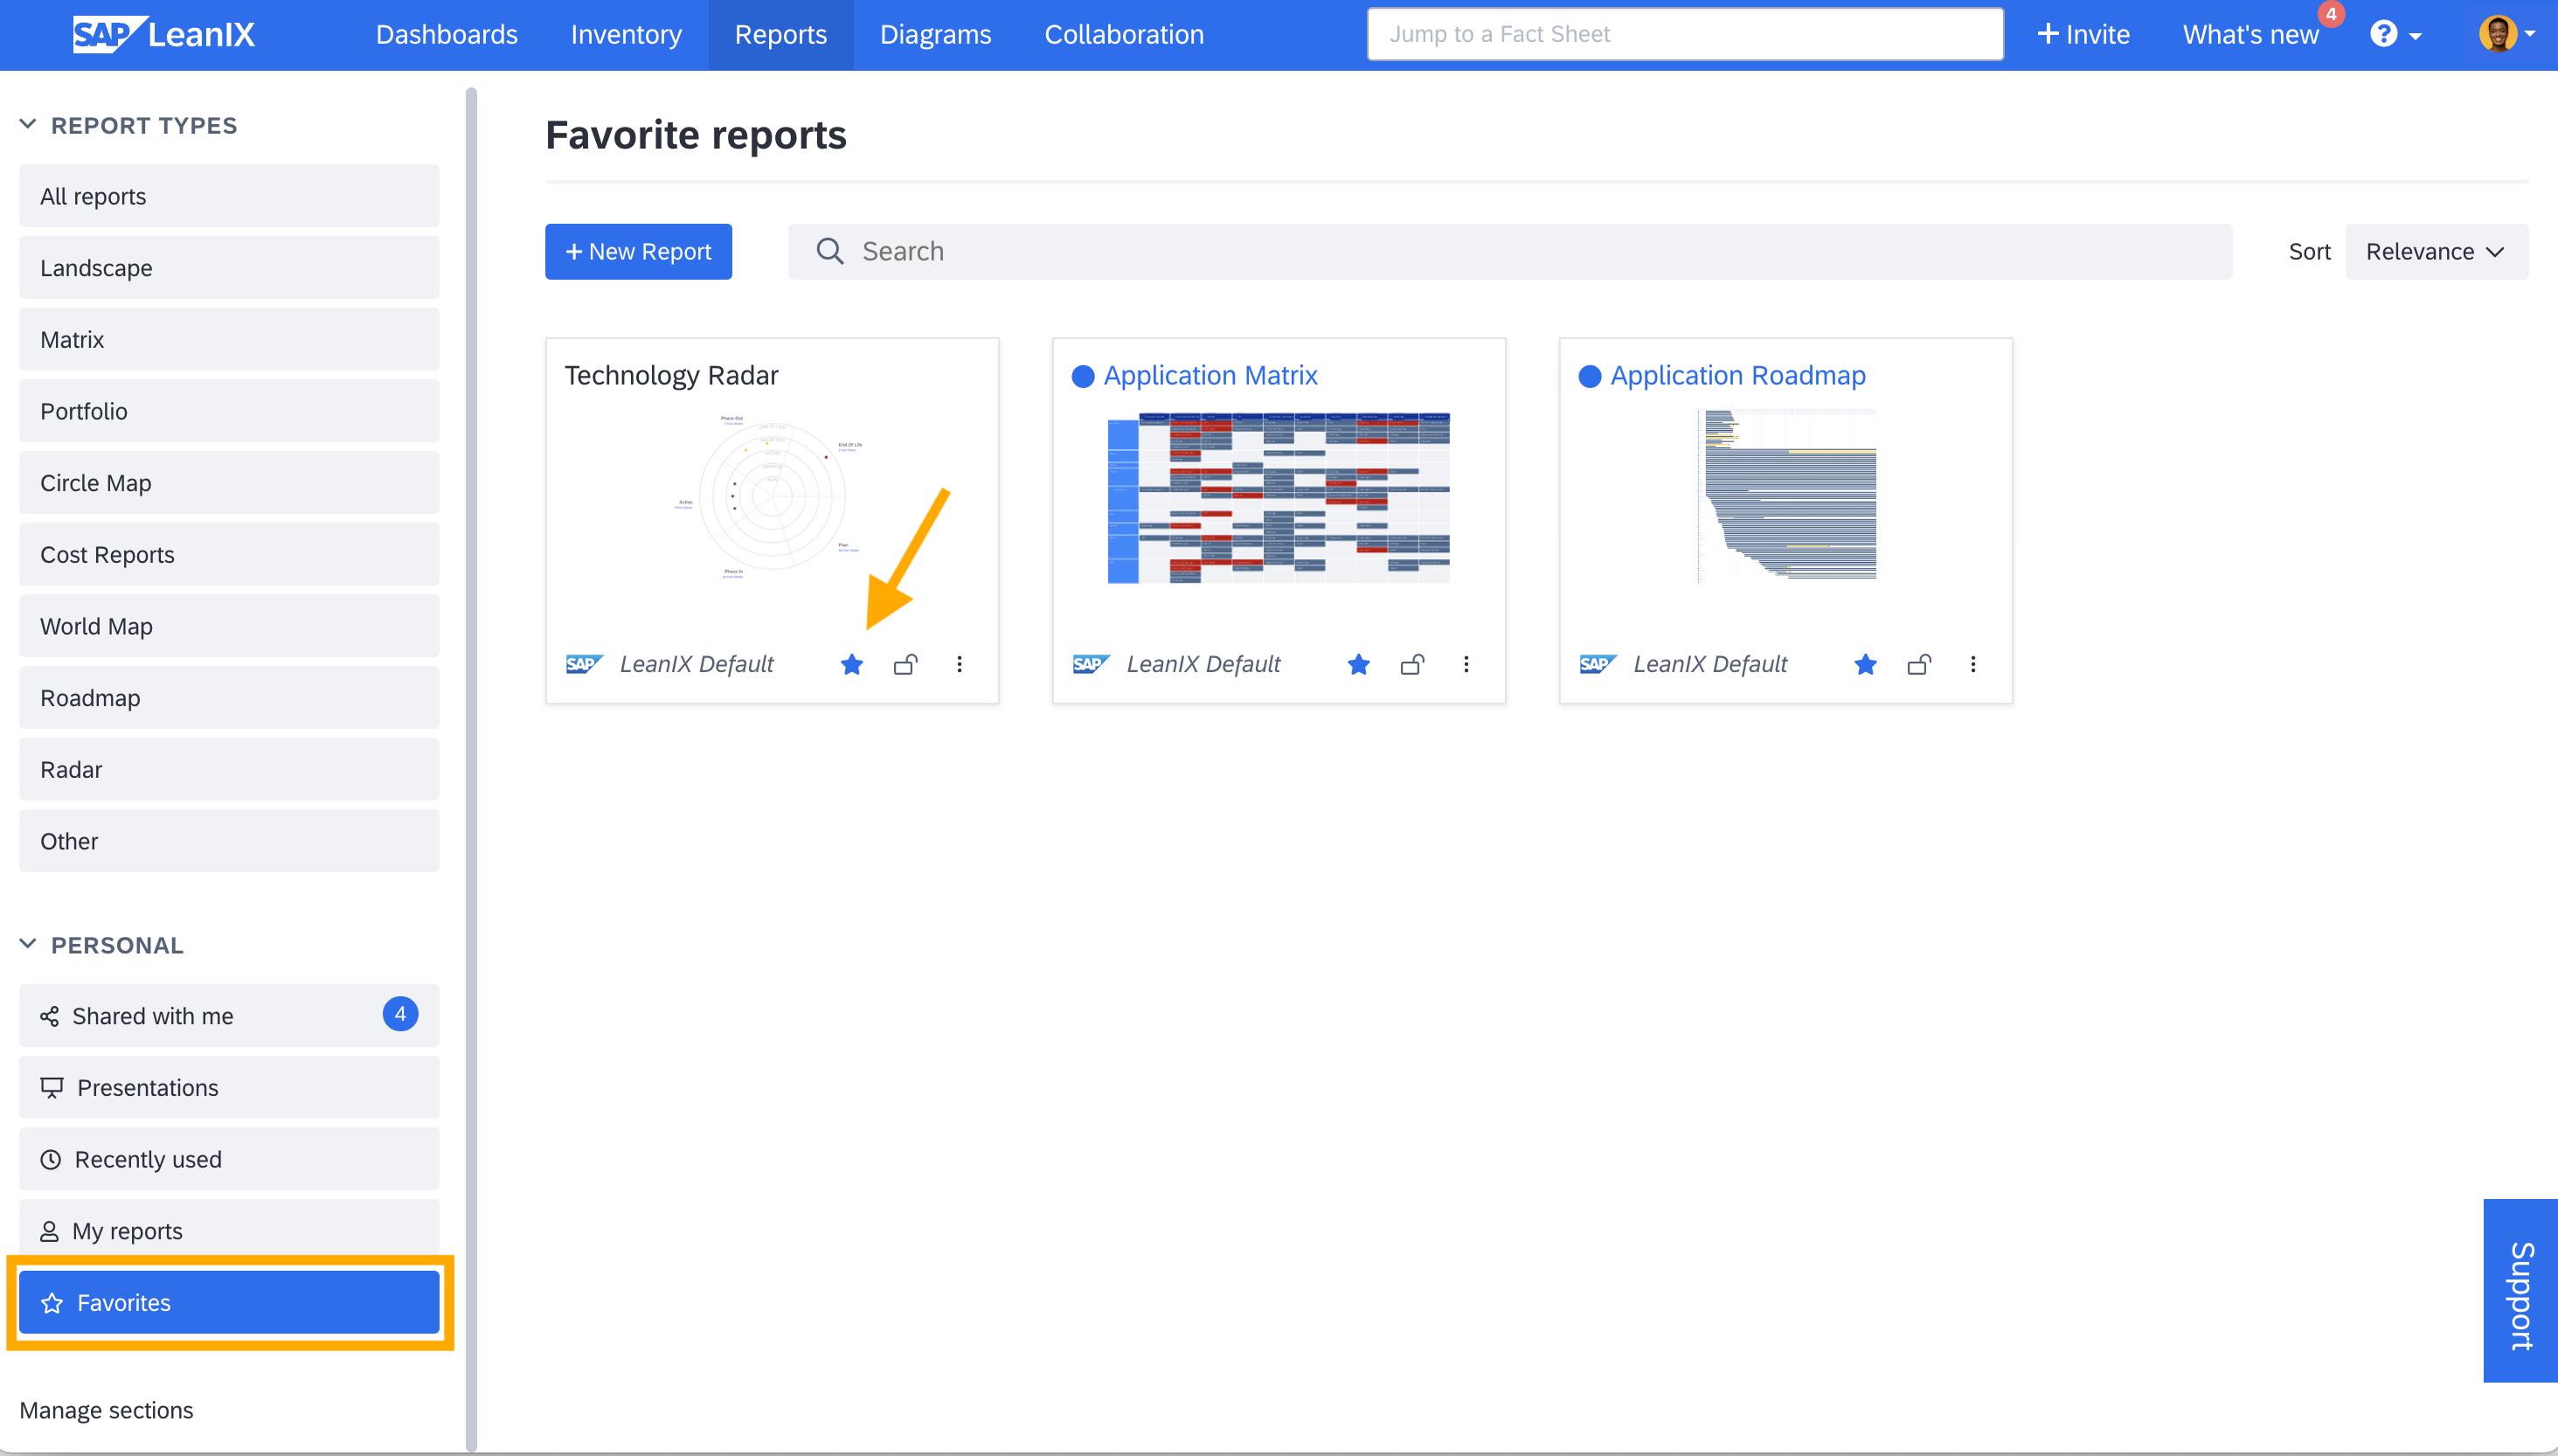
Favorite Reports
You can mark a report as a favorite from various other locations as well, including from report settings, the manage report page, and more.
Note
There is no limit to the number of favorites you can have, but marking too many reports as favorites may defeat the purpose.
When a user tries to delete a favorite report, a prompt informs them that the report is marked as a favorite and asks if they still want to proceed. This prompt helps prevent the accidental deletion of relevant content in your workspace, but you can still choose to delete the report if needed.
Report Permissions
Report permissions for members and viewers are as follows:
| Actions | Member | Viewer |
|---|---|---|
| Create new report | No | No |
| Save and Save as options | Only Save as for default reports and shared reports for which the user doesn’t have write permission. Once saved in this manner, the report is considered as user's own Save and Save as for shared reports for which the user has write permission Save and Save as for own reports | Only Save as for default reports and shared reports for which the user doesn’t have write permission. Once saved in this manner, the report is considered as user's own Save and Save as for shared reports for which the user has write permission Save and Save as for own reports |
| Delete a report | Yes: User’s own reports Shared reports for which the user has write permission No: Shared reports for which the user doesn’t have write permission Default reports | Yes: User’s own reports Shared reports for which the user has write permission No: Shared reports for which the user doesn’t have write permission Default reports |
| Share a report | Yes | Yes |
| Export a report | Yes However, it depends on whether members have export permissions for all fact sheet types included in the report. By default, the authorization model grants members export permissions for all fact sheet types. For more details, see Fact Sheet Permissions. | No However, it depends on whether viewers have export permissions for all fact sheet types included in the report. By default, viewers do not have export permissions for fact sheets, but the admins can change this. For more details, see Fact Sheet Permissions. |
| Add to collection | No | No |
Managing Reports
Searching, Filtering, and Sorting
Search, filter, and sort functions help you streamline navigation, save time, and ensure better control over large sets of reports.
- Search: Quickly find a specific report using keywords.
- Filter: Narrow down reports to your required subset based on criteria like ownership, read and write permissions, creation date, modification date, and type of reports.
- Sort: Organize reports by attributes such as name, date, or relevance to find what you need faster.
Searching, Filtering, and Sorting Reports
Switching Between List and Grid View
You can switch to the list view by clicking the hamburger menu icon at the top right. The list view presents information in a detailed table format, making it easier to consume the information and perform bulk actions efficiently.
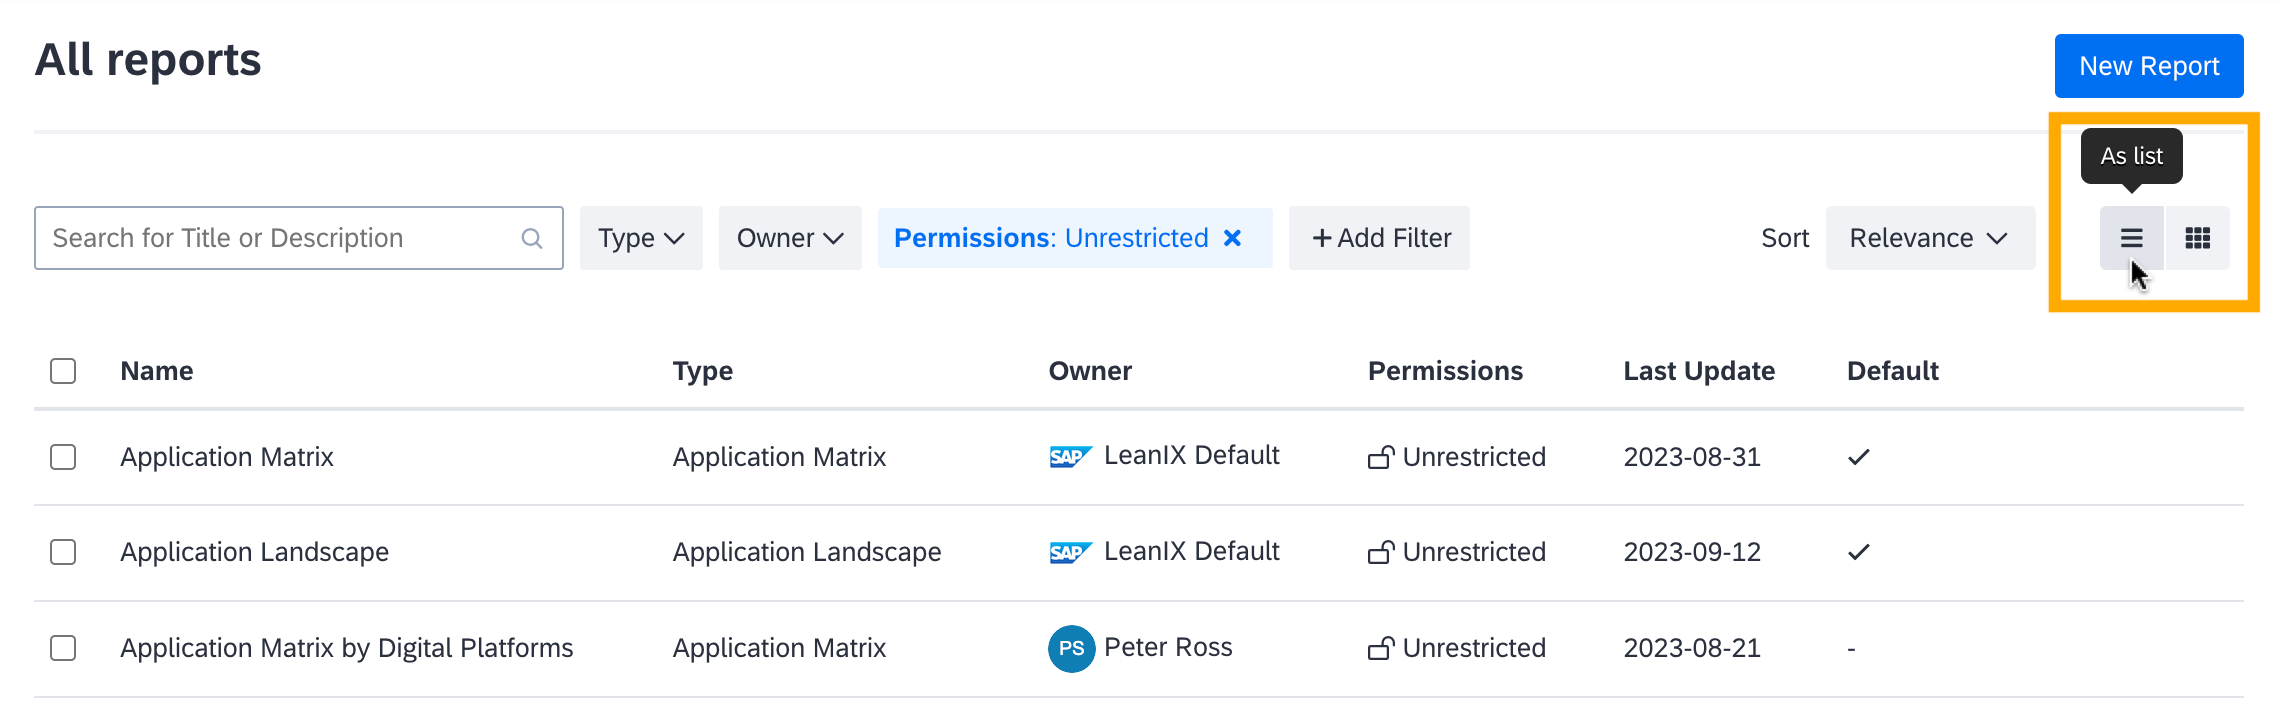
Switching Between List and Grid View
Managing Ownership and Permissions
Admin users can view all reports, change ownership, and update read/write permissions, regardless of the original permissions set by their creators. This ensures critical content remains accessible, even if users forget to share their reports or leave the organization without updating access rights.
To change ownership, follow these steps:
- Switch to list view by clicking the hamburger menu icon at the top right.
- Select the reports for which you want to change ownership.
- Click Change Owner at the top right of the list.
- In the overlay that appears, search for and select the new owner.
- Confirm the change by clicking Save in the overlay.
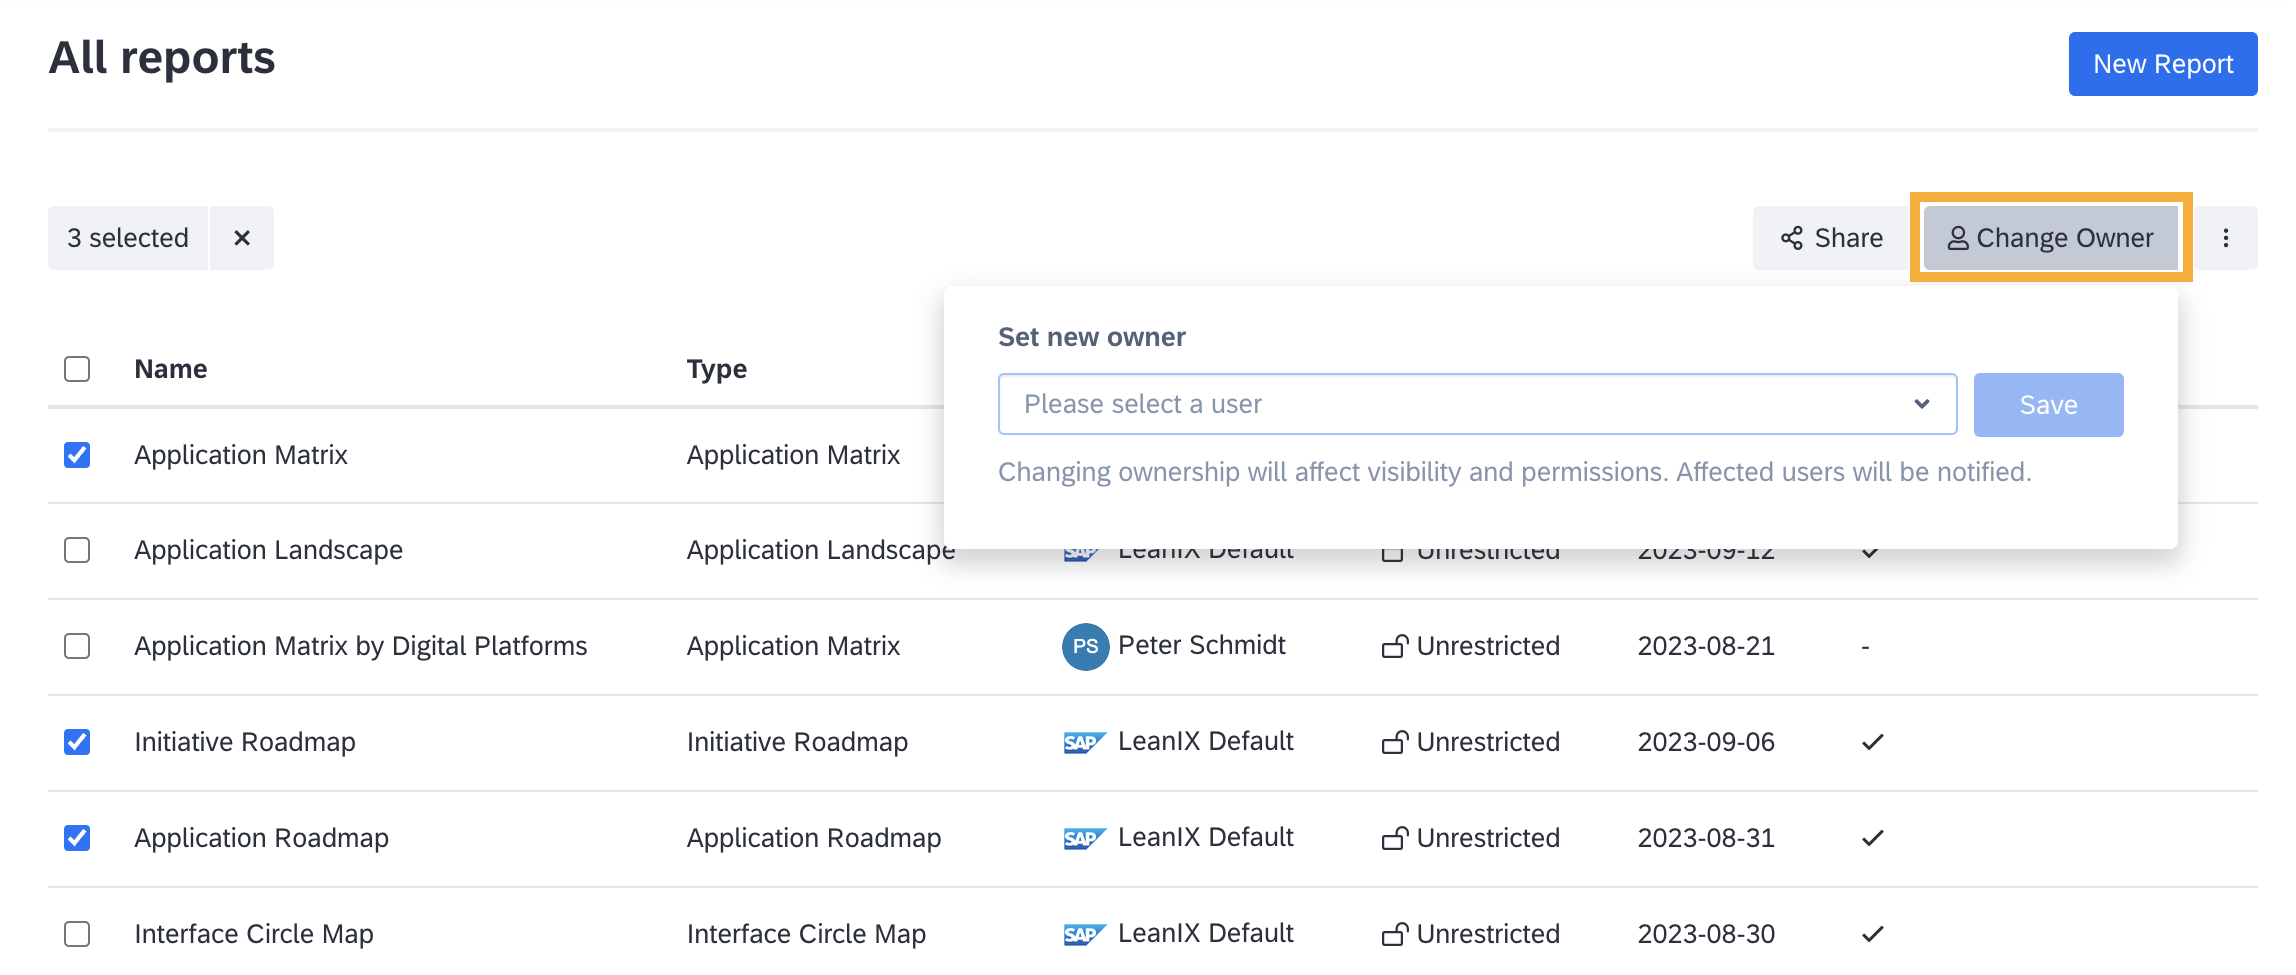
Changing Ownership of Reports
Read/write permissions can only be changed individually. However, applying permission or ownership filters can help narrow down the list, making the process easier for you.
To change permission, follow these steps:
- Click the three-dot menu on the report.
- Select Report details.
- On the resulting page, navigate to the Permissions tab.
- From the Permission Type drop-down list, select the appropriate permission. For default (predefined) reports, you must first mark them as not default. See the note below for more details.
- Click Save to confirm the change.
Note
The permissions for default (predefined) reports can only be changed after marking them as not default. To do this, uncheck the Mark as default checkbox in the Settings tab and save the changes. You can then follow the usual steps to modify permissions.
Updated 23 days ago