
Other Reports
Cost Reports
Cost reports are a powerful tool that helps organizations to understand the cost of their IT landscape. The SAP LeanIX Cost Reports provide an overview of which business capabilities are supported by which applications, which projects are running, which providers are being used, and how much they cost annually.
By using the Cost Reports, you can analyze the cost allocation per business capability, application, and provider, and identify areas where costs can be reduced. For example, if you find that a particular application is supporting multiple business capabilities, you can analyze the cost of each business capability and identify areas where costs can be optimized. Learn more about Cost Management here.
SAP LeanIX provides two default Cost reports:
- The Business Capability Cost Report gives you an overview of which business capabilities are supported by which applications and how much this support costs annually. This report helps you understand the cost allocation per business capability and analyze where costs could be reduced.
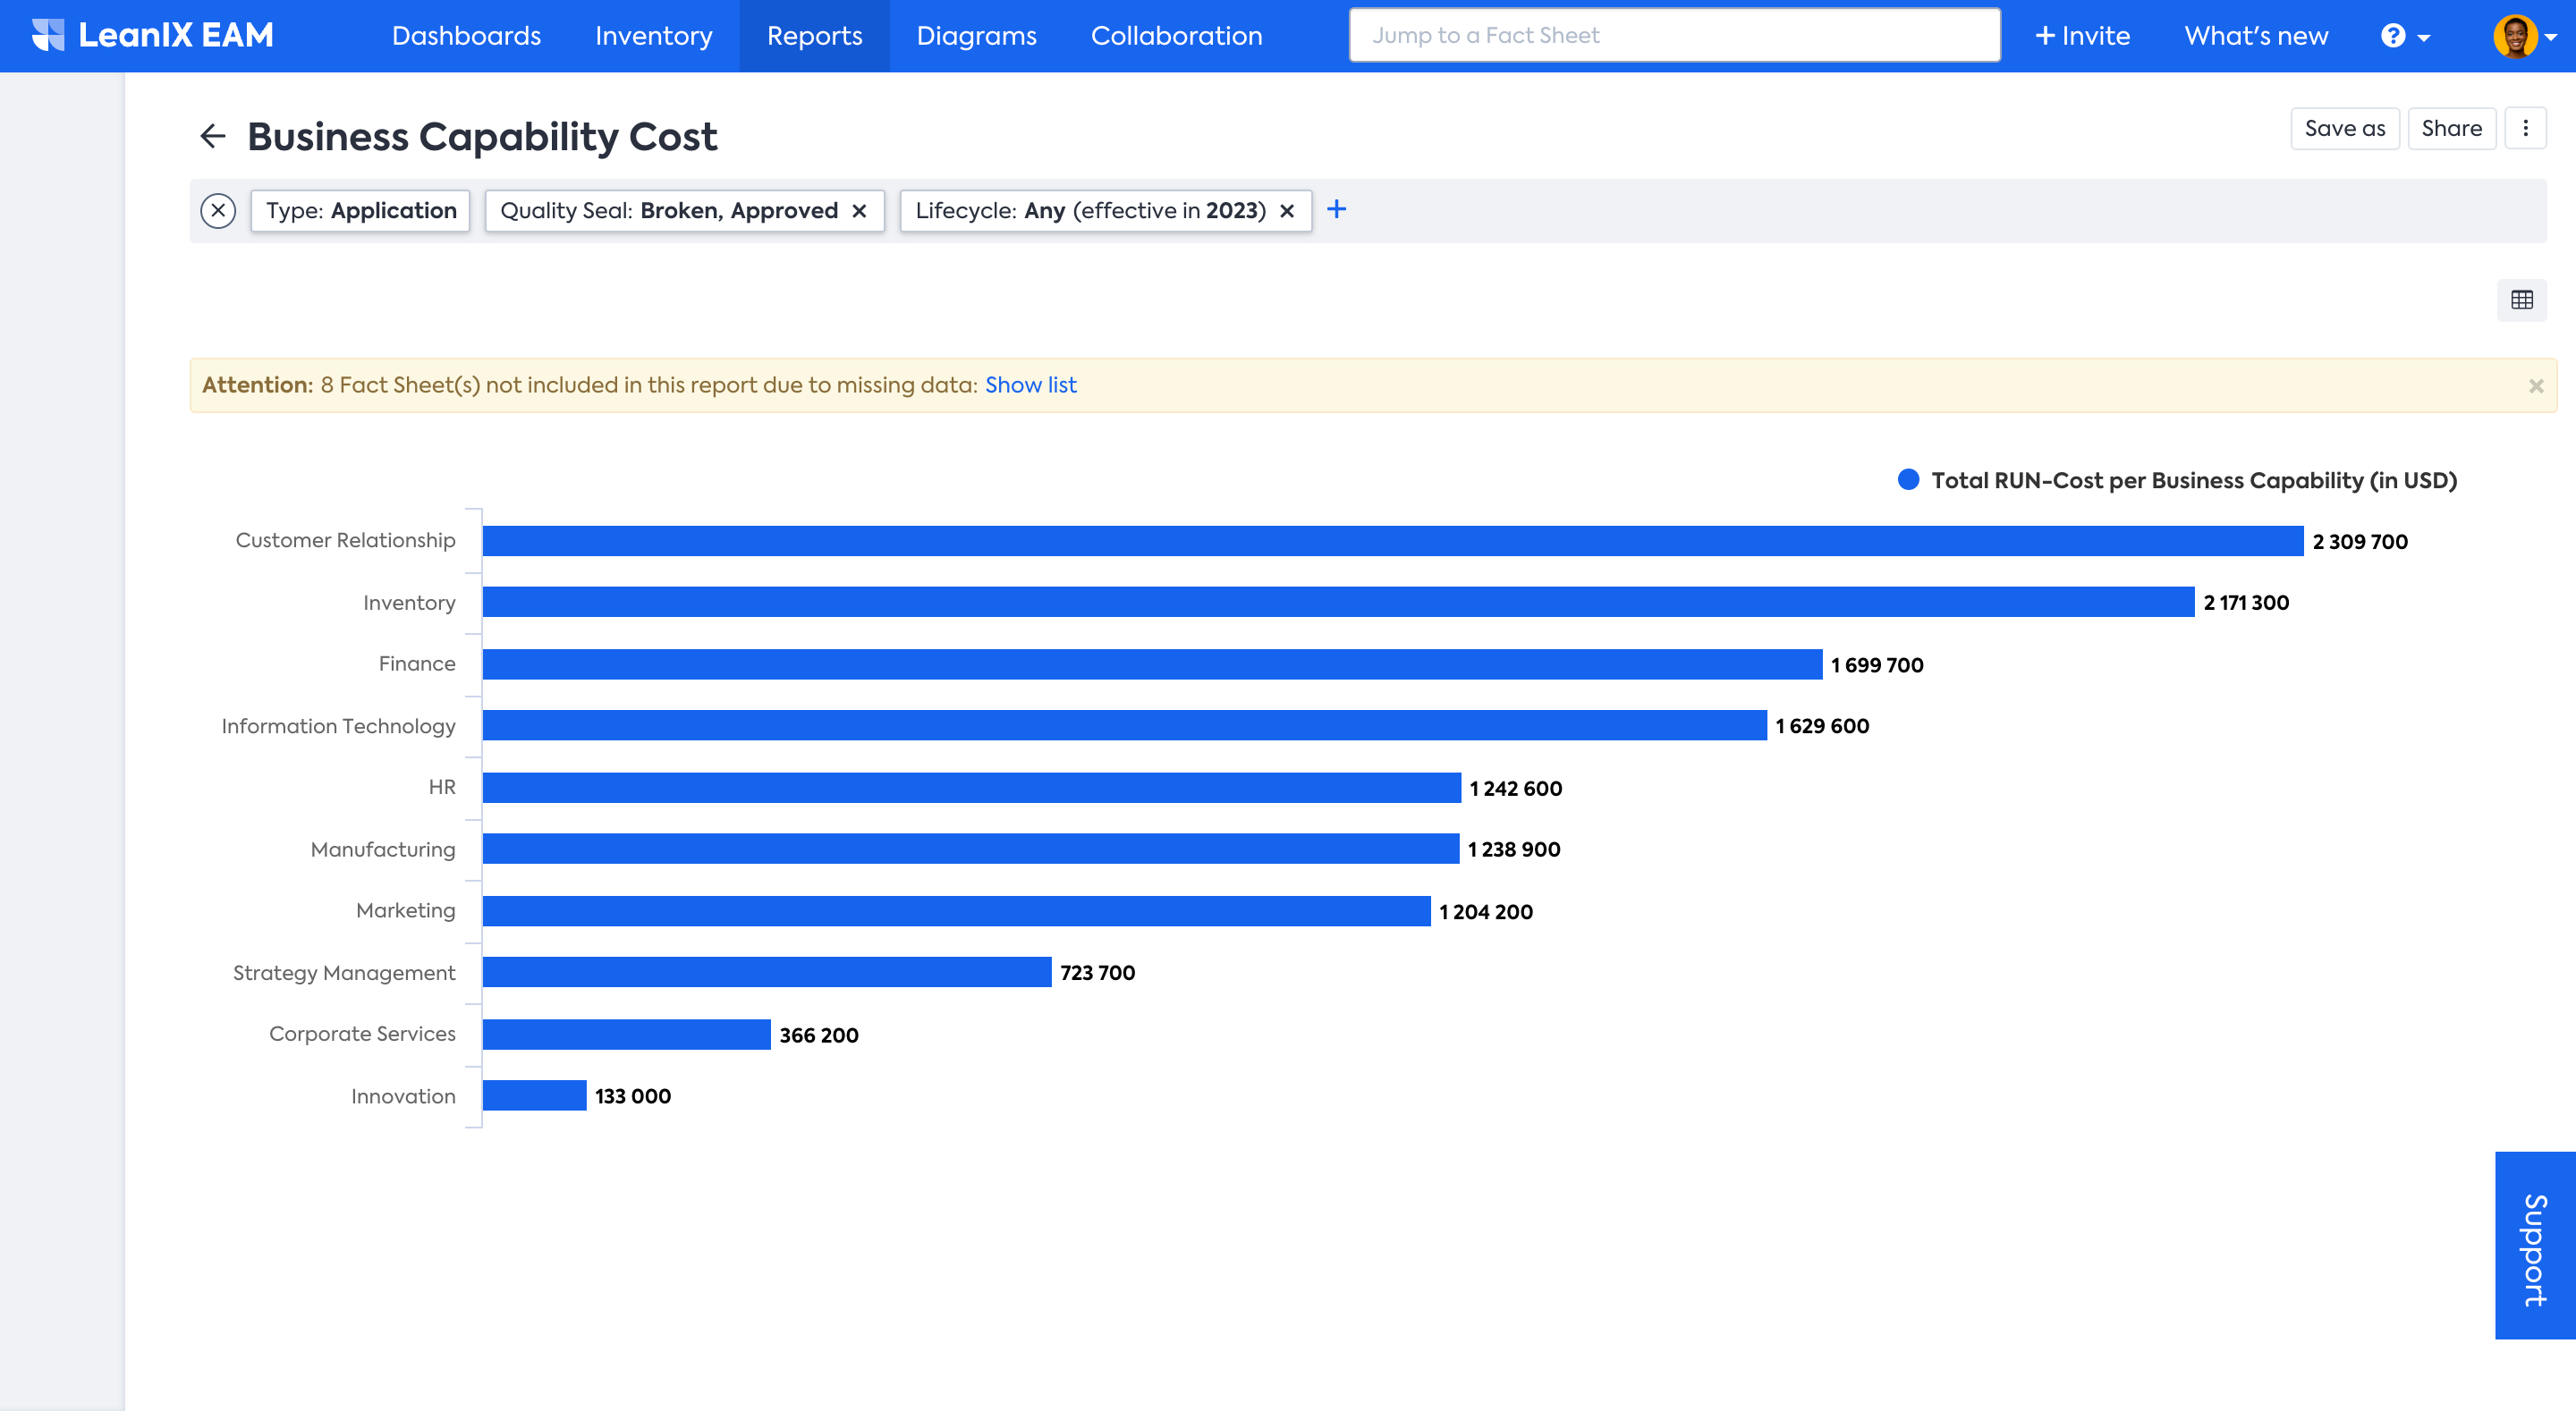
To discover which Applications are causing expenses for a particular Business Capability, you can click on the relevant bar graph to obtain additional information. You can also access the corresponding Application Fact Sheets by clicking on the left-hand link within the window that appears.
Note
In order for the Business Capability Cost report to work, you need to set the attribute "Support Type" on the Application - Business Capability relation to "Leading". This way, SAP LeanIX makes sure that run costs are only counted for one Business Capability.
In the rare case where an Application is set to "Leading" for multiple Business Capabilities, run costs will be split equally between these Business Capabilities.
-
The Provider Cost Report shows you the cost allocation per provider either as a pie chart or in a table view. This report helps you understand how much you are spending on each provider and identify areas where you could negotiate better rates.
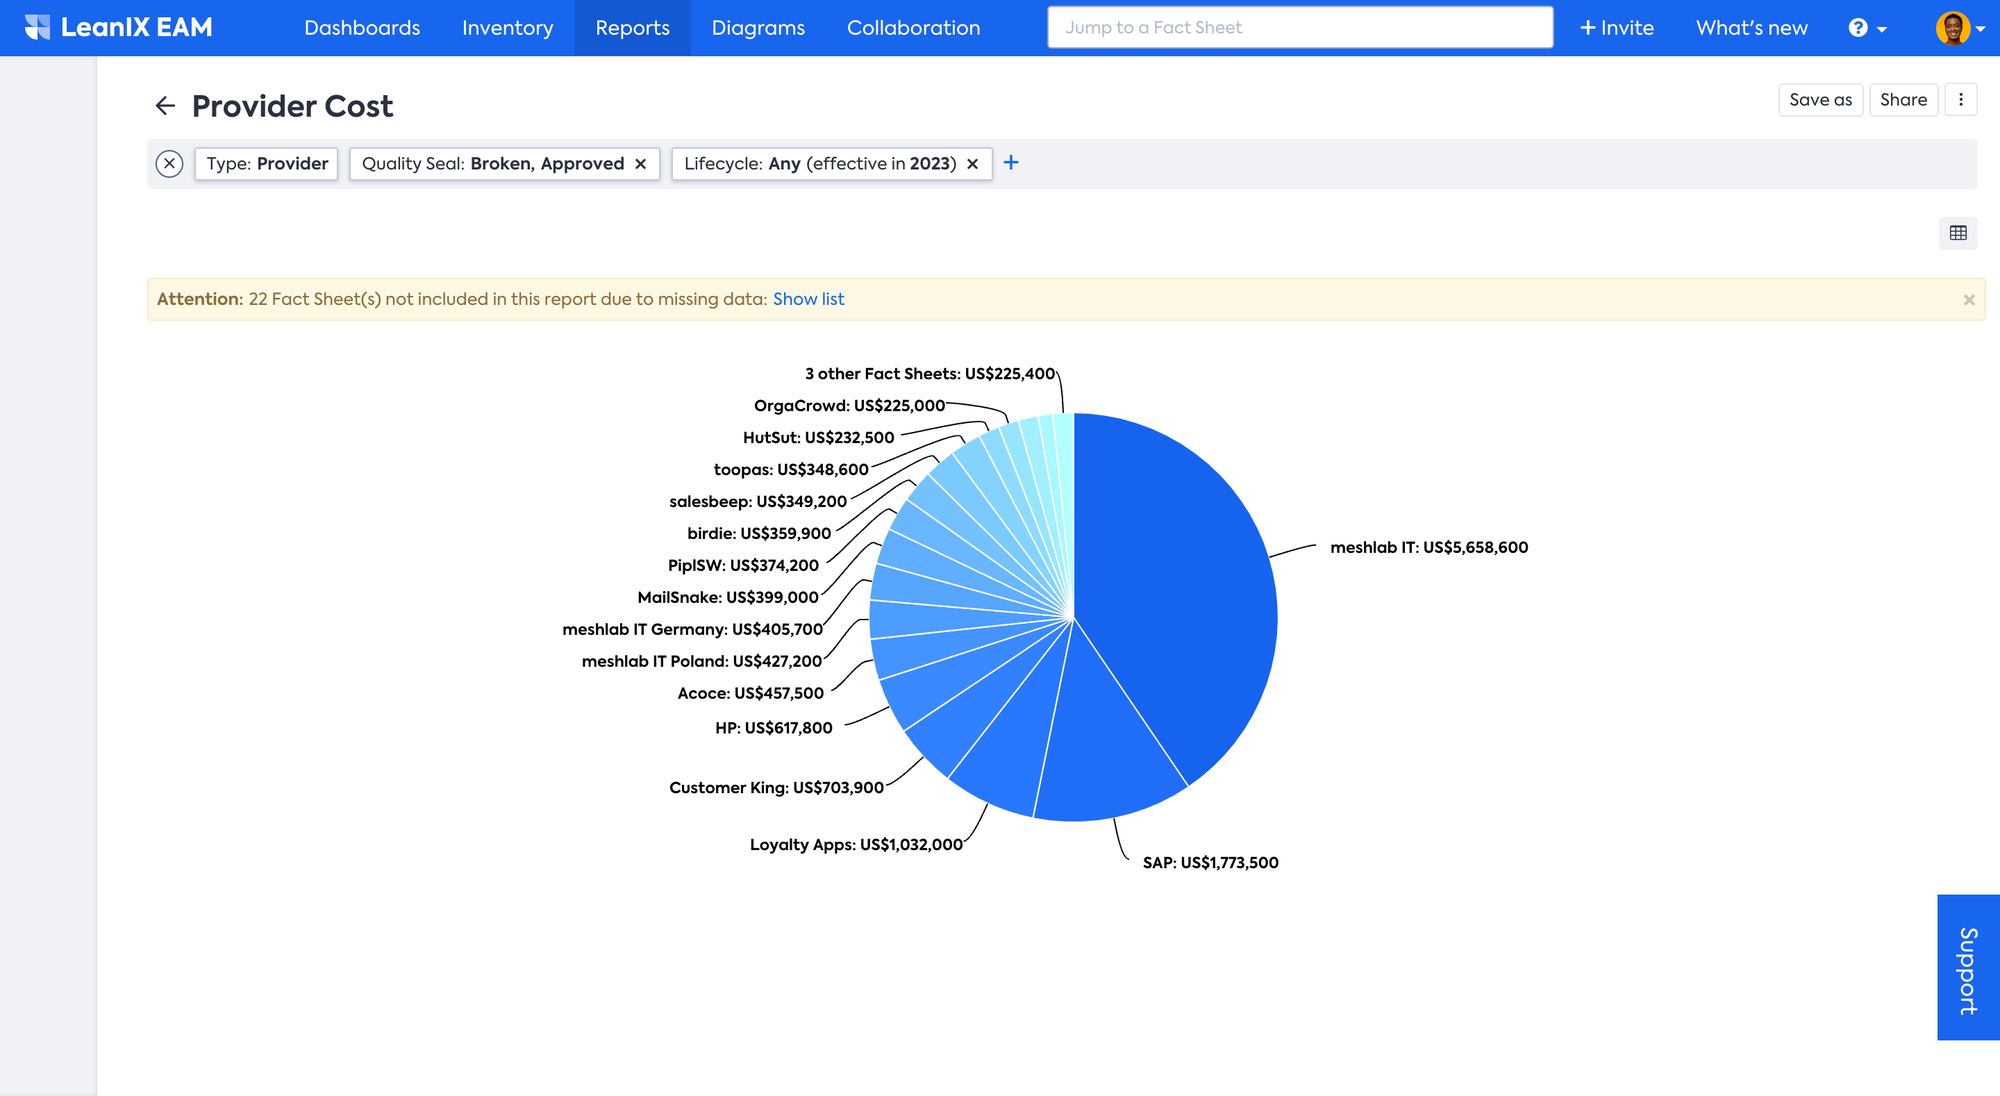
You can navigate to the respective Provider Fact Sheet by simply clicking on the graph.
World Map
The World Map Report of SAP LeanIX is a tool that provides an overview of which IT components and applications are used by user groups and their location on a world map. SAP LeanIX provides three default World Map reports: Application Sourcing report, the Application Usage report, and the IT Component Location report.
-
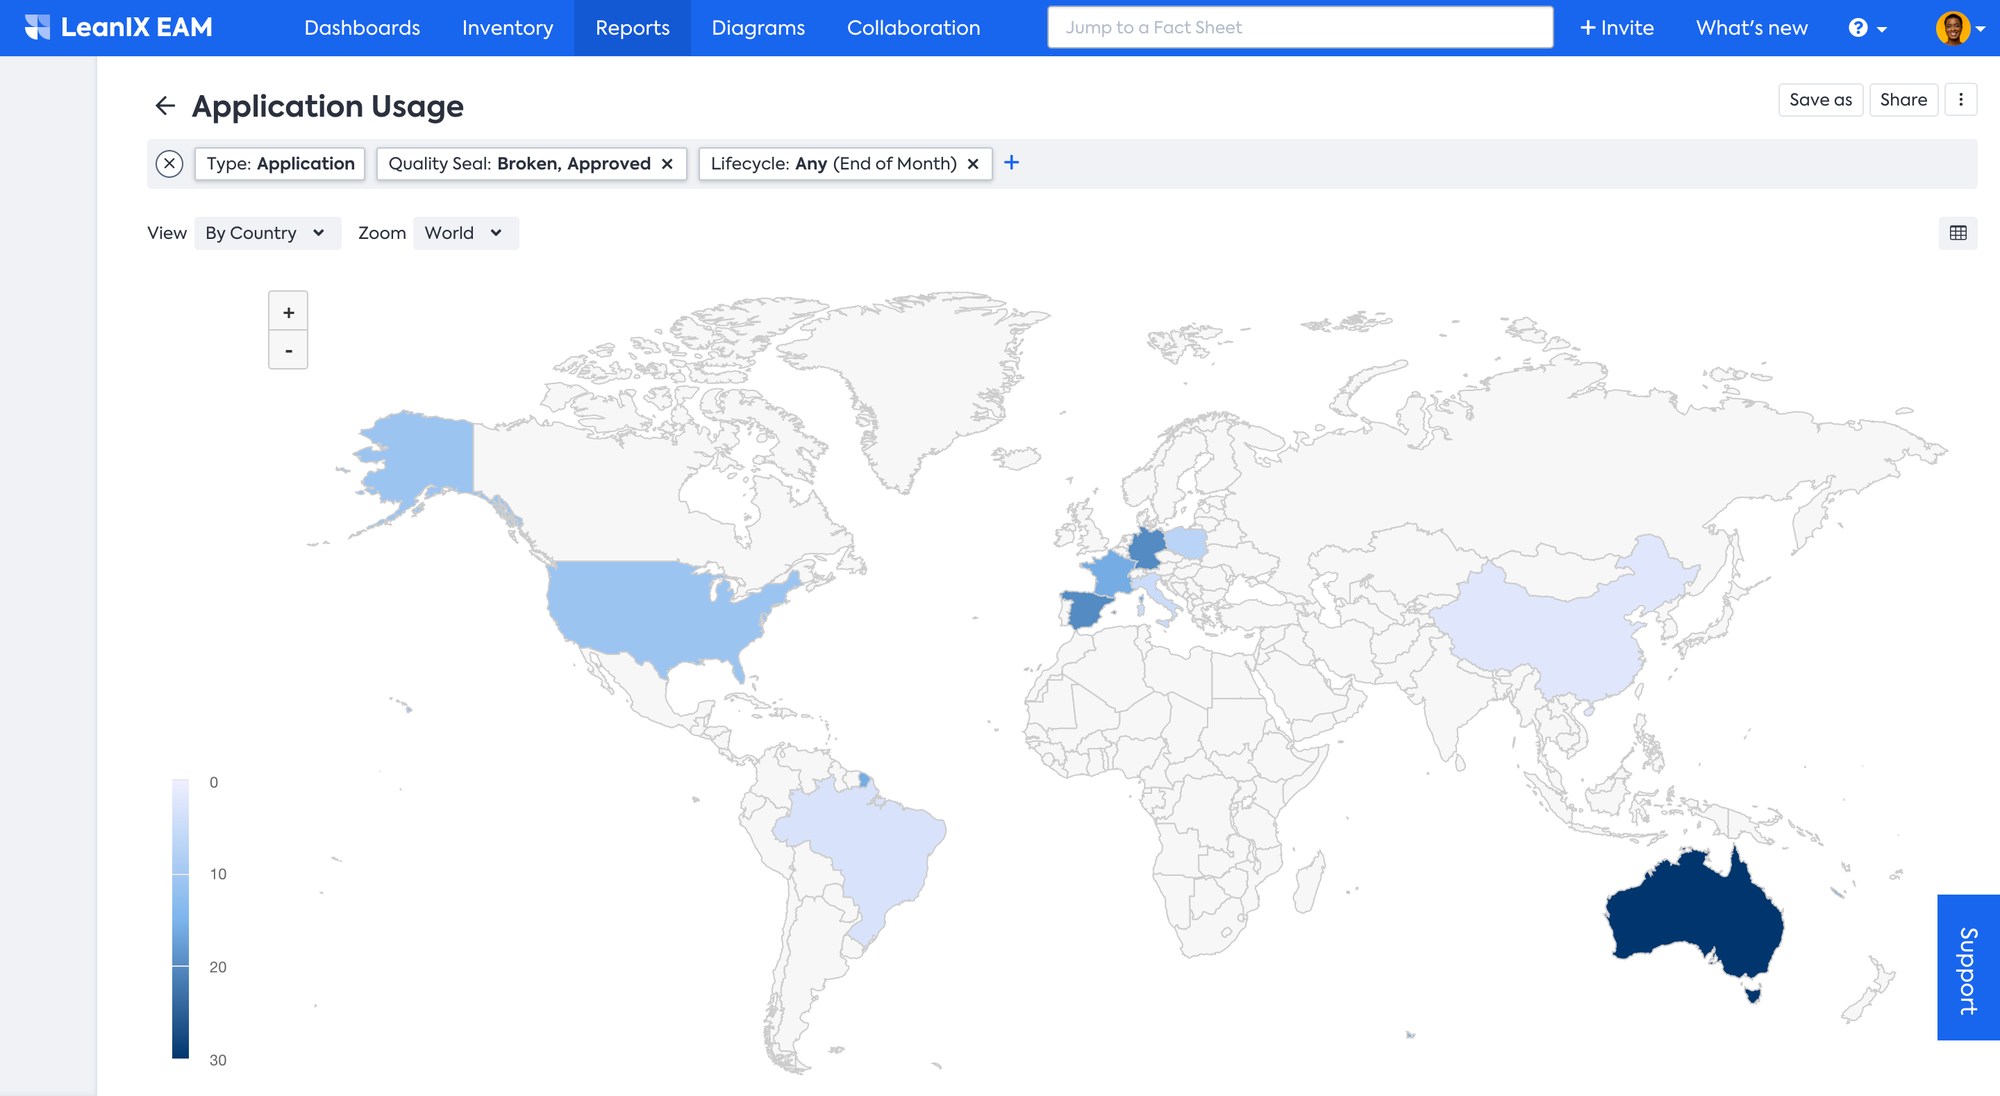
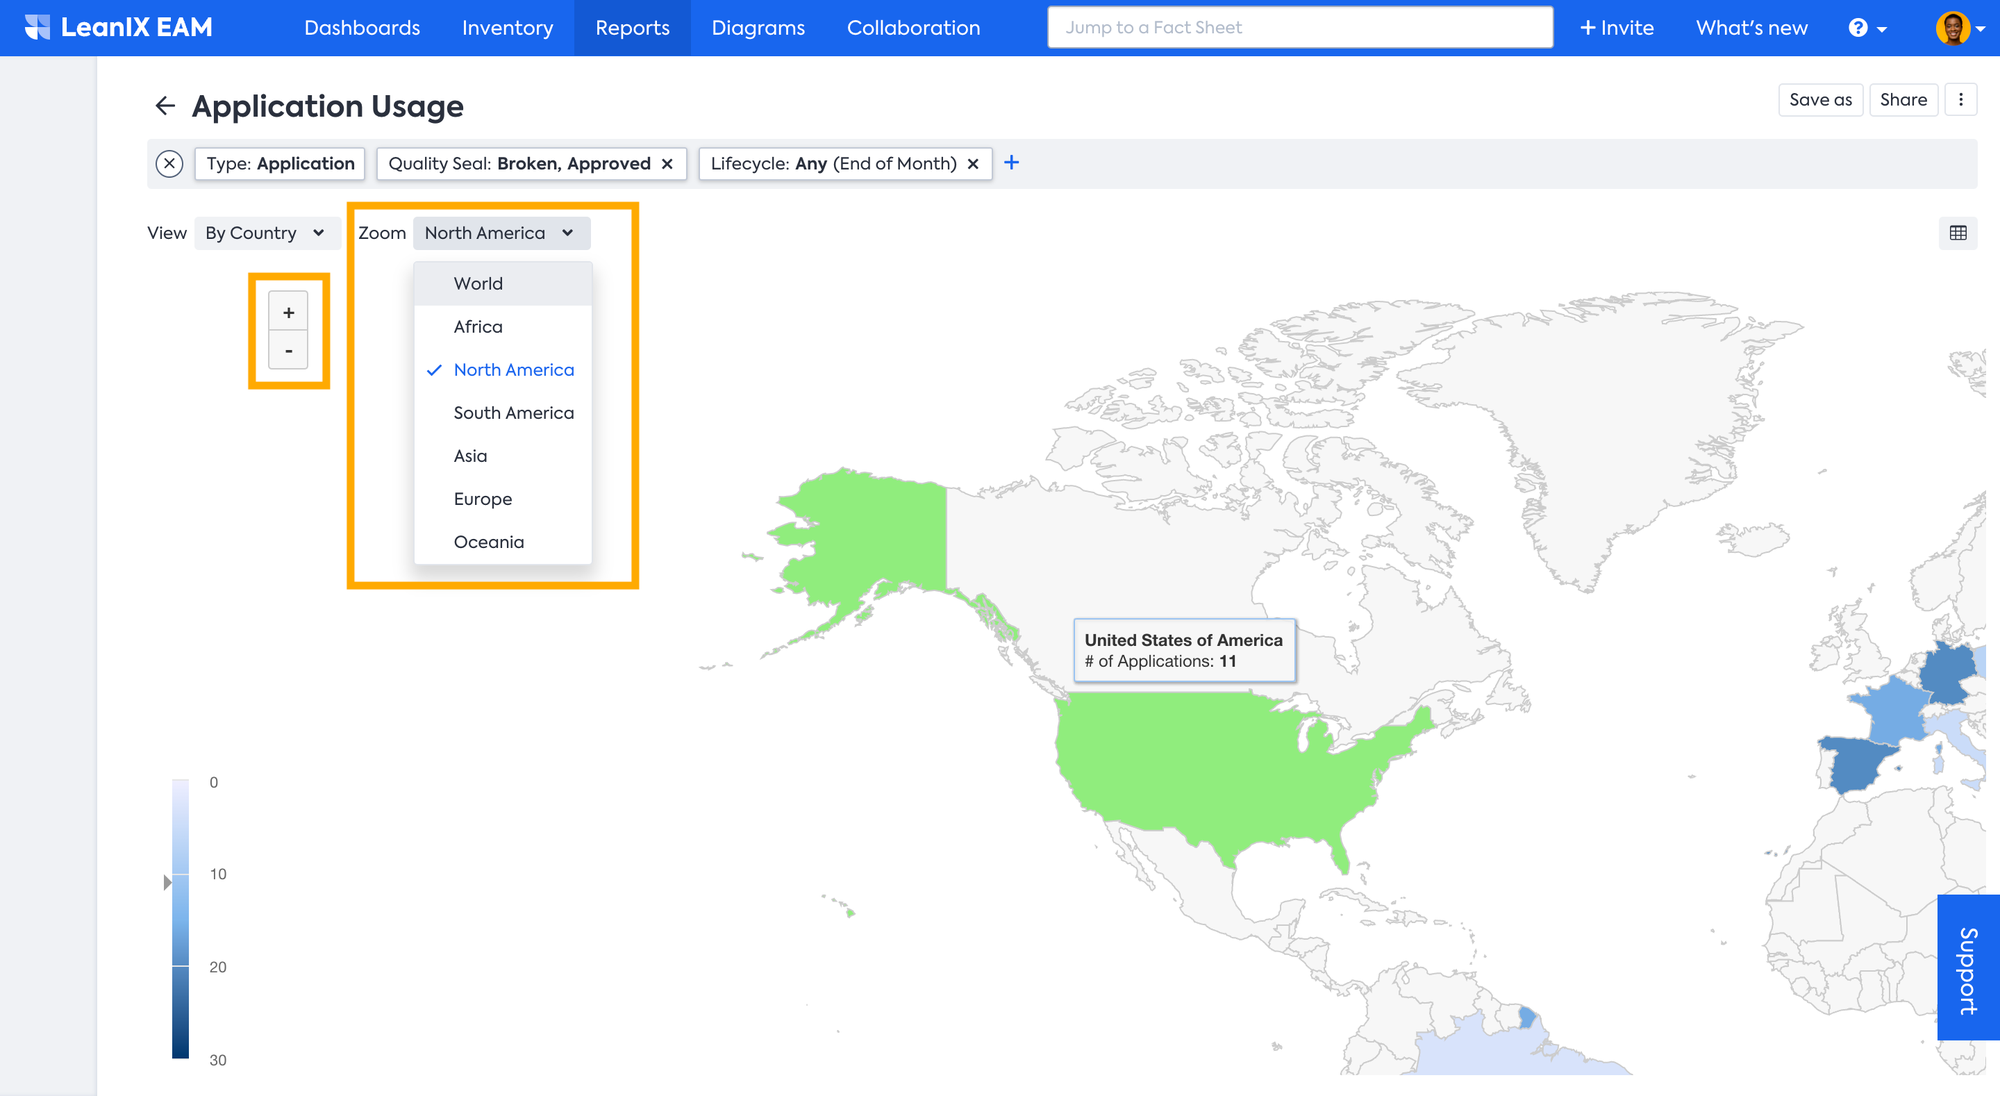
The Application Usage report focuses on which applications are being used by which organizations/user groups. It allows users to identify which applications are popular and which are not being used as much, providing insight into how IT resources are being utilized by region. This report is region-specific, allowing users to zoom in on specific regions of interest. To use the Application Usage report, ensure location details are maintained in the Organization Fact Sheet and that it's connected to the relevant Application Fact Sheets.
-
The Application Sourcing report allows users to determine which IT components are being sourced from which region. It provides insight into the relationship between IT components and providers, allowing you to identify patterns and trends in IT assets sourcing by region. By zooming in on specific regions, users can get further details of the usage of applications within that region. To use the Application Sourcing report, ensure location details are maintained in the IT Component Fact Sheet and that relevant relations are established among relevant Application Fact Sheets and Provider Fact Sheets.
-
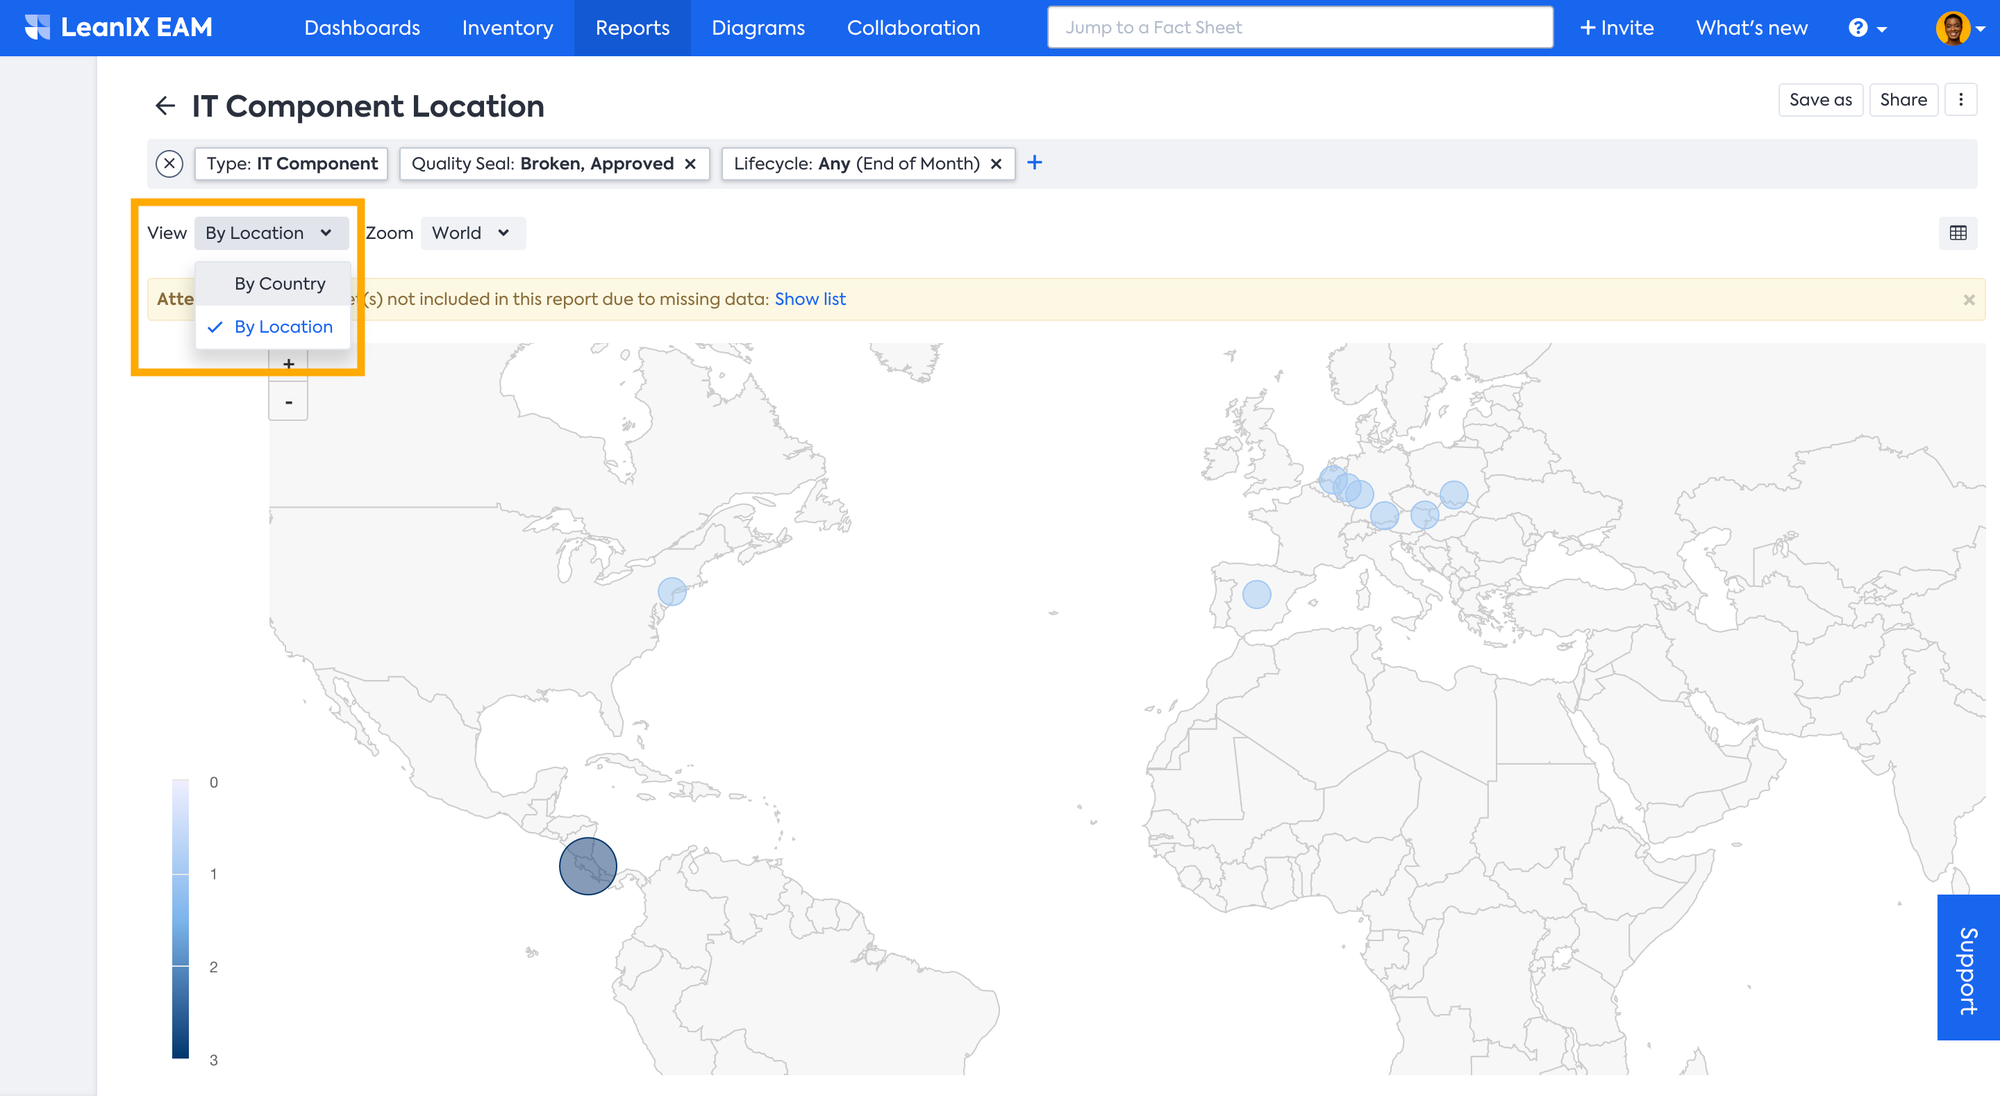
The IT Component Location report shows which IT components are hosted or located in which countries or regions. It provides a visual representation of the distribution of your IT assets and is valuable for compliance-related scenarios where understanding and tracking who provides technology services and where they are hosted is essential. You can zoom in on specific regions to gain more detailed information. To use the IT Component Location report, ensure location details are maintained in the IT Component Fact Sheets.
In World Map Reports, you can visualize your data either by Country or Location for better understanding.
Further, you can Zoom into a particular region by selecting a region from the Zoom drop-down menu. Alternatively, you can use the ‘+' / '-’ icons for zooming in and out.
Updated 23 days ago