
Fact Sheet Owner Onboarding Dashboard
The Fact Sheet Owner onboarding dashboard helps new users learn SAP LeanIX. It offers resources and panels for understanding responsibilities, managing data, and collaborating. It's the default dashboard for new workspaces, featuring tutorials and links to product documentation.
Introduction
The Fact Sheet Owner onboarding dashboard supports new users with the adoption of SAP LeanIX. It provides curated learning resources and dashboard panels that help Fact Sheet Owners get familiar with SAP LeanIX and their responsibilities within the tool focused on data collection and maintenance. It serves as the landing page that enables Fact Sheet Owners to stay on top of things when they continue to use SAP LeanIX. It is set as the default dashboard for the new workspaces.
Note
- The dashboard is provided to all newly created workspaces starting March 18, 2024.
- The dashboard is available for self-service activation in all workspaces starting August 12, 2024.
Activating the Dashboard
Admin users can activate the onboarding dashboard and make it available to all workspace users as a template. To do that, navigate to the Dashboards section in the administration area, locate the Templates settings group, then click Add template for the Fact Sheet Owner Onboarding Dashboard template and confirm your action.
For more information, see Dashboard Templates.
Dashboard Structure
By default, the dashboard consists of the following areas:
- Welcome message and overview of learnings/resources
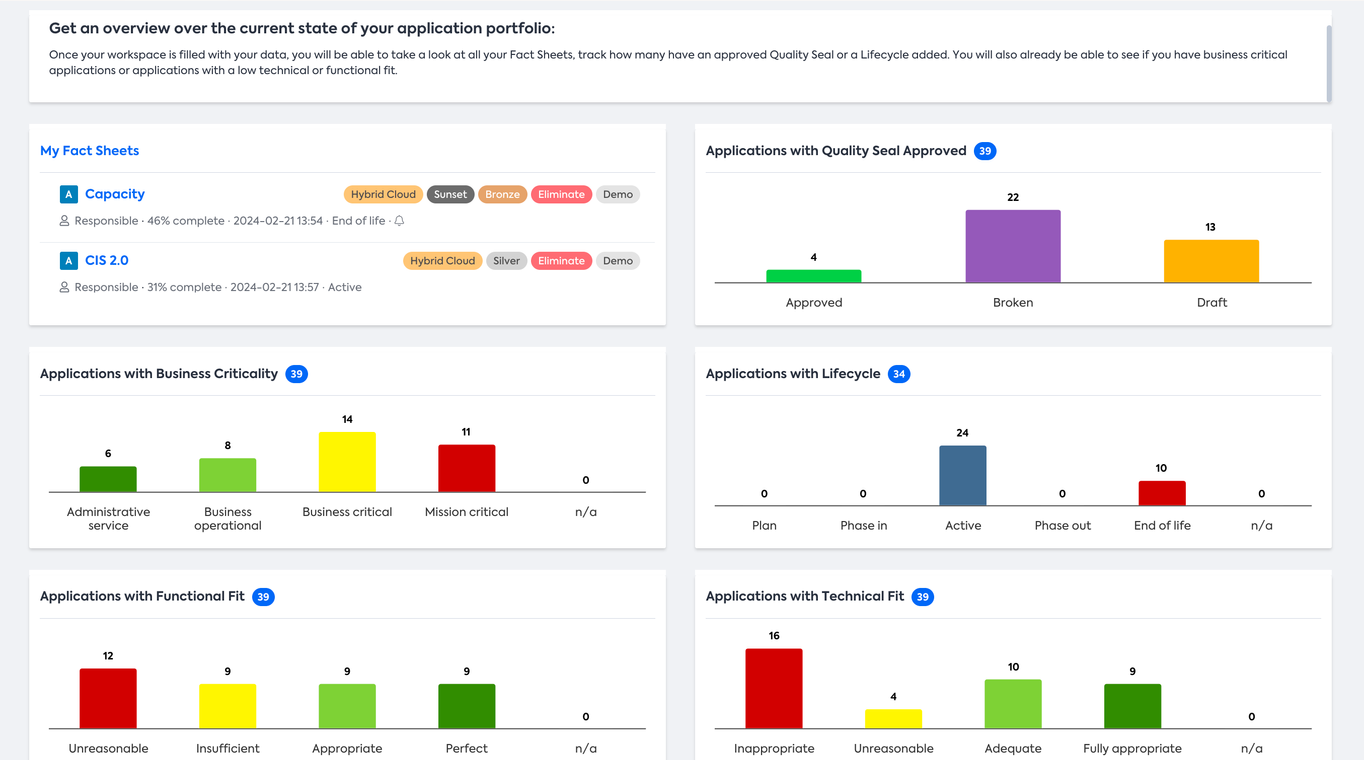
- Overview of personal Application Portfolio by attributes
- Overview of action items for collaboration in SAP LeanIX
- Advanced use: Overview of Application Landscape
Enablement Content
By default, the onboarding dashboard provides links to the SAP LeanIX product documentation for Application and Business Owners. These resources assist users in navigating the workspace and taking their initial steps in using SAP LeanIX during the onboarding process, including:
- What is SAP LeanIX and the value of Enterprise Architecture
- How to fill an Application Fact Sheet
- How to maintain data with Quality Seals and continuous updates
You can further add links to internal resources and relevant content available in your organization.
Note
As an Admin, when you set up the dashboard for other users, ensure to include your team's email in the placeholder next to 'contact your EA Team.'
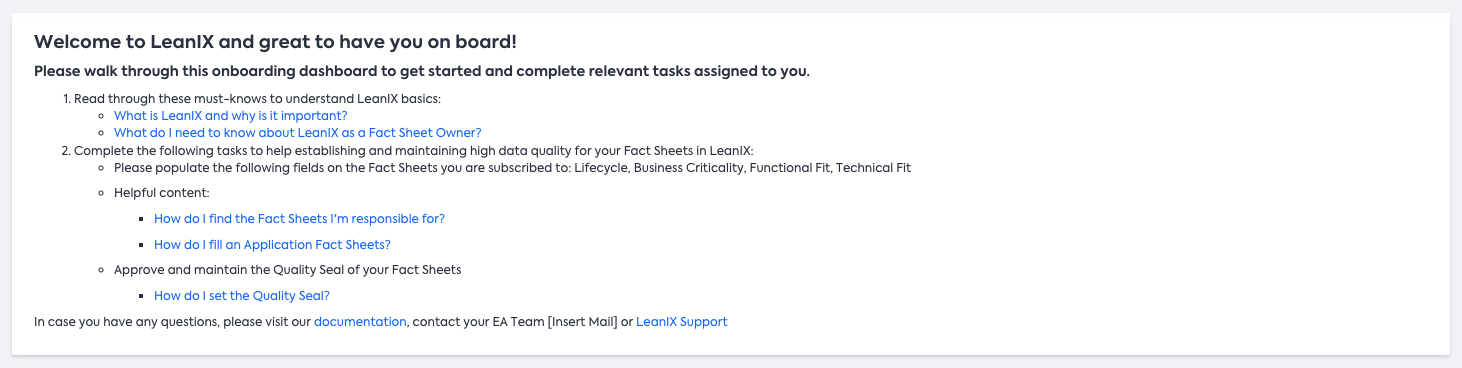
Enablement Content in the Onboarding Dashboard
Overview of Personal Application Portfolio
Each Fact Sheet Chart in this section displays the current status of the Application Portfolio, filtered based on the Fact Sheets the user has subscriptions to. Clicking on the columns leads to the inventory, to the list of Application Fact Sheets filtered by the corresponding attribute of the column.
Note
In the overview section, current staus of the Application Portfolio is visible only if subscriptions to Applications are in place. During the onboarding phase, it is a key requirement for the EA team to subscribe identified Application Owners to the respective Application Fact Sheets. Beyond onboarding, to maintain data integrity, ensure each Application has at least one Responsible Owner. Fact Sheet Owners should also subscribe themselves to new Fact Sheets on an ongoing basis.
- My Fact Sheets: Shows the list of all subscribed Fact Sheets. Clicking the link leads to the inventory, to the list of Application Fact Sheets filtered by subscription of the respective user.
- Applications with Quality Seal Approved / Business Criticality / Lifecycle / Functional Fit / Technical Fit: Each Fact Sheet Chart visualizes the number of Applications filtered by relevant attributes for the respective user. This helps in analyzing the application portfolio at a glance. For example, if you want to know how many of your Applications are mission critical, the Fact Sheet Chart on Business Criticality gives you that information. While the columns ‘n/a’ give information on Application Fact Sheets that have missing information, helping you easily identify Fact Sheets with missing attributes.
- Which Business Capabilities are supported by my Applications?: Shows the number of Applications filtered by Business Capabilities for the respective user. This provides a quick understanding of the key business functionalities and activities supported by the user's application portfolio.
- Which Organizations are supported by my Applications?: Shows the number of Applications filtered by Organizations for the respective user. This provides a quick understanding of which organizational groups and entities use the user's application portfolio.
Overview of Personal Application Portfolio
Overview of Action Items
This section focuses on collaboration and action items in the workspace. It shows a summary of Surveys and To-Dos that are assigned to the respective user. By clicking on the action items, the user is directed to the respective page and task.
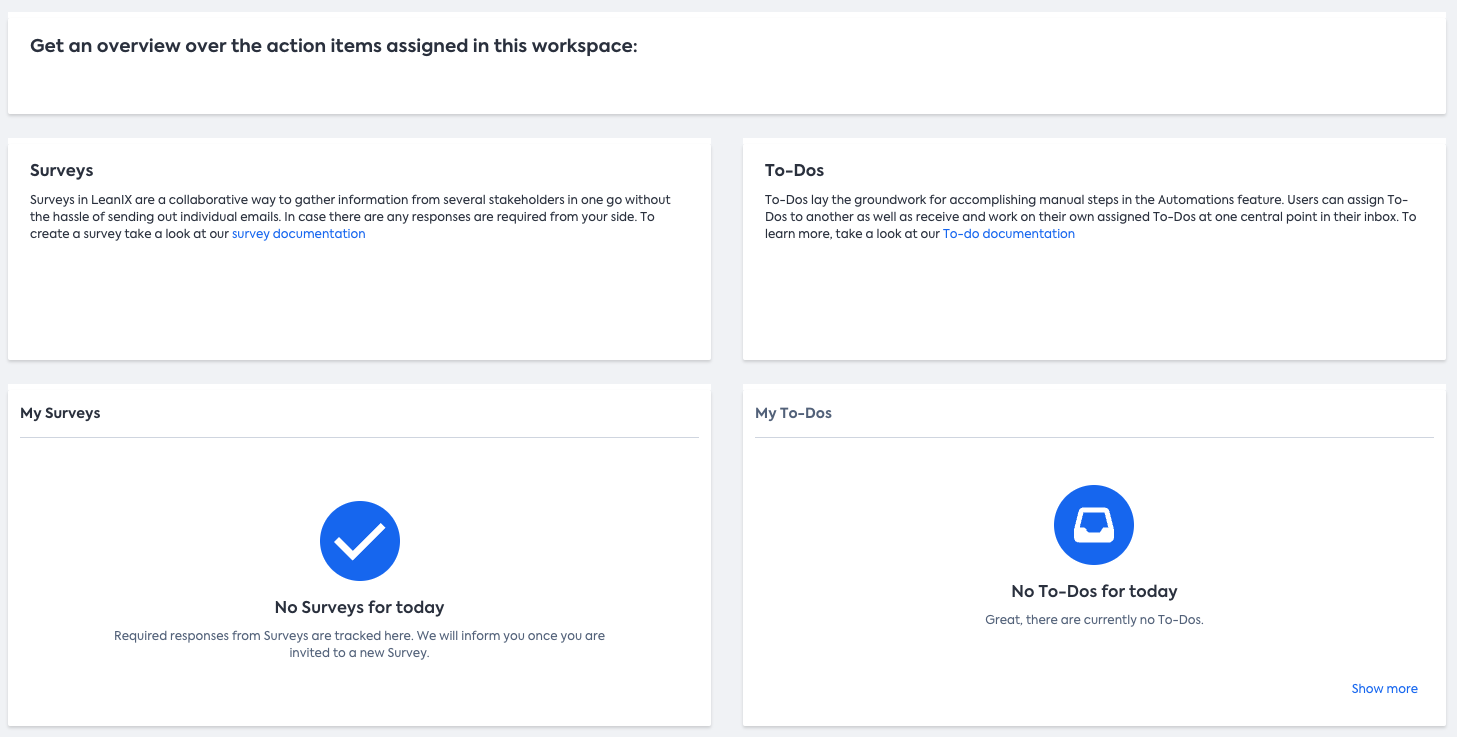
Overview of Action Items
Overview of Application Landscape
This section presents the Application Landscape report, offering a holistic view of your organization's IT landscape. It helps users understand how the applications support various business capabilities and provides a color-coded overview of application lifecycle information. You can also add other relevant reports and panels as per your needs
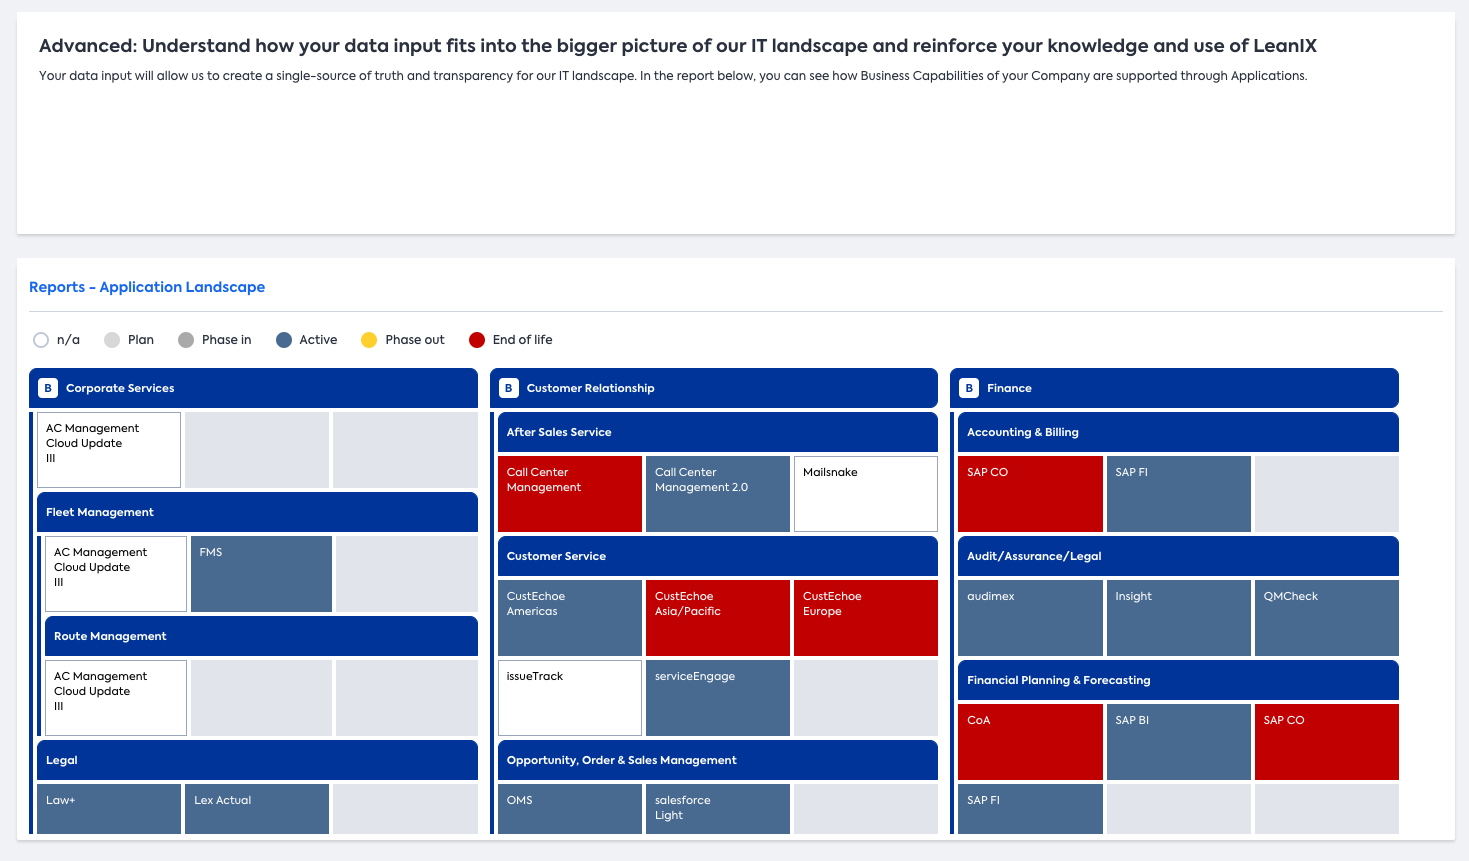
Overview of Application Landscape
Updated 2 months ago