
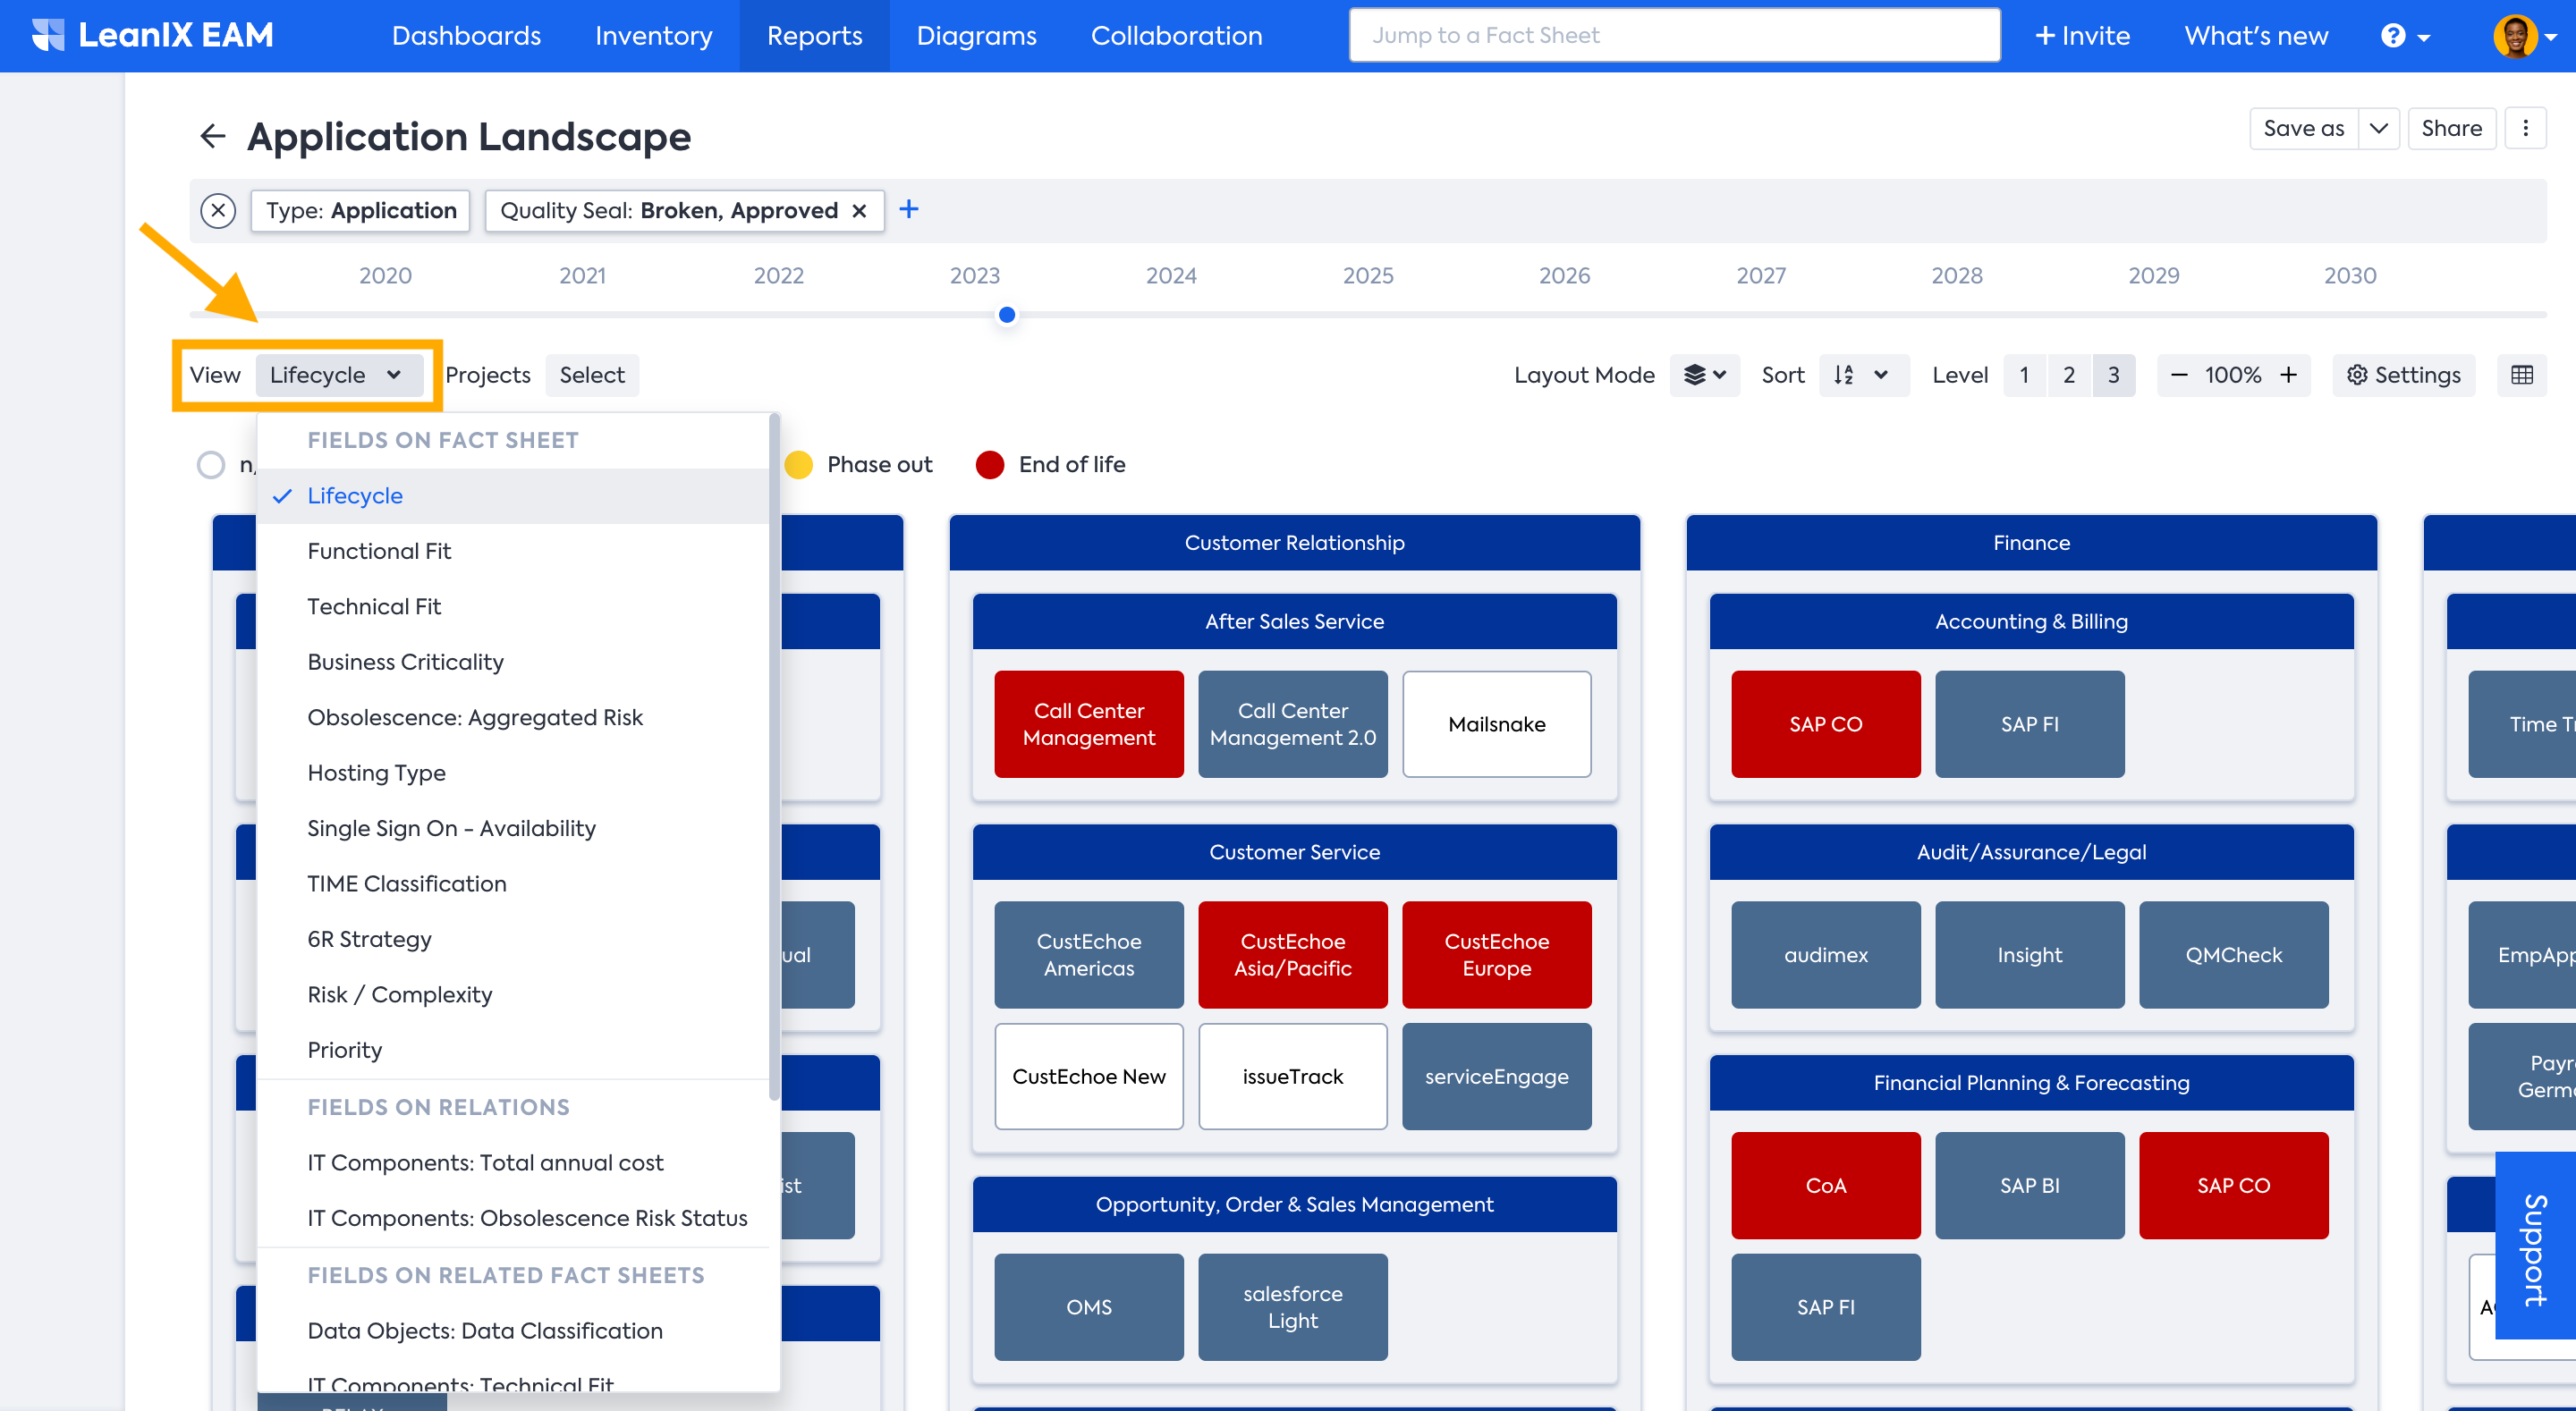
Report Views
Get an overview of standard report views and learn how to use custom views.
Introduction
Users are allowed to select from a range of distinct views when generating a report. Views are essentially attributes or relations, which are represented through a color-coded visualization. Each view provides a unique perspective on the data, enabling the user to gain better insights. Report views are selected from the View dropdown box on the report and can be based on the following:
- Fields on Fact Sheets: Attributes on the base Fact Sheet Type of the Report. In some cases, this attribute may be derived or calculated, e.g., Aggregated Obsolescence Risk.
- Fields on Relations: Attributes that you find in a relation between the base Fact Sheet Type and a related Fact Sheet, e.g., the Total annual cost attribute is stored in the relation between an Application and an IT Component.
- Fields on Related Fact Sheets: Attributes from Fact Sheets not shown in the report but related to the Fact Sheets displayed, e.g., the functional fit of an Application in an IT Component Landscape Report.
- Tags: User-defined tags. You can change the colors associated with tags. For more information, see Tagging.
Default Report Views
-
Lifecycle
In the Lifecycle view, the color indicates the current Lifecycle status of the Application, IT Component, or Project. SAP LeanIX differentiates five phases: Plan, Phase in, Active, Phase out, and End of Life. This view can indicate how many Applications are active and how many are phased in and out at any point in time. You need to be especially aware of the ones marked as the end of life – there might be a severe technology risk! -
Functional Fit
The view Functional Fit refers to an attribute on the Fact Sheet Type Application. In the Functional Fit view, the color classifies how well the application supports a Business function. SAP LeanIX differentiates between Unreasonable, Insufficient, Appropriate, and Perfect.
It can help you to identify applications that need to be replaced or at least worked on since they do not functionally fit their purpose. -
Technical Fit
The view Technical Fit refers to an attribute on the Fact Sheet types IT Component and on the Fact Sheet type Application. In the Technical Fit view, the color of the boxes indicates how appropriate an application or IT component is from the technical perspective. For example, maybe an underlying technology of a specific application fits or doesn’t fit the company’s strategy. SAP LeanIX differentiates between Inappropriate, Unreasonable, Adequate, and Fully Appropriate.
Please be aware of what technical fit you are looking at – the technical fit of an application or that of an individual IT component. -
Business Criticality
The view Business Criticality refers to an attribute on the Fact Sheet Type Application. In the Business Criticality view, the color differentiates how critical an application is for your Business. SAP LeanIX has the following classifications for Business Criticality: Administrative Service, Business Operational, Business Critical, and Mission Critical. -
Obsolescence: Aggregated Risk
The aggregated obsolescence risk view helps you assess if your applications are at risk due to the obsolescence of any technical components directly or indirectly connected to them. This risk is calculated based on the lifecycle status of the underlying IT components that support your applications. For more details on how the risk is aggregated, see Obsolescence Risk View Aggregation. -
Quality Seal
The Quality seal is a mechanism to assign accountability to the responsible or accountable user to approve the quality of a Fact Sheet whenever other users make a change to it. Quality Seal view enables more efficient analysis of items based on their quality seal states. It is available for Landscape, Matrix, and Roadmap reports. -
Completion
Completion score tells how complete the Fact Sheet data are. The Completion Score View allows you to quickly understand the progress of various Fact Sheets in a visually appealing and informative manner. Completion scores are divided into six buckets: 0-49%, 50-69%, 70-89%, 90-99%, and 100%, represented by a color gradient from red to green. This view is available for Landscape, Matrix, and Roadmap reports. -
Project Risk
The Project Risk is an attribute on the Fact Sheet Type Project. It evaluates if a project faces low, moderate, high, or severe risk. Depending on the effects on the quality, timeline, and/or budget of the project, dedicated management attention and support are needed. -
Project Status
The Project Status view shows the status of the project at the chosen point in time. If at least one of the projects associated with an application has the status Red, the color of the application is also Red. If none of the projects has the status Red, but at least one has the status Yellow, the application appears as Yellow. If all projects have the status Green, the application is also Green. If there are no associated projects, the application stays white. -
Initiatives: Business Value (Budget (OpEx + CapEx))
In the Project Portfolio Report, you have a view of your Capital expenditure and Operational expenditure. These are costs that can be maintained as an attribute on the Fact Sheet Type Initiative. It can further be broken down at the relation between Projects and Provider to indicate where the money was spent. In the Business Value view, the color of the boxes indicates the overall sum of the Budget. -
Initiatives: Business Value (NPV)
In the Project Portfolio Report, the Project Business Value indicates the financial improvements that can be achieved by the Project. It also refers to an attribute on the Fact Sheet Type Project. The benefit in Net Present Value is classified into Marginal benefit, Little benefit, Large benefit, and Significant benefit. -
Provider Quality
The Provider Quality identifies how well a certain Provider provides services to your company. SAP LeanIX differentiates between Unreasonable, Insufficient, Appropriate, and Perfect. It can help you to identify Providers that need to be replaced or at least worked on. -
Provider Criticality
The Provider Criticality identifies the appropriate criticality of the Provider. SAP LeanIX differentiates between Commodity, Operational, Tactical, and Strategic. In combination with the Provider Quality, the view can give you insights into where the company relies heavily on specific providers that do not provide the quality required and, therefore, should be replaced. -
IT Components/Applications: Total annual cost
The Total Cost of IT Components view shows the IT component cost for the different applications. The cost information is maintained in a field at the relation between IT Component and Application. The color gradation deepens as the cost increases. -
Tech Category/IT Components: Resource Classification
The Resource Classification is an attribute of the relation between the IT Component and Tech Category. It indicates whether the technology is an approved standard in the company or not. SAP LeanIX differentiates between Unapproved, Retiring, Conditional, Approved, and Investigating. -
Data Object/ Application: Data Classification
The Data Classification view shows the sensitivity level of the data that is used, manipulated, or utilized by an application. SAP LeanIX differentiates between Public unclassified, Sensitive, Restricted, and Confidential.
SAP LeanIX Technology Risk and Compliance - Report Views
In the SAP LeanIX Technology Risk and Compliance, three additional views are available for landscape, matrix, roadmap, and radar report. It includes:
- Obsolescence: Mitigated Risk Percentage
- Obsolescence: Missing Data Percentage
- Obsolescence: Unaddressed Risk Percentage
To learn more about these views, see Technology Obsolescence Risk Views in Reports.
Custom Views
In addition to standard report views, you can create custom fact sheet fields and tag groups that can be applied as views in reports.
-
Custom fact sheet fields: Custom fields do not automatically appear in report views. To show a custom field in report views, in the fact sheet configuration, select a field, navigate to the Options tab in the sidebar indicated by the gear icon, enable the Include in views toggle, then save the changes. This option is only available for certain field types. For more information, see Showing Fields in Views.
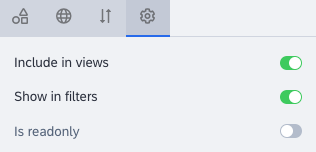
Options Tab in the Field Configuration Sidebar on the Fact Sheet Configuration Page
-
Tag groups: Non-empty tag groups of the Single mode automatically appear in report views. You can create more tag groups to show them in report views. For more information, see Tagging.
To understand and customize aggregation methods in SAP LeanIX views and learn how the obsolescence risk view is aggregated based on IT component lifecycle statuses, see Views Aggregation.
Updated 17 days ago