
Diagrams
Overview
SAP LeanIX serves as the single source of truth for enterprise architecture management, bringing transparency of IT landscapes to all contributors and democratizing architecture knowledge. With the Free Draw and Data Flow diagram editors, SAP LeanIX provides advanced visual modeling capabilities. Diagram editors will be indispensable tools for Enterprise Architects as they require the ability to visually represent the organizations' IT landscape or specific areas with particular emphasis.
In this documentation, you will learn why and how Free Draw and Free Flow diagram editors are helpful, what are the various features and how to use the editors to model the enterprise architecture.
What are diagrams, and why are they needed?
Diagrams are a means of constructing visual models of the structure of enterprise architecture. They help understand important aspects of enterprise architecture from various perspectives by enabling you to work with Inventory items and interactively visualize the architecture and data flow from their own point of view.
The larger an organization, the greater the complexity of its IT environment. Diagrams are essential for managing complex architecture by breaking down and visualizing the structure into smaller scopes. They allow you to define their own boundaries and domains, allowing them to focus on specific aspects of their enterprise architecture. Diagrams assist individuals in making better decisions.
Benefits
- Diagrams support you in visualizing architecture quickly and efficiently to understand how various architectural elements are connected and to illustrate the flow of data through Interfaces.
- Diagrams in SAP LeanIX enable leveraging data from the Inventory. They keep visualizations up to date by reflecting any changes made in the Inventory. Learn more on how data from Inventory is synchronized here: Updates from Inventory.
- Create as-is and target architecture pictures appealingly and more understandably and use them for effective communication.
- You have the ability to customize aspects of architecture by adding shapes and images not yet represented in the Inventory and thereby visualize models that are not yet there.
- Use diagrams to explore the architecture more flexibly than the reports, with more detailed drill-downs and dependency visualization.
- In diagrams, you also have the flexibility to include and work with all Fact Sheet types simultaneously to explore different relations.
- Access Fact Sheets from within the diagram: Keep architecture diagrams and Inventory data all in one place.
- Create Fact Sheets and establish relations from within the diagram to create Inventory data.
- Use diagrams to document different points in time of your architecture by developing and saving different versions of the progress.
- Include diagrams in presentations to share valuable insights with stakeholders. For more information, see Presentations.
SAP LeanIX Diagram editors
SAP LeanIX offers Free Draw, Data Flow, and Lucidchart to create diagrams:
- Free Draw is a feature that enables you to create custom diagrams and visual representations of their enterprise architecture. It offers the flexibility to design diagrams from scratch using different shapes, symbols, and connectors.
- Data Flow, on the other hand, focuses on illustrating the flow of data within an environment. You can add applications and their interfaces to gain a better understanding of how data moves within their architecture.
- The Lucidchart integration allows you to seamlessly work with diagrams within the Lucidchart application, enhancing the diagramming capabilities.
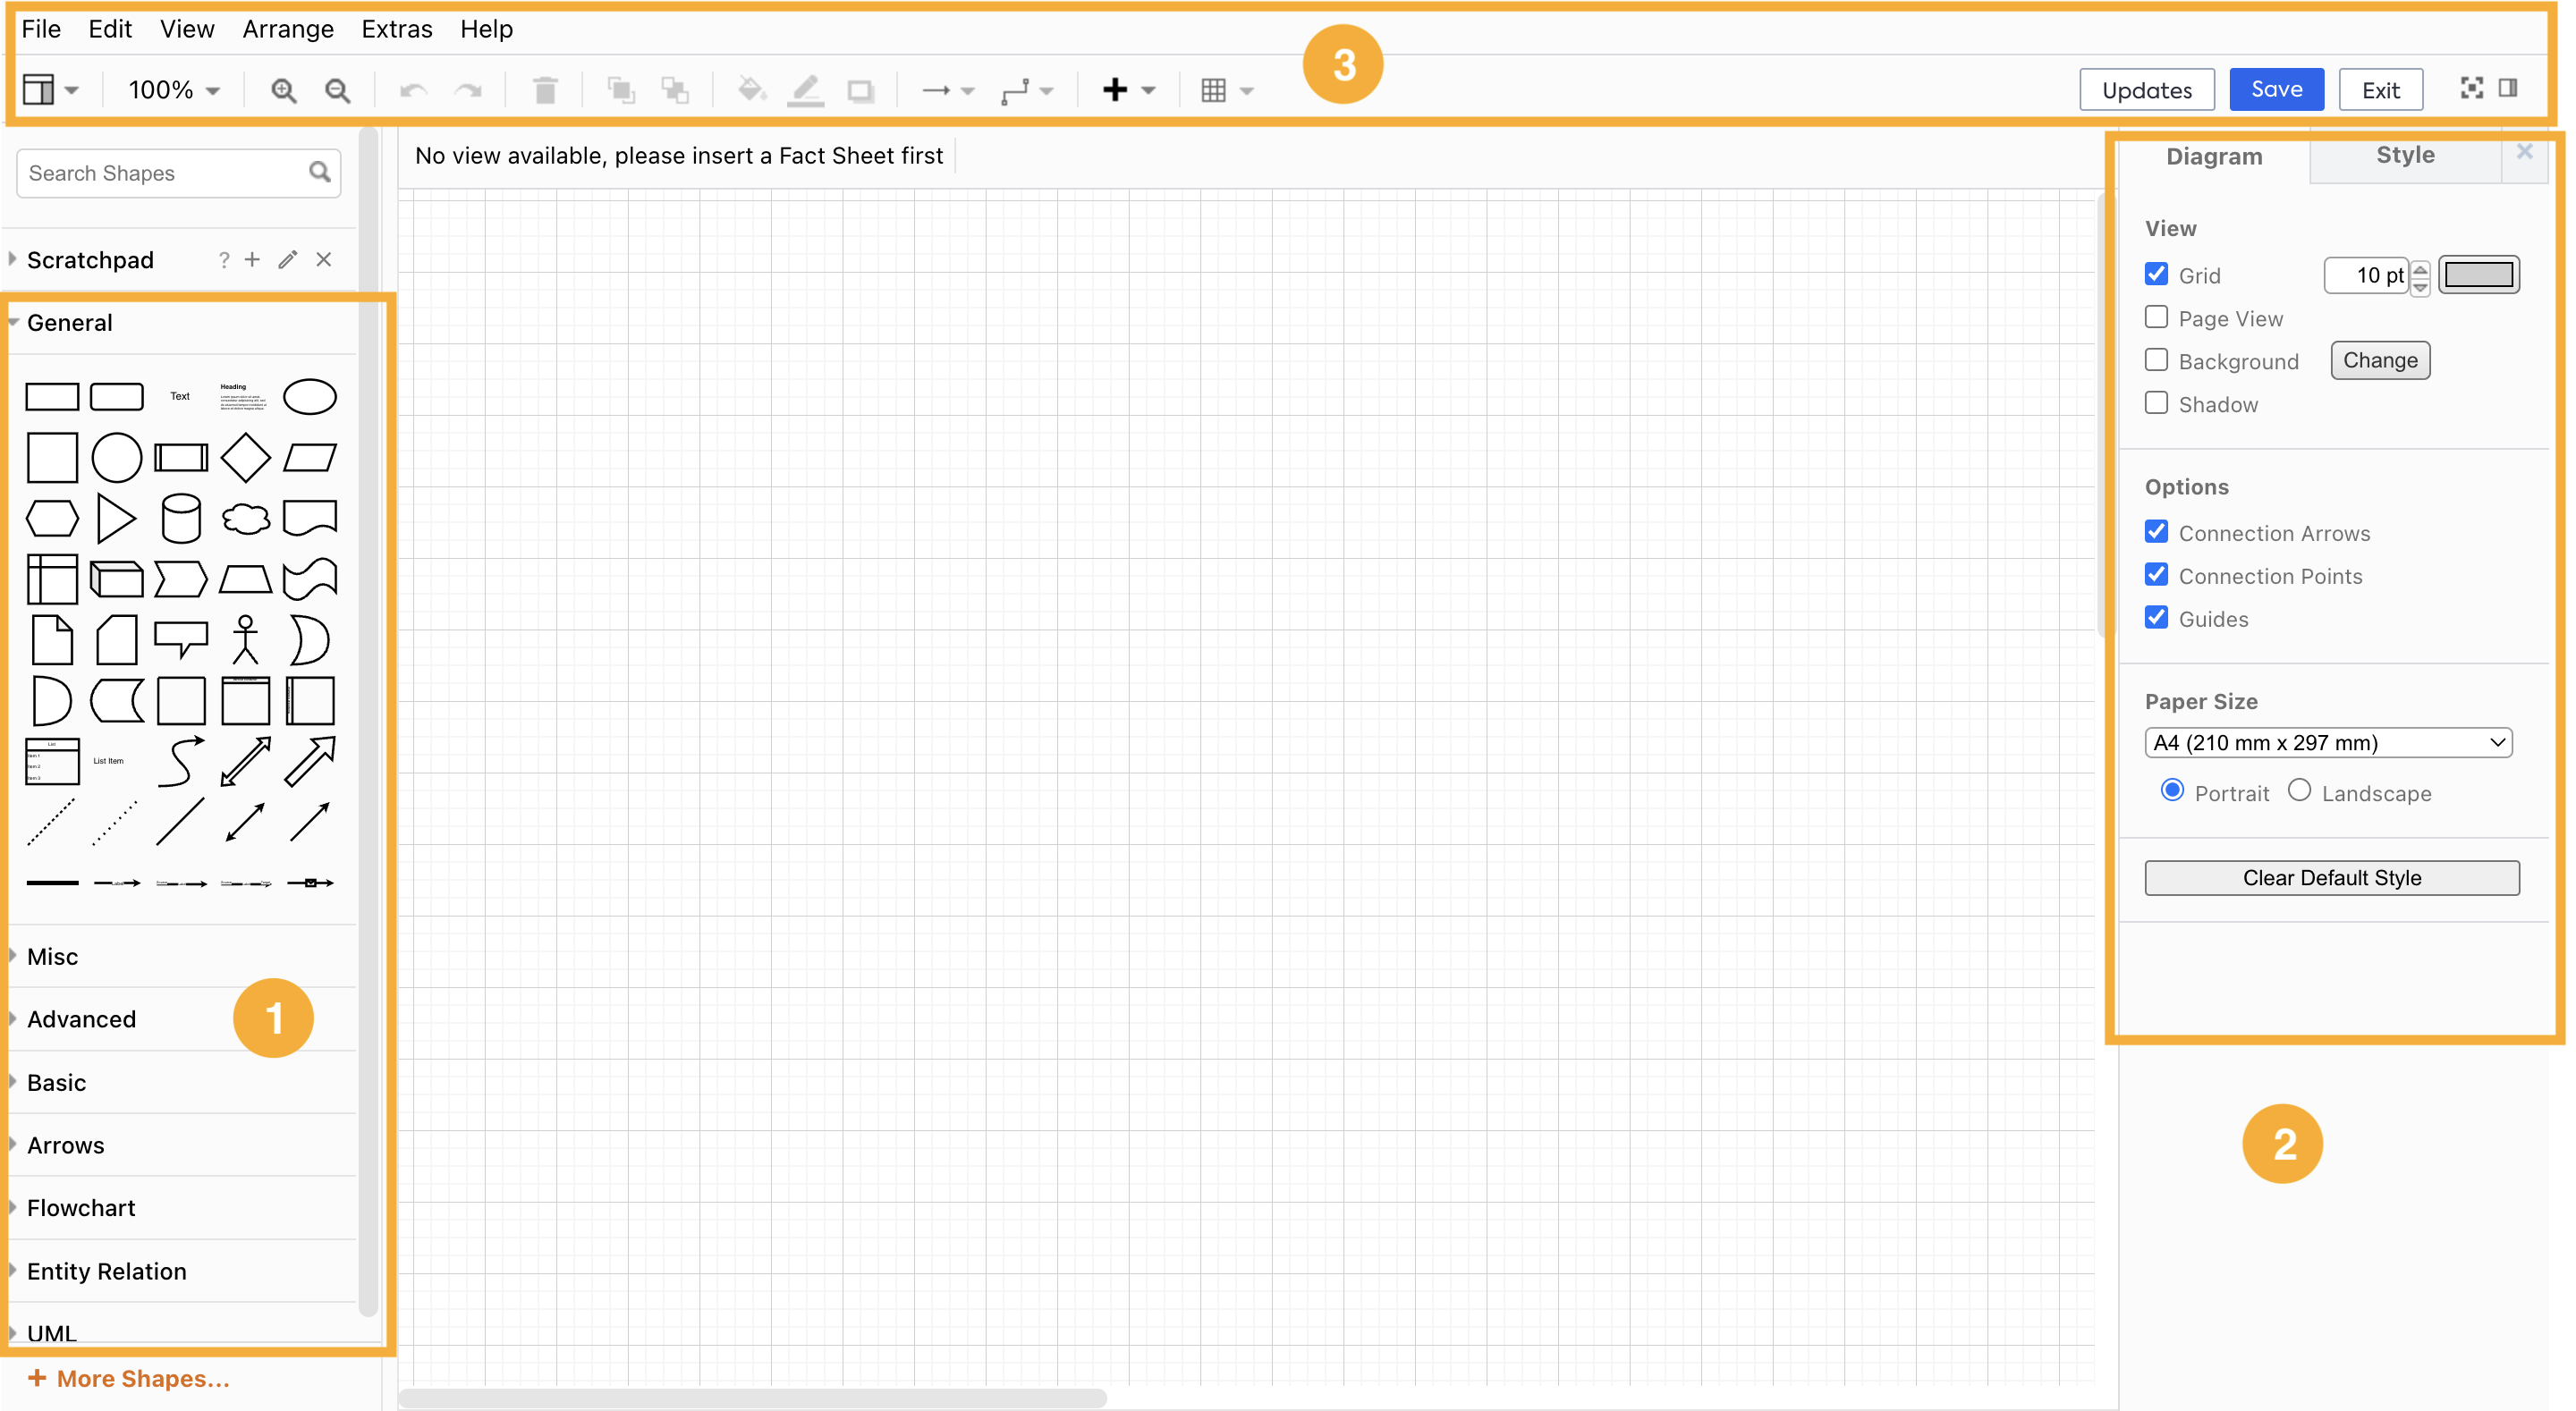
Diagram Editor Layout
Both Free Draw and Data Flow have a similar layout.
- On the left side of the drawing canvas is a shape library with logical shape groups (e.g., General, Advanced, Flowchart). Expand or collapse each shape library by clicking its name.
- The format panel on the right side holds options and properties to arrange and style shapes, connectors, and text to build the diagrams.
- The Menu and Toolbar are located on the top. Some of the menu entries will not be selectable depending on what you have selected in your diagram.
Shapes representing any architectural element, descriptive text, or lines to connect shapes can be added to the canvas via drag and drop. They can be arranged, and their color and style can be changed from the options available in the format panel and toolbar.
Note
The SAP LeanIX Diagram editor leverages the capabilities of draw.io editor. For more detailed instructions on using the editor's features, see draw.io Documentation.
However, note:
- The SAP LeanIX Diagram editors are optimized specifically for SAP LeanIX, some of draw.io features may not be available in SAP LeanIX Diagrams.
- Diagrams are stored only in your SAP LeanIX workspace and are integrated with the inventory.
Explore and learn on the following pages the features of the two Diagram Editors and how to use them.
Diagram Permissions
Default diagram permissions for members and viewers are as follows:
| Actions | Member | Viewer |
|---|---|---|
| Create new diagram | Yes | Yes |
| Edit a diagram | Default diagrams and shared diagrams that users lack write permission for can be edited after saving them as new using the Save as option. Once saved, the new diagram becomes the user's own and hence can be edited Shared diagrams that users have write permission for can be edited | Default diagrams and shared diagrams that users lack write permission for can be edited after saving them as new using the Save as option. Once saved, the new diagram becomes the user's own and hence can be edited Shared diagrams that users have write permission for can be edited |
| Delete a diagram | Yes: User’s own diagrams Shared diagrams for which the user has write permission No: Shared diagrams for which the user doesn’t have write permission Default diagrams | Yes: User’s own diagrams Shared diagrams for which the user has write permission No: Shared diagrams for which the user doesn’t have write permission Default diagrams |
| Share a diagram | Yes | Yes |
| Add to collection | No | No |
Managing Diagrams
Searching, Filtering, and Sorting
Search, filter, and sort functions help you streamline navigation, save time, and ensure better control over large sets of diagrams.
- Search: Quickly find a specific diagram using keywords.
- Filter: Narrow down diagrams to your required subset based on criteria like ownership, read and write permissions, creation date, modification date, and type of diagram.
- Sort: Organize diagrams by attributes such as name, date, or relevance to find what you need faster.
Searching, Filtering, and Sorting Diagrams
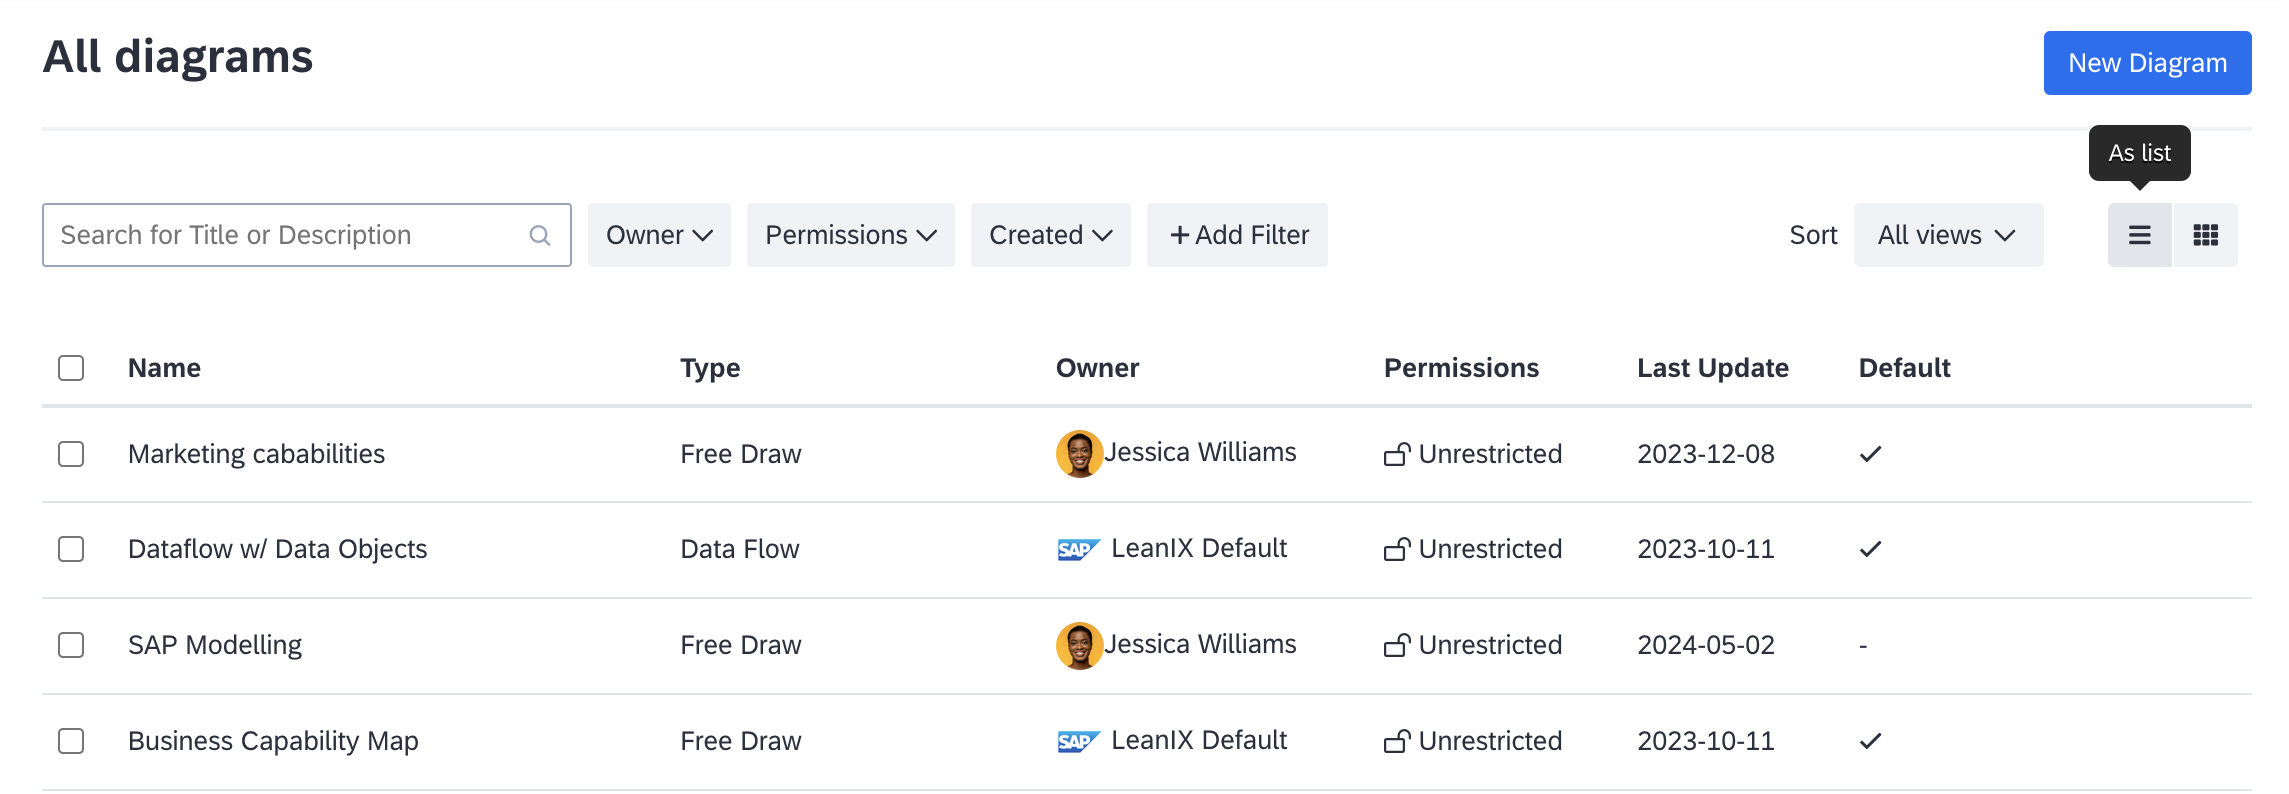
Switching Between List and Grid View
You can switch to the list view by clicking the hamburger menu icon at the top right. The list view presents information in a detailed table format, making it easier to consume the information and perform bulk actions efficiently.
Switching Between List and Grid View
Managing Ownership and Permissions
Admin users can view all diagrams, change ownership, and update read/write permissions, regardless of the original permissions set by their creators. This ensures critical content remains accessible, even if users forget to share their diagrams or leave the organization without updating access rights.
Note
Admins can view all diagrams by checking the Show All Read & Write Restricted Workspace Diagrams checkbox under Permissions dropdown menu.
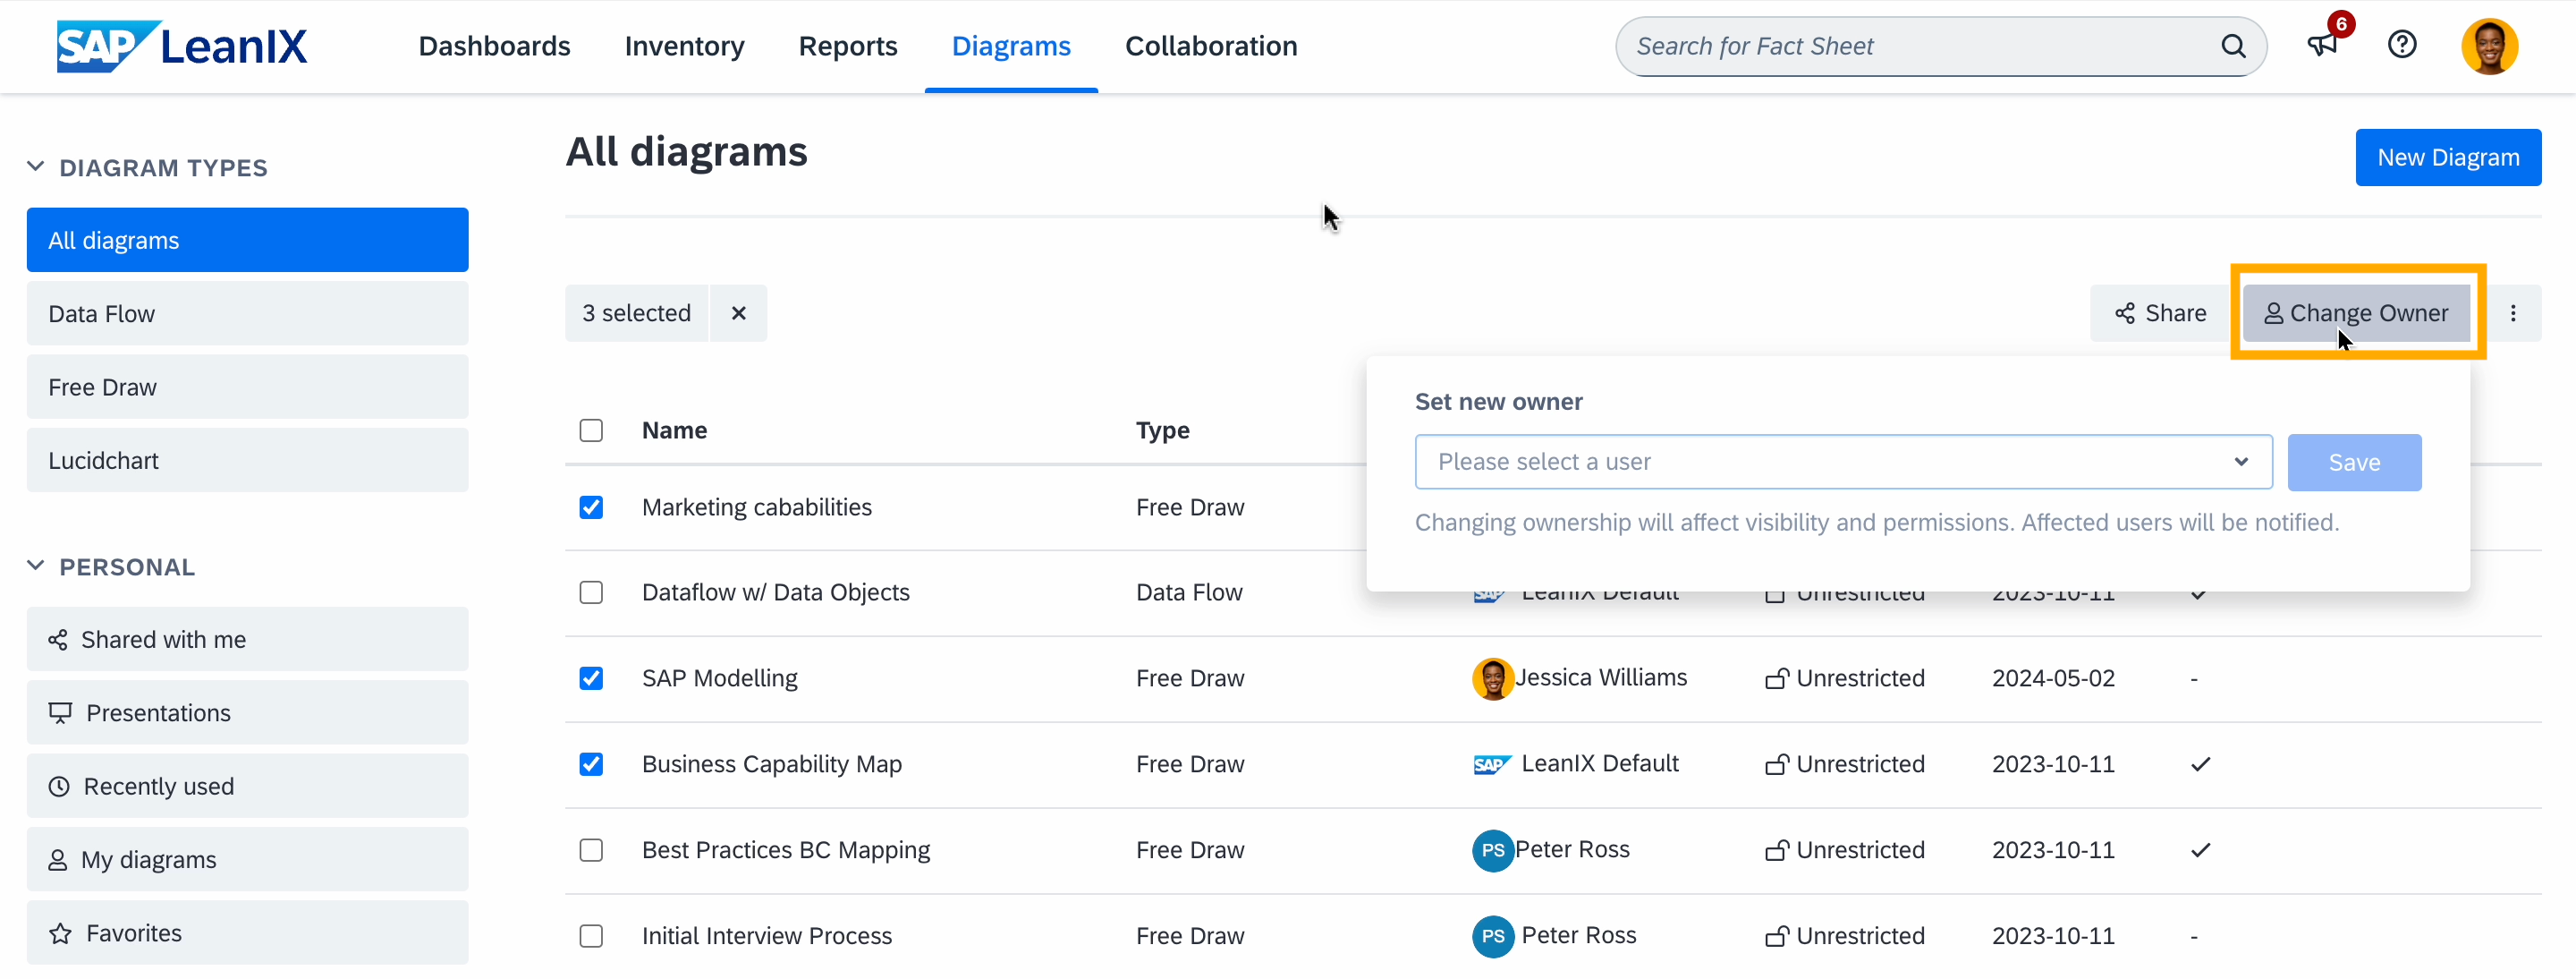
To change ownership, follow these steps:
- Switch to list view by clicking the list view icon at the top right.
- Select the diagrams for which you want to change ownership.
- Click Change Owner at the top right of the list.
- In the overlay that appears, search for and select the new owner.
- Confirm the change by clicking Save in the overlay.
Changing Ownership of Diagrams
Read/write permissions can only be changed individually. However, applying permission or ownership filters can help narrow down the list, making the process easier for you.
To change permission, follow these steps:
- Click the three-dot menu on the diagram.
- Select Diagram details.
- On the resulting page, navigate to the Permissions tab.
- From the Permission Type drop-down list, select the appropriate permission.
- Click Save to confirm the change.
Diagram Views
When working with diagrams, you can select a specific view in the Views list to tailor the visualization to your needs. You can select fact sheet fields, fields on relations, fields on related fact sheets, and tags from Single mode tag groups.
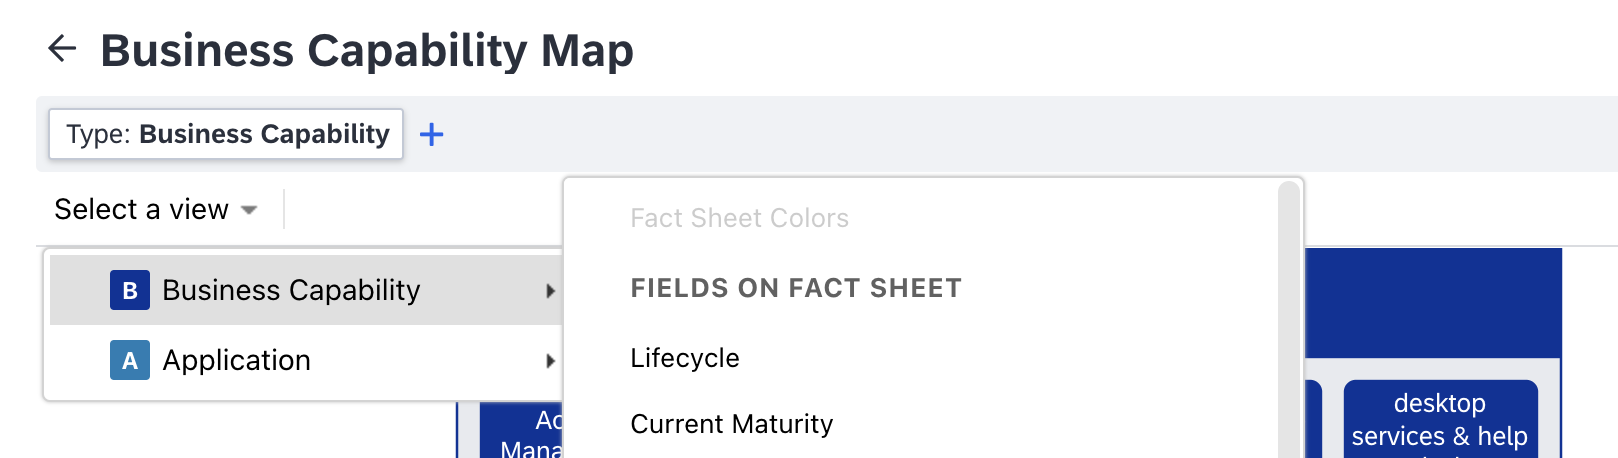
Selecting a Diagram View
In addition to standard diagram views, you can create custom fact sheet fields and tag groups that can be applied as views in diagrams.
-
Custom fact sheet fields: Custom fields do not automatically appear in diagram views. To show a custom field in diagram views, in the fact sheet configuration, select a field, navigate to the Options tab in the sidebar indicated by the gear icon, enable the Include in views toggle, then save the changes. This option is only available for certain field types. For details, see Showing Fields in Views.
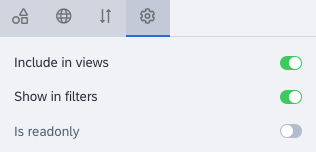
Options Tab in the Field Configuration Sidebar on the Fact Sheet Configuration Page
-
Tag groups: Non-empty tag groups of the Single mode automatically appear in diagram views. You can create more tag groups to show them in diagram views. For more information, see Tagging.
Updated 25 days ago