
Metrics
Metrics help you to display KPIs and their development over time in the context of the right Fact Sheet.
Metrics V2
This page documents V2 of the Metrics Service. If you used Metrics V1 in the past, you will notice that the API is more explicit than in V1.
In case you have existing scripts or processes based on Metrics V1, we've got you covered - all Metrics V1 URLs will keep working and behave just as before.
Overview
With metrics, you can store time series data in SAP LeanIX and create interactive charts to display the data. In addition the data can be linked to Fact Sheets, presented on the Dashboard or be displayed within the "Reports" area.
Note
Metrics are not standard reports but a way to create charts and visuals from your data.
To navigate to metrics, in the administration area, go to the Metrics section.

Metrics Page in the Administration Area
Creating a Chart
Once you've imported data points through the API, the measurement appears in your workspace. Now you can create a chart and define other parameters.
To create a chart, follow these steps:
-
On the Metrics page, on the measurement for which you want to create a chart, click the plus icon. You land on the page for creating a chart.
-
On the Chart tab, specify general chart parameters.
-
To add a data series to a chart, navigate to the Series tab and specify the required parameters. The field name corresponds to the key fields in the measure JSON object. You can add multiple series to a chart.
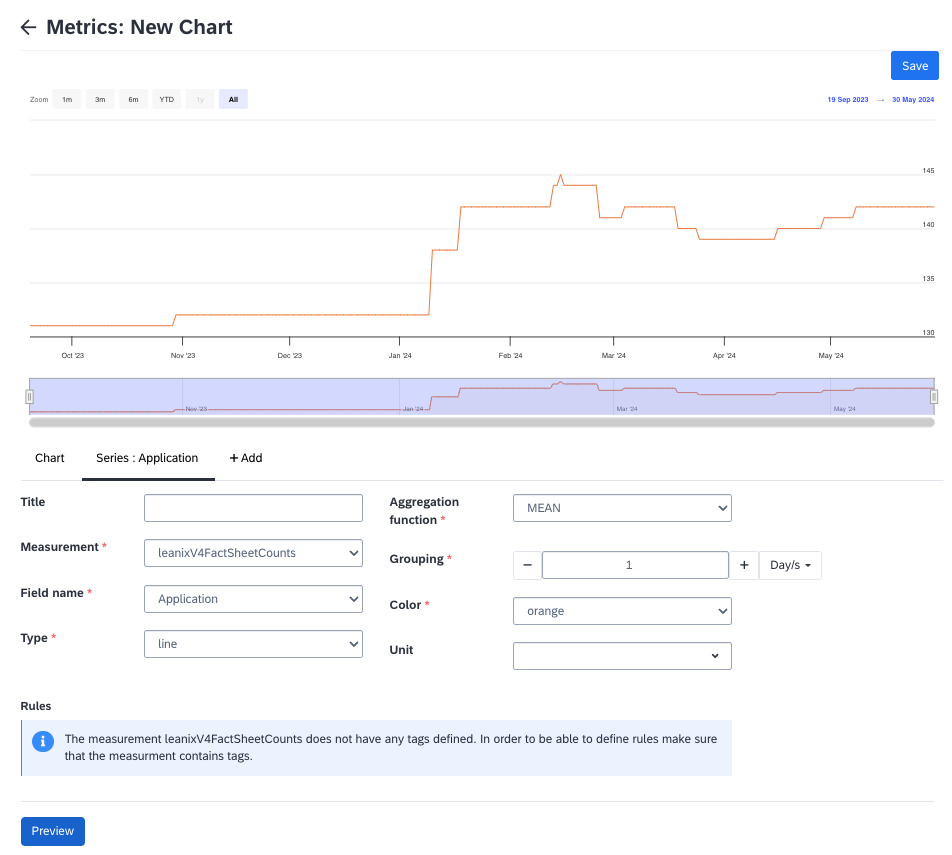
Creating a Chart for a Measurement
-
To preview data on the chart, click Preview.
-
Click Save.
The chart is saved. You can view, clone, or delete charts.
Developer Resources
Definitions
| Key | Definition |
|---|---|
| Schema (V1 name: "measurement") | Schemas contain data points stored over time, which are related to the same topic. The schema defines which Metrics (numeric attributes) and Dimensions (string attributes to filter in charts) exist in points. |
| Point | Each data-point is stored for a specific moment (timestamp) and has one or more values for that instant of time. The values are stored in Metric attributes. |
| Metric attributes (V1 name: "fields") | Each data-point stores has one or more Metrics, which contain numeric values that have been collected for the instant of time associated with the data point. When creating a chart the values of the fields can be displayed as a series. For that different aggregation functions are available such as COUNT or SUM. |
| Dimension attributes (V1 name: "tags") | Furthermore a data-point has Dimension attributes, consisting of a key and a value. The Dimensions further describe a data point and enable to filter for certain data points when displaying a chart for different contexts. |
Importing a Metric
To import your first metric, go to the OpenAPI Explorer. To navigate to the OpenAPI Explorer from your workspace, on the navigation bar, select About SAP LeanIX on the Help menu (question mark icon), then select Browse API.
You need to generate an API Token by using the Technical User functionality and enter it on the top right to execute queries directly from the API documentation.
You can explore the full list of endpoints and associated operations in the OpenAPI Explorer.
Change to Metrics V1
Schemas are what was called Measurements in Metrics V1. In contrast to V1, schemas are not created or altered implicity by writing points. Instead, a schema has to be created explicitly via the schemas API.
Use this code snippet as body to POST /schemas to create a new schema named "My First Metric":
{
  "name": "My First Metric",
  "description": "This is a test metric for SAP LeanIX EAM docs",
  "attributes": [
    {
      "name": "Availability",
      "type": "metric"
    },
    {
      "name": "factSheetID",
      "type": "dimension"
    }
  ]
}
This call will return the UUID of the newly created schema. Then write a point to this schema by sending a POST request to /schemas/<schema_uuid>/points with the following body:
{
  "timestamp": 1621608440,
  "Availability": 100,
  "factSheetID": "<your Fact Sheet ID>"
}
You need to adapt to your context. Now, go to Admin -> Metrics, and you should see the first measurement.
Using Python to Import Metrics
We provide a Python script that enables you to import metrics. See Import Metrics in our GitHub repository.
API Documentation
For more details on the Metrics API and supported functionalities, have a look at the
OpenAPI docs. There, all endpoints are explained with examples and descriptions.
Using the Integration API
The Integration API provides the ability to import and export data using a generic SAP LeanIX Data Interchange Format (LDIF). LDIF is a JSON format with a very simple structure described in the following sections. All mapping and processing of the incoming and outgoing data is done using "Data Processors" that are configured behind the API. Configuration of the processors can be done using the UI, please see the Setup page for more information. The configurations can be managed using the Integration API as well.
For more information, refer to:
Steps to Create Integration
| Steps | Notes |
|---|---|
| Review Swagger API documentation | |
| Schemas should contain the uploaded data, split into Points | Each Point has a unique time stamp |
| Charts describe how to represent the Schema graphically | For example as a Bar Chart |
| Charts contain Rules which define how the measurement data is mapped to your Fact Sheets (one option is to map using the External ID) |
Updated 2 months ago