
KPIs
Create your own key performance indicators (KPIs) based on workspace data and add them on dashboards.
Overview
The following predefined dashboards contain KPIs:
- Application Portfolio Management Dashboard
- Application Rationalization Dashboard
- Obsolescence Risk Dashboard
You can configure your own KPIs to create metrics relevant for your organization in the KPIs section of the administration area.
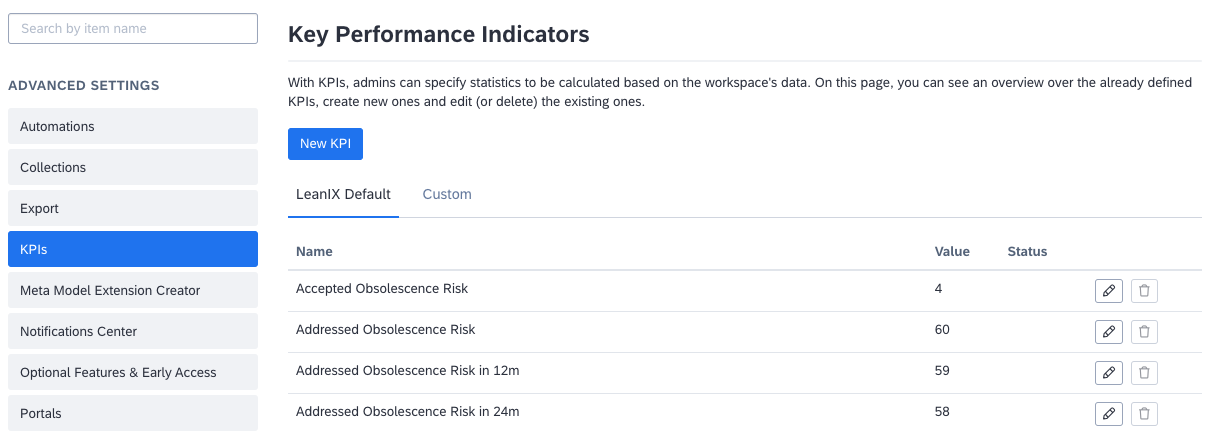
KPIs Section in the Administration Area
KPI Details
KPI details include the following:
- Name
- Description
- Filter (to describe on which fact sheets to aggregate data)
- Aggregation or calculation rule
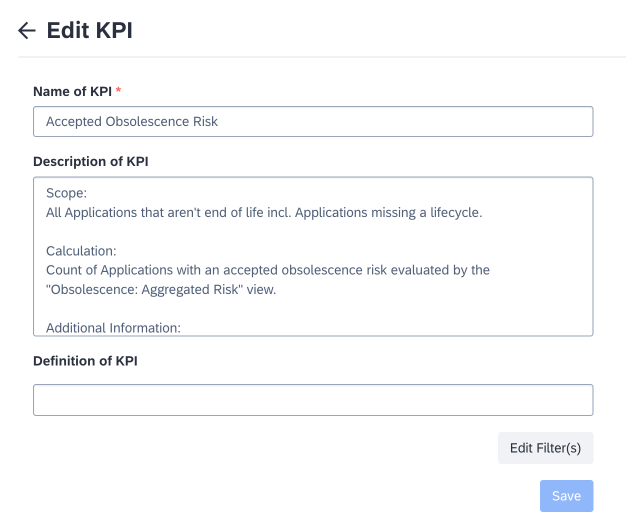
Editing a KPI
The initial calculation of a specified KPI initially happens upon its creation (which may take from a few seconds up to a few minutes). The KPIs are then calculated on a nightly basis, allowing for trend analysis and visual representation of the historical values.
KPI History
Historical values of a KPI are not calculated or recalculated. This also means, if you are changing the calculation rule for an existing KPI, the historical values may no longer be comparable to the new calculations. Consider creating a new KPI instead.
Lifecycle Filter
A custom KPI with a lifecycle filter uses a relative date, e.g., today, but it points to a hard-coded date.
Creating a KPI
To configure KPIs, navigate to the KPIs section in the administration area. Here, you can view all defined KPIs for the workspace. The list of KPIs includes the following:
- Predefined KPIs
- Custom KPIs configured by admin users
To create a new KPI, on the KPIs page, click New KPI. On the page that appears, enter a name and description for the KPI, then set a filter and a calculation rule. This can be done in two modes:
- Simple configuration (using an Inventory filter and having only counts of Fact Sheets for aggregation in that filter). You can configure simple KPIs without coding experience by selecting the appropriate filter.
- Advanced configuration that requires JSON code. To learn more, see Advanced Mode for Configurable KPIs.
Note
Advanced configuration for KPIs is only available in workspaces created before April, 2024.
Showing a KPI on a Dashboard
To display your new KPI within a dashboard, a dedicated dashboard panel is available. To show a KPI on a dashboard, follow these steps:
-
On either a new dashboard or a dashboard that you are allowed to edit, select a panel named KPI Panel and drag it to the dashboard.

-
In the dialog that appears, configure the panel by specifying the following details:
- Panel title
- Main KPI (the KPI that will be shown on top of the panel, including a preview of the history)
- Other KPIs

-
Save the changes.
The following image shows an example KPI panel on a dashboard.

Simple KPIs
In simple KPIs, a regular inventory filter for fact sheets is used. The only available aggregation is Count.
End of Month/Year lifecycle filters
Lifecycle filters with "point of time" set to "End of Month" or "End of Year" will be saved with the point of time hardcoded to the respective date at the time of KPI creation for technical reasons.
Example: A KPI is created on March 15 with a filter for Applications which are in lifecycle phase "Active" at the end of the month. The KPI will be saved with the fixed date March 31 for the lifecycle filter, which is the "End of Month" at the time of KPI creation. In April, the KPI will still be calculated based on the Fact Sheets which were active on March 31, not on April 30.
Note that this restriction does not apply to Today filters. Lifecycle filters with "point of time" set to "Today" will be evaluated for the date of KPI calculation each night.
Updated 9 months ago