
Step 5: Monitor, Measure, and Report Risk Mitigation Efforts
Monitor risk remediation initiatives and measure progress with reports and dashboard KPI panels. Enhance transparency and engagement through effective and targeted communication.
Regular monitoring and evaluation are essential to ensure that mitigation efforts remain effective and aligned with organizational goals and priorities. SAP LeanIX Technology Risk and Compliance provides tools and features to track the progress of risk management initiatives, measure KPIs, and generate reports for stakeholders. This ensures continuous improvement and informed decision-making in your organization's technology risk management strategy.
Monitor and Measure Progress
Use the dedicated obsolescence risk management dashboard that is part of SAP LeanIX Technology Risk and Compliance for a centralized, real-time overview of current and future risk statuses for applications. The KPI panels of the dashboard offer insights into the number of applications facing obsolescence risk, both currently and projected into the future. This helps you monitor the evolving situation, as dealing with obsolescence risks becomes very hard when the problem scales and hundreds of IT components start getting outdated.
The dashboard also offers visibility into addressed obsolescence risk, helping you track the progress of risk mitigation initiatives. Additionally, the Unaddressed Obsolescence Risk - Details panel offers specific information on mission-critical applications and IT components reaching end-of-life status, aiding proactive risk management to prevent critical risks from impacting the business.
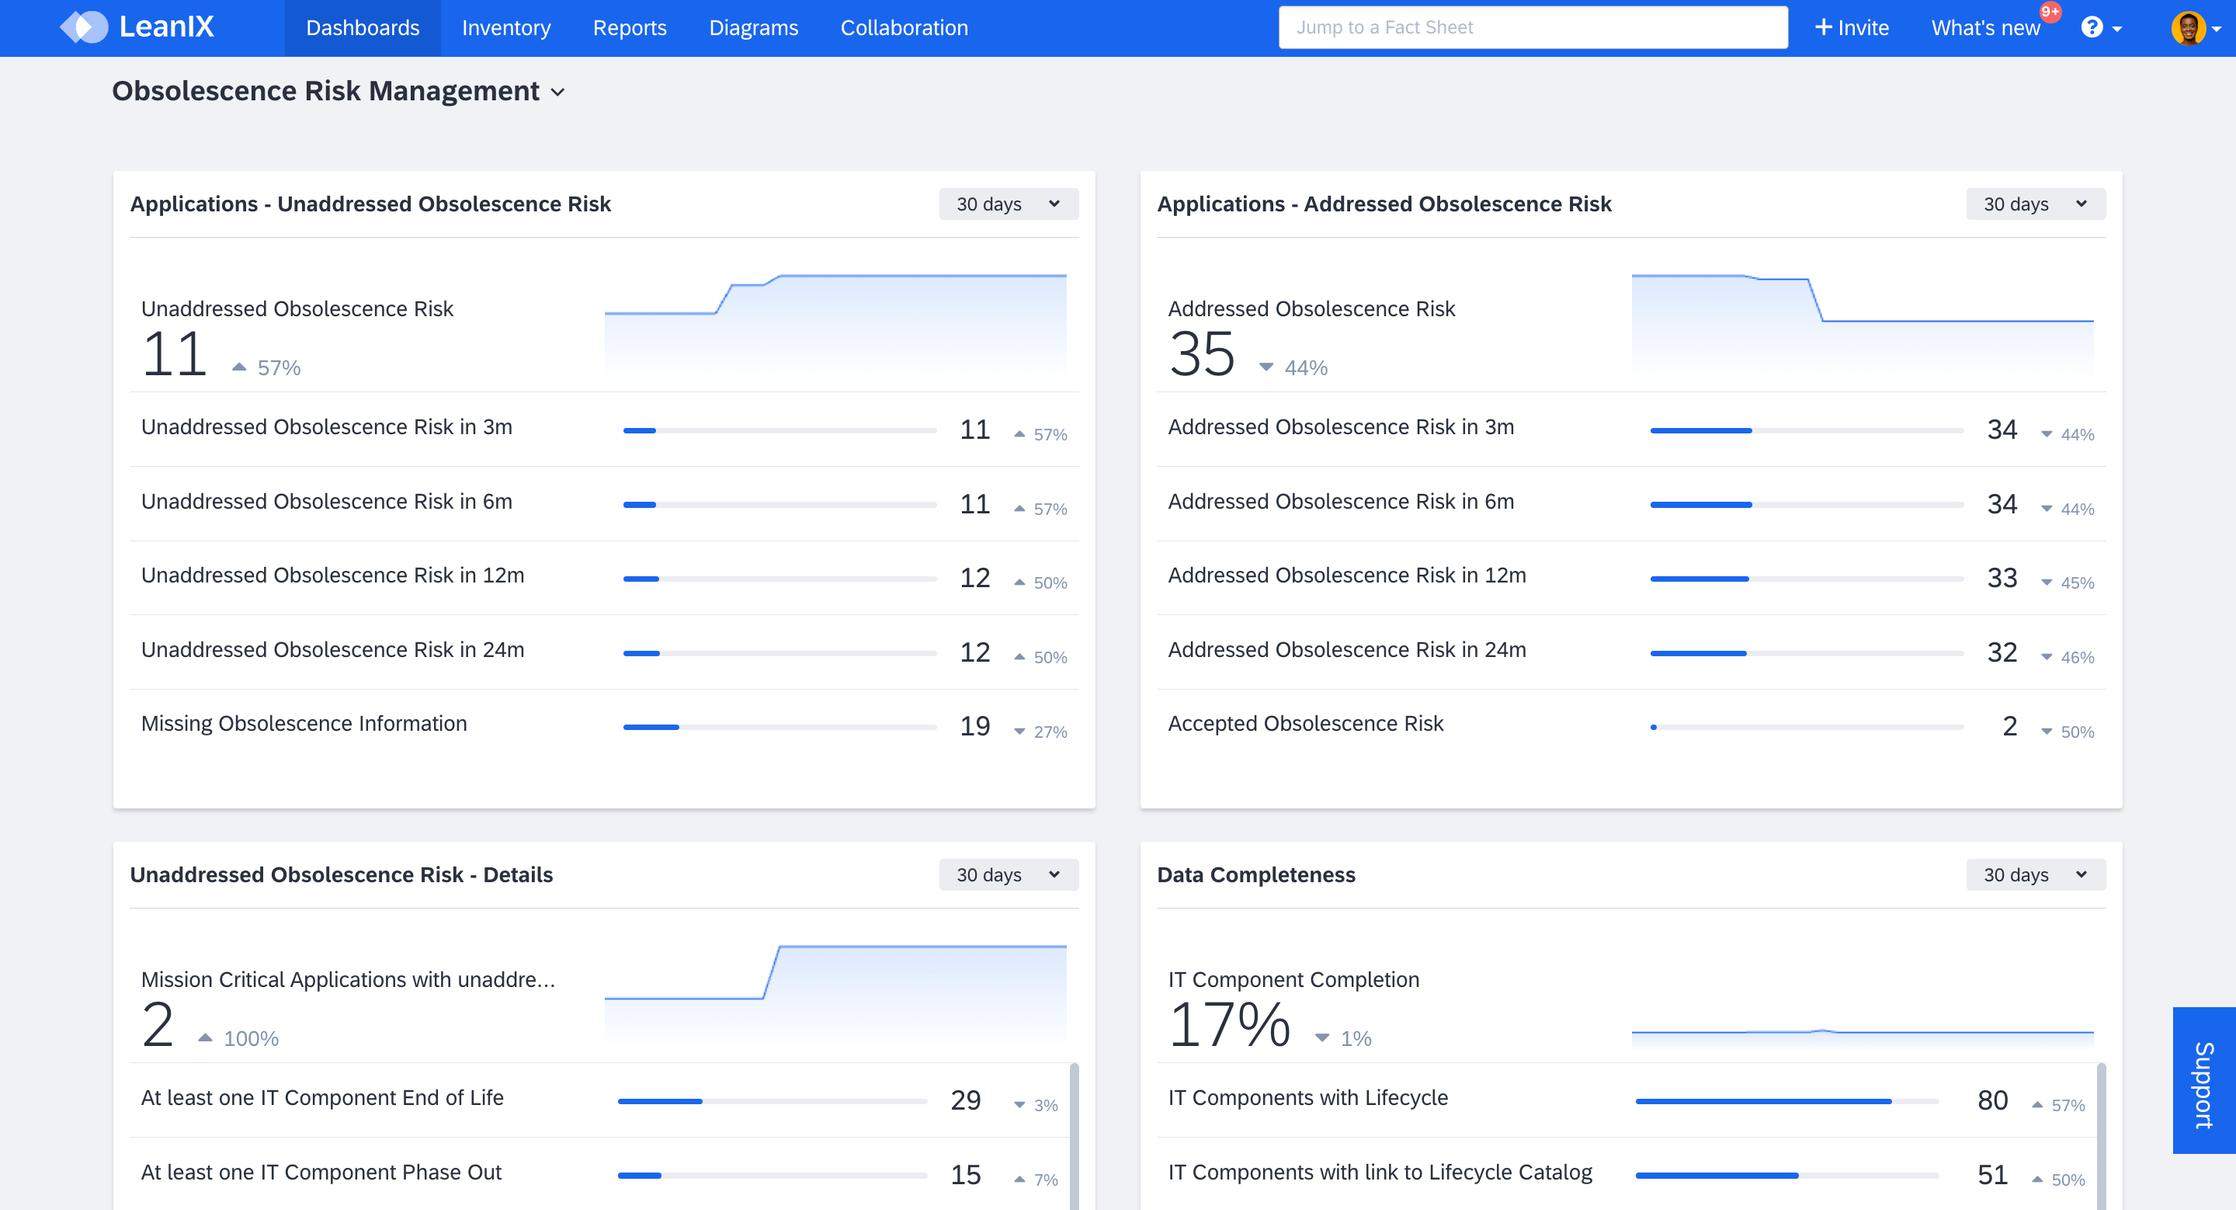
Obsolescence Risk Management Dashboard
Make use of reports to monitor the status of progress. For example, in the application matrix report, choose Organization and Business Capabilities for the two axes, and apply the Obsolescence: Unaddressed Risk Percentage view to gain insights into the proportion of unaddressed risks for applications within each business capability and organization. This view visualizes the percentage of IT components supporting each application with lifecycle information in Phase Out or End Of Life.
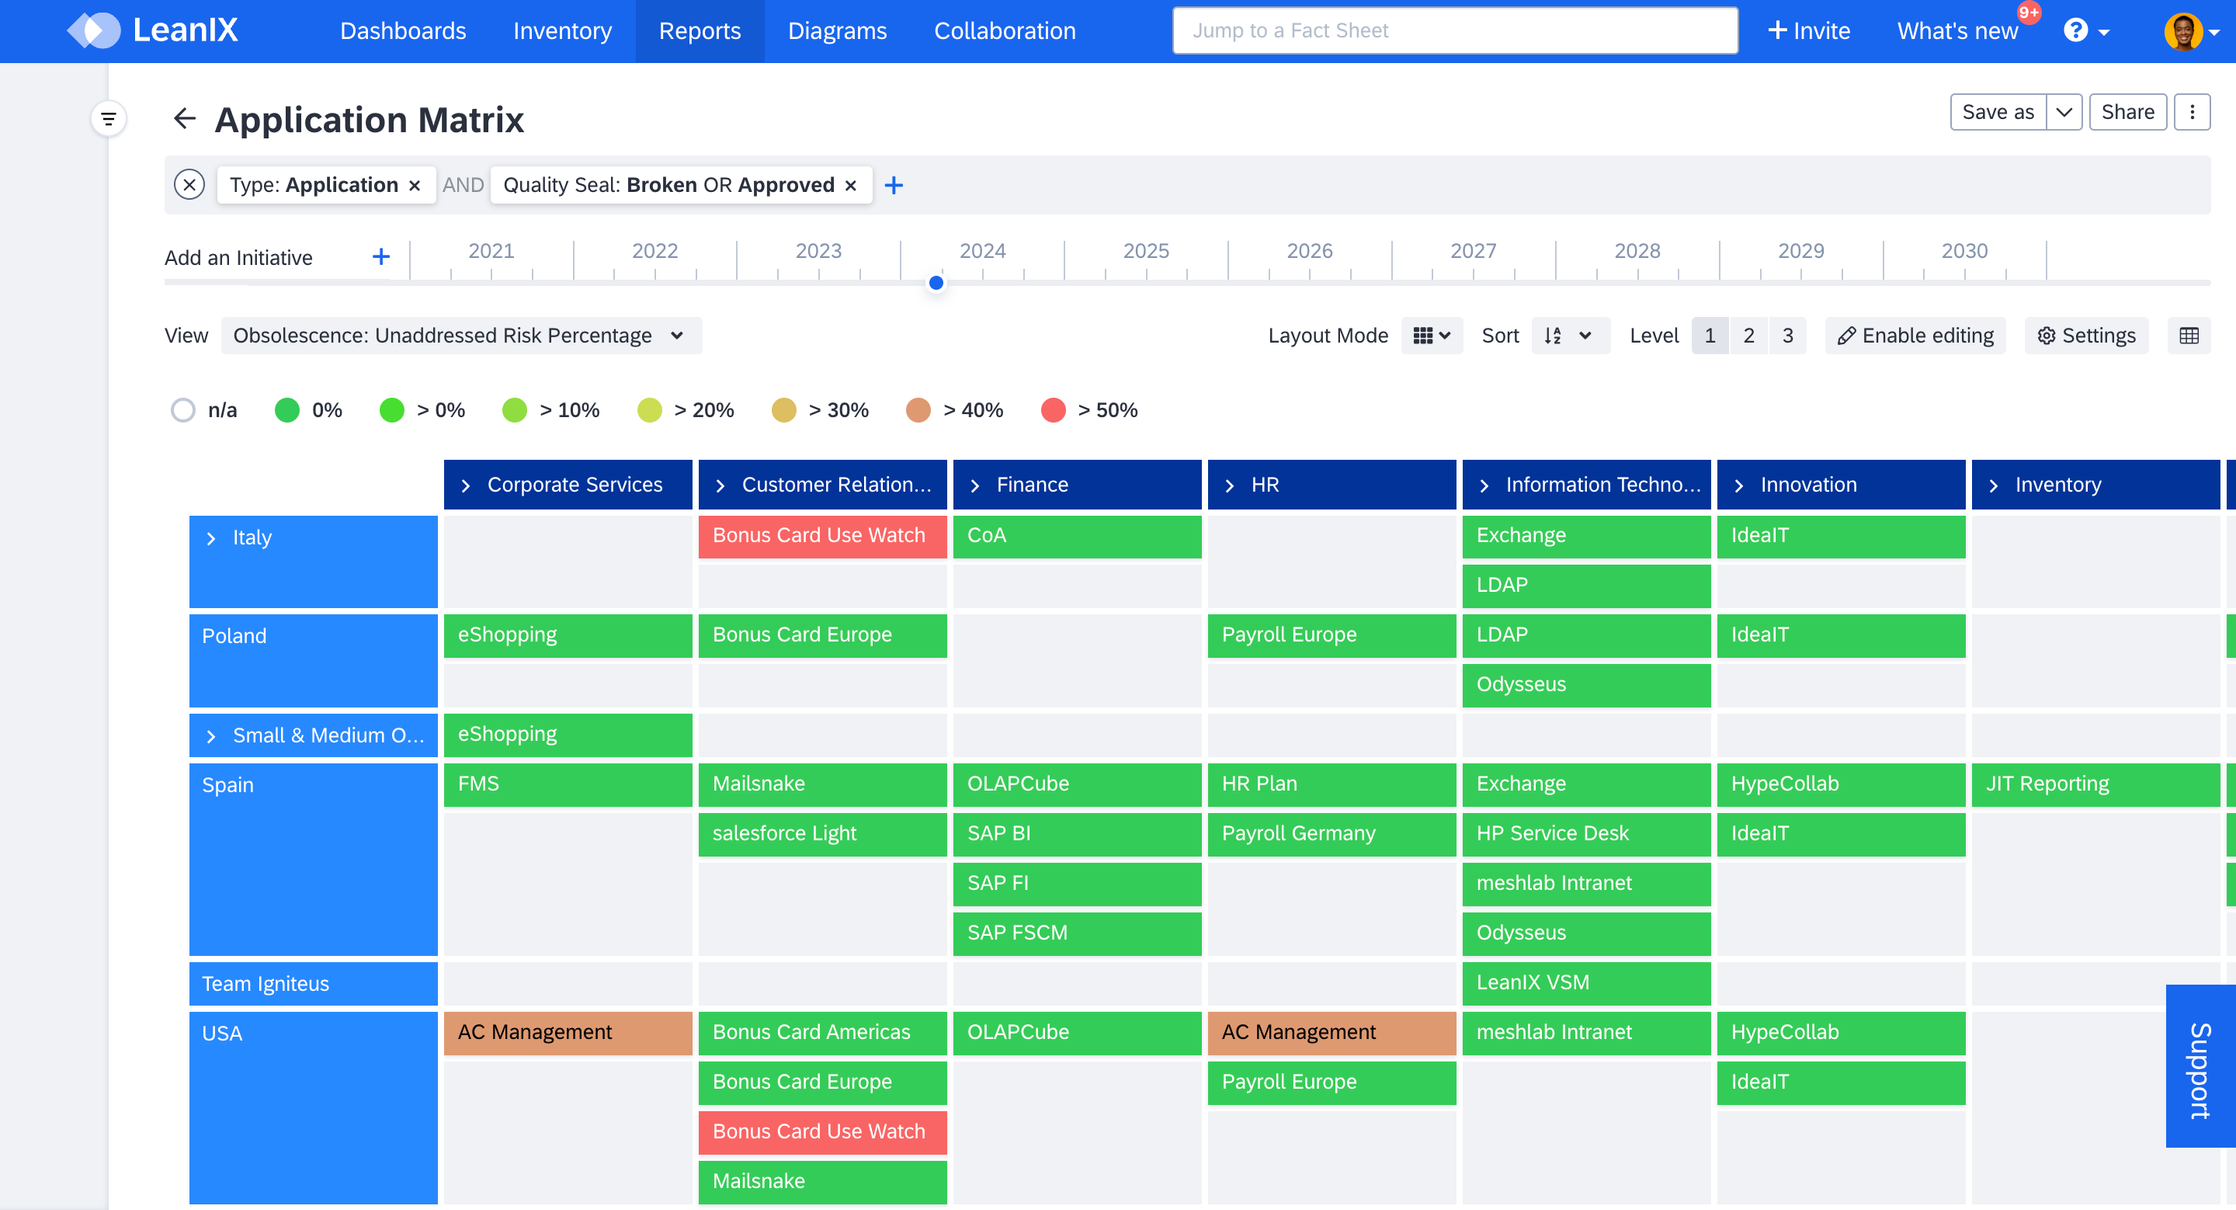
Overview of Unaddressed Obsolescence Risk in Matrix Report
Best Practice
- Leverage fact sheets subscriptions to promptly identify and address responsible IT component owners as necessary. To learn more about fact sheet subscriptions and managing subscription roles, see Fact Sheet Subscription.
- You can use automation features to initiate an end-of-life process for applications and alert the responsible individuals well before the end-of-life of an IT component. To learn more, see Automation to Trigger an End of Life Process.
Use the Obsolescence: Mitigated Risk Percentage view in reports to visualize and effectively communicate the progress to concerned stakeholders and leadership. This view visualizes the percentage of IT components supporting each application whose risk has been addressed or accepted, providing clarity on the level of risk mitigation achieved.
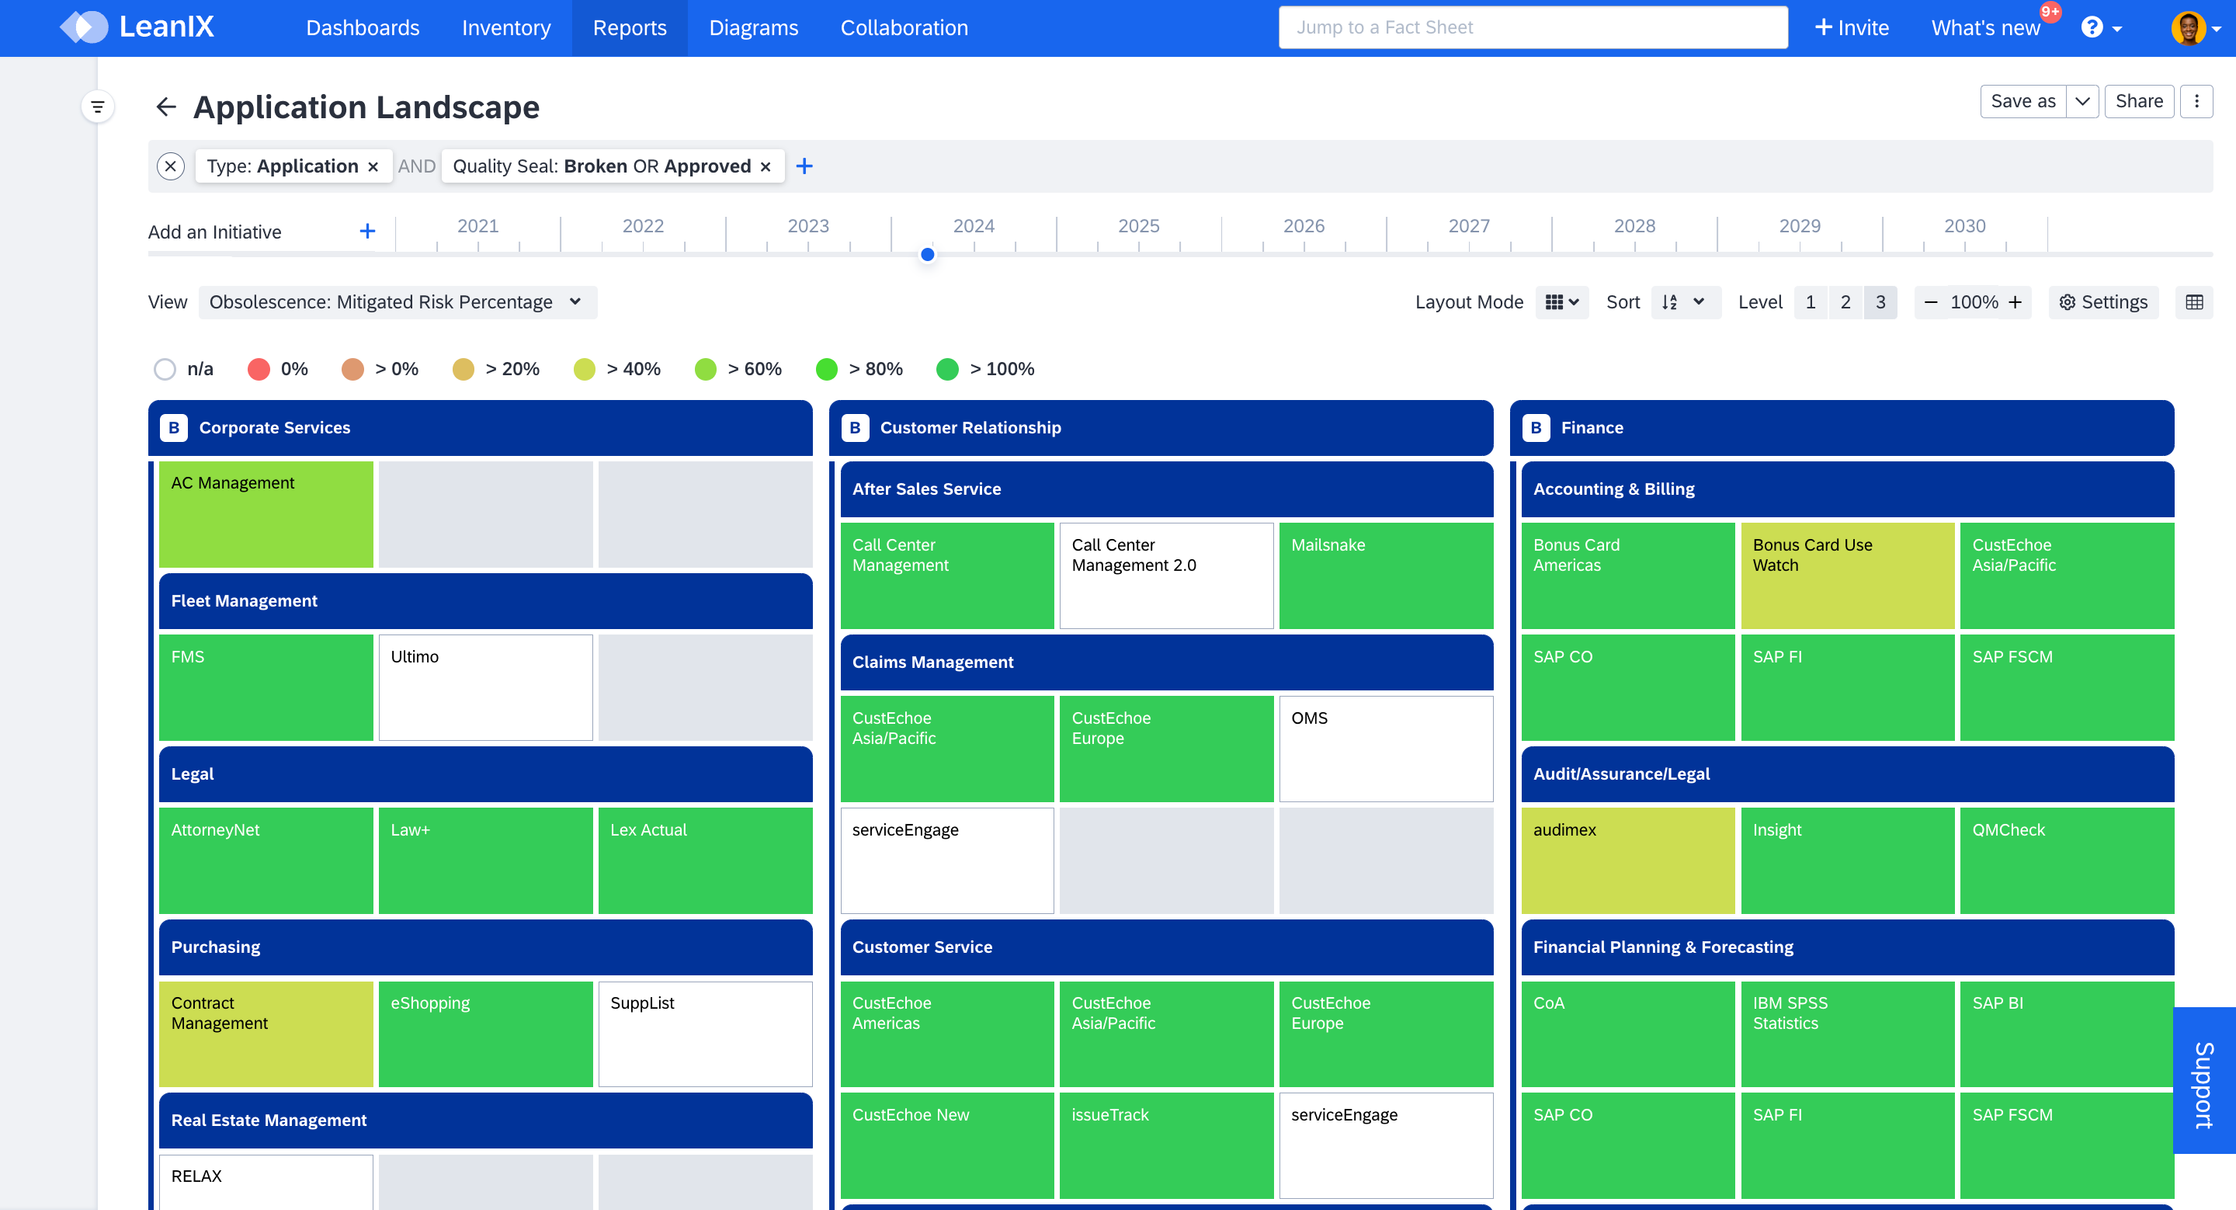
Overview of Mitigated Obsolescence Risk in Landscape Report
Communicate and Foster Engagement
Effective reporting and communication play a pivotal role in driving successful risk management initiatives. Create dedicated dashboards with specific reports relevant to risk mitigation efforts and share the progress and insights with stakeholders to provide transparency and foster deeper engagement.
Consider which insights and metrics are relevant for different stakeholders involved in obsolescence risk management. If needed, have dedicated dashboards for assessment and prioritization tailored to application and business owners, and another for monitoring and showcasing progress aimed at leadership. This approach ensures that stakeholders receive targeted information aligned with their roles and responsibilities, enhancing their ability to contribute effectively to risk management efforts.
Dedicated Dashboard for Communication
Use of a data-driven approach to communicate anticipated architectural changes helps you secure support from all levels, including C-suite members, IT service and operations. This collaborative and transparent approach, supported by data visualization promotes efficiency, and successful modernization of the IT landscape.
Updated 23 days ago