
Step 7. Track and Report
This brings us to the final, but vital, step in your journey. Tell a compelling story to management and everyone interested in your application rationalization initiative. SAP LeanIX dashboards act as a great platform for crafting such a story. By combining different visualization elements, you can structure your storyline, below you find high level instructions and examples of Reporting capabilities. To learn more about Reports, see Using Reports and to learn more about working with Dashboard, see Create a Custom Dashboard.
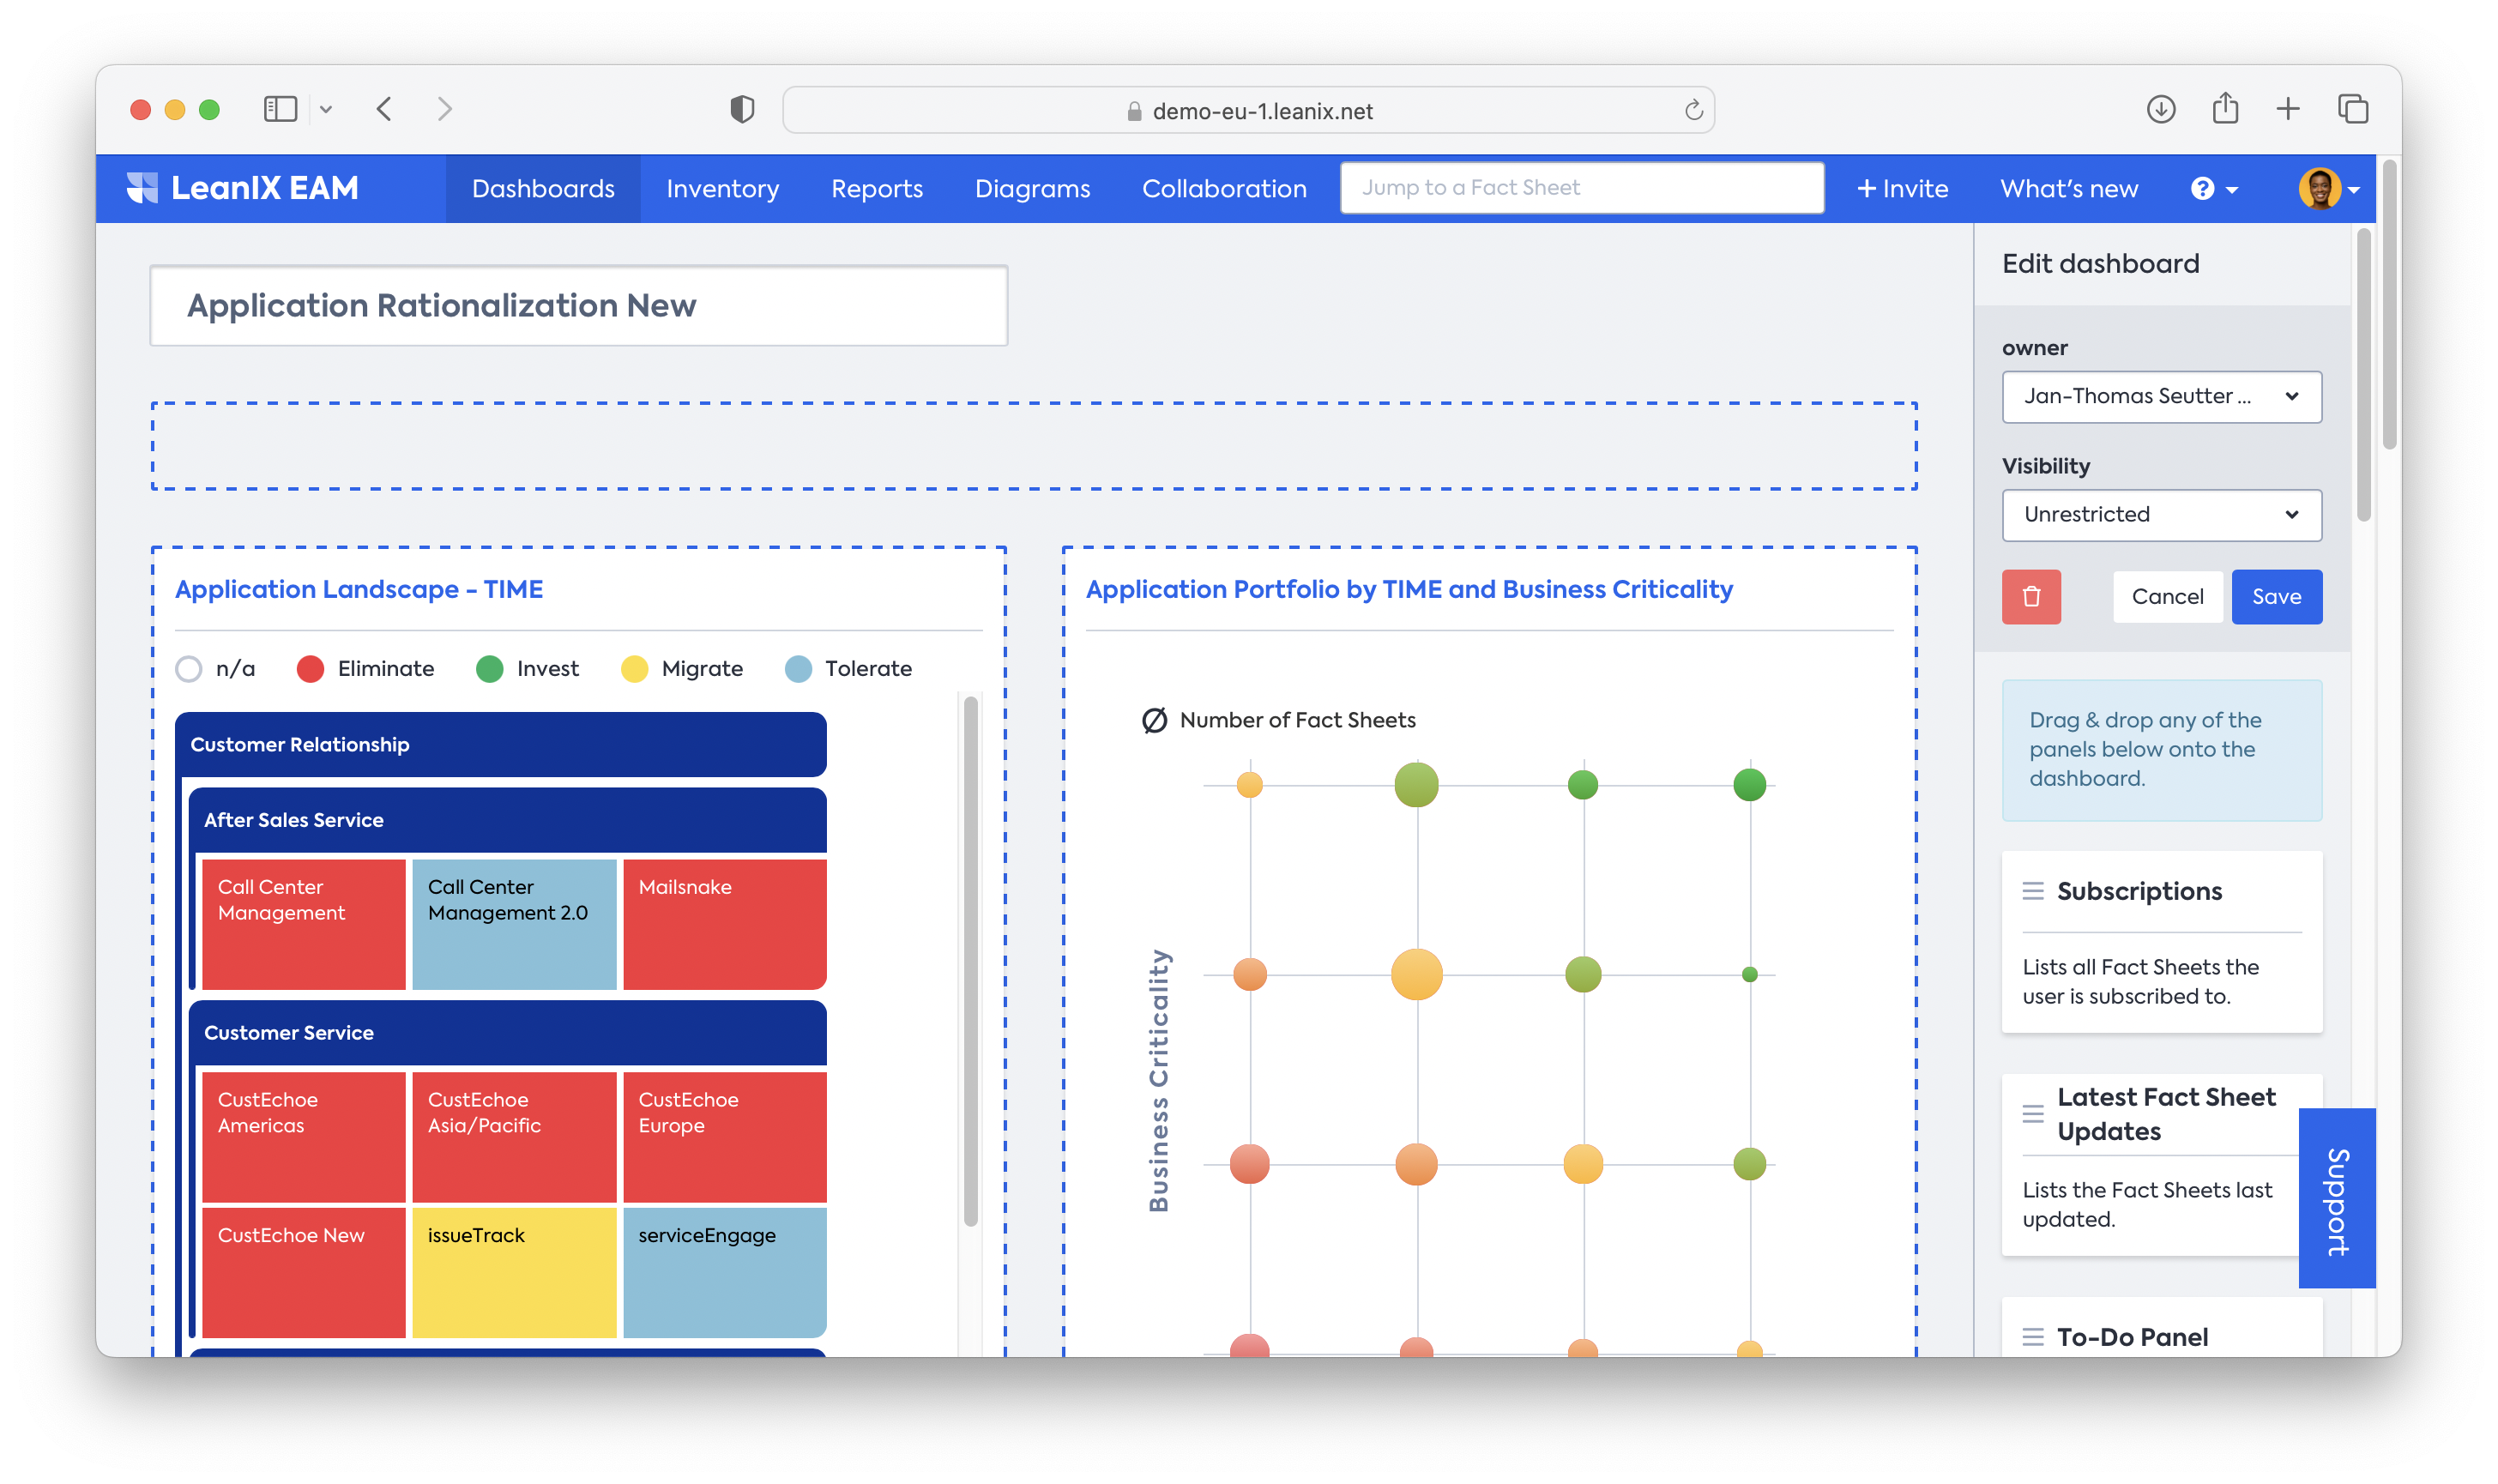
- Create a new dashboard and make it a copy of our pre-defined Application Rationalization dashboard or you can start from scratch
- Depending on your defined KPIs in step 1, you may want to add pre-defined or self-defined KPIs to your dashboard. Create them in the admin section and then drag and drop a KPI panel to the dashboard.
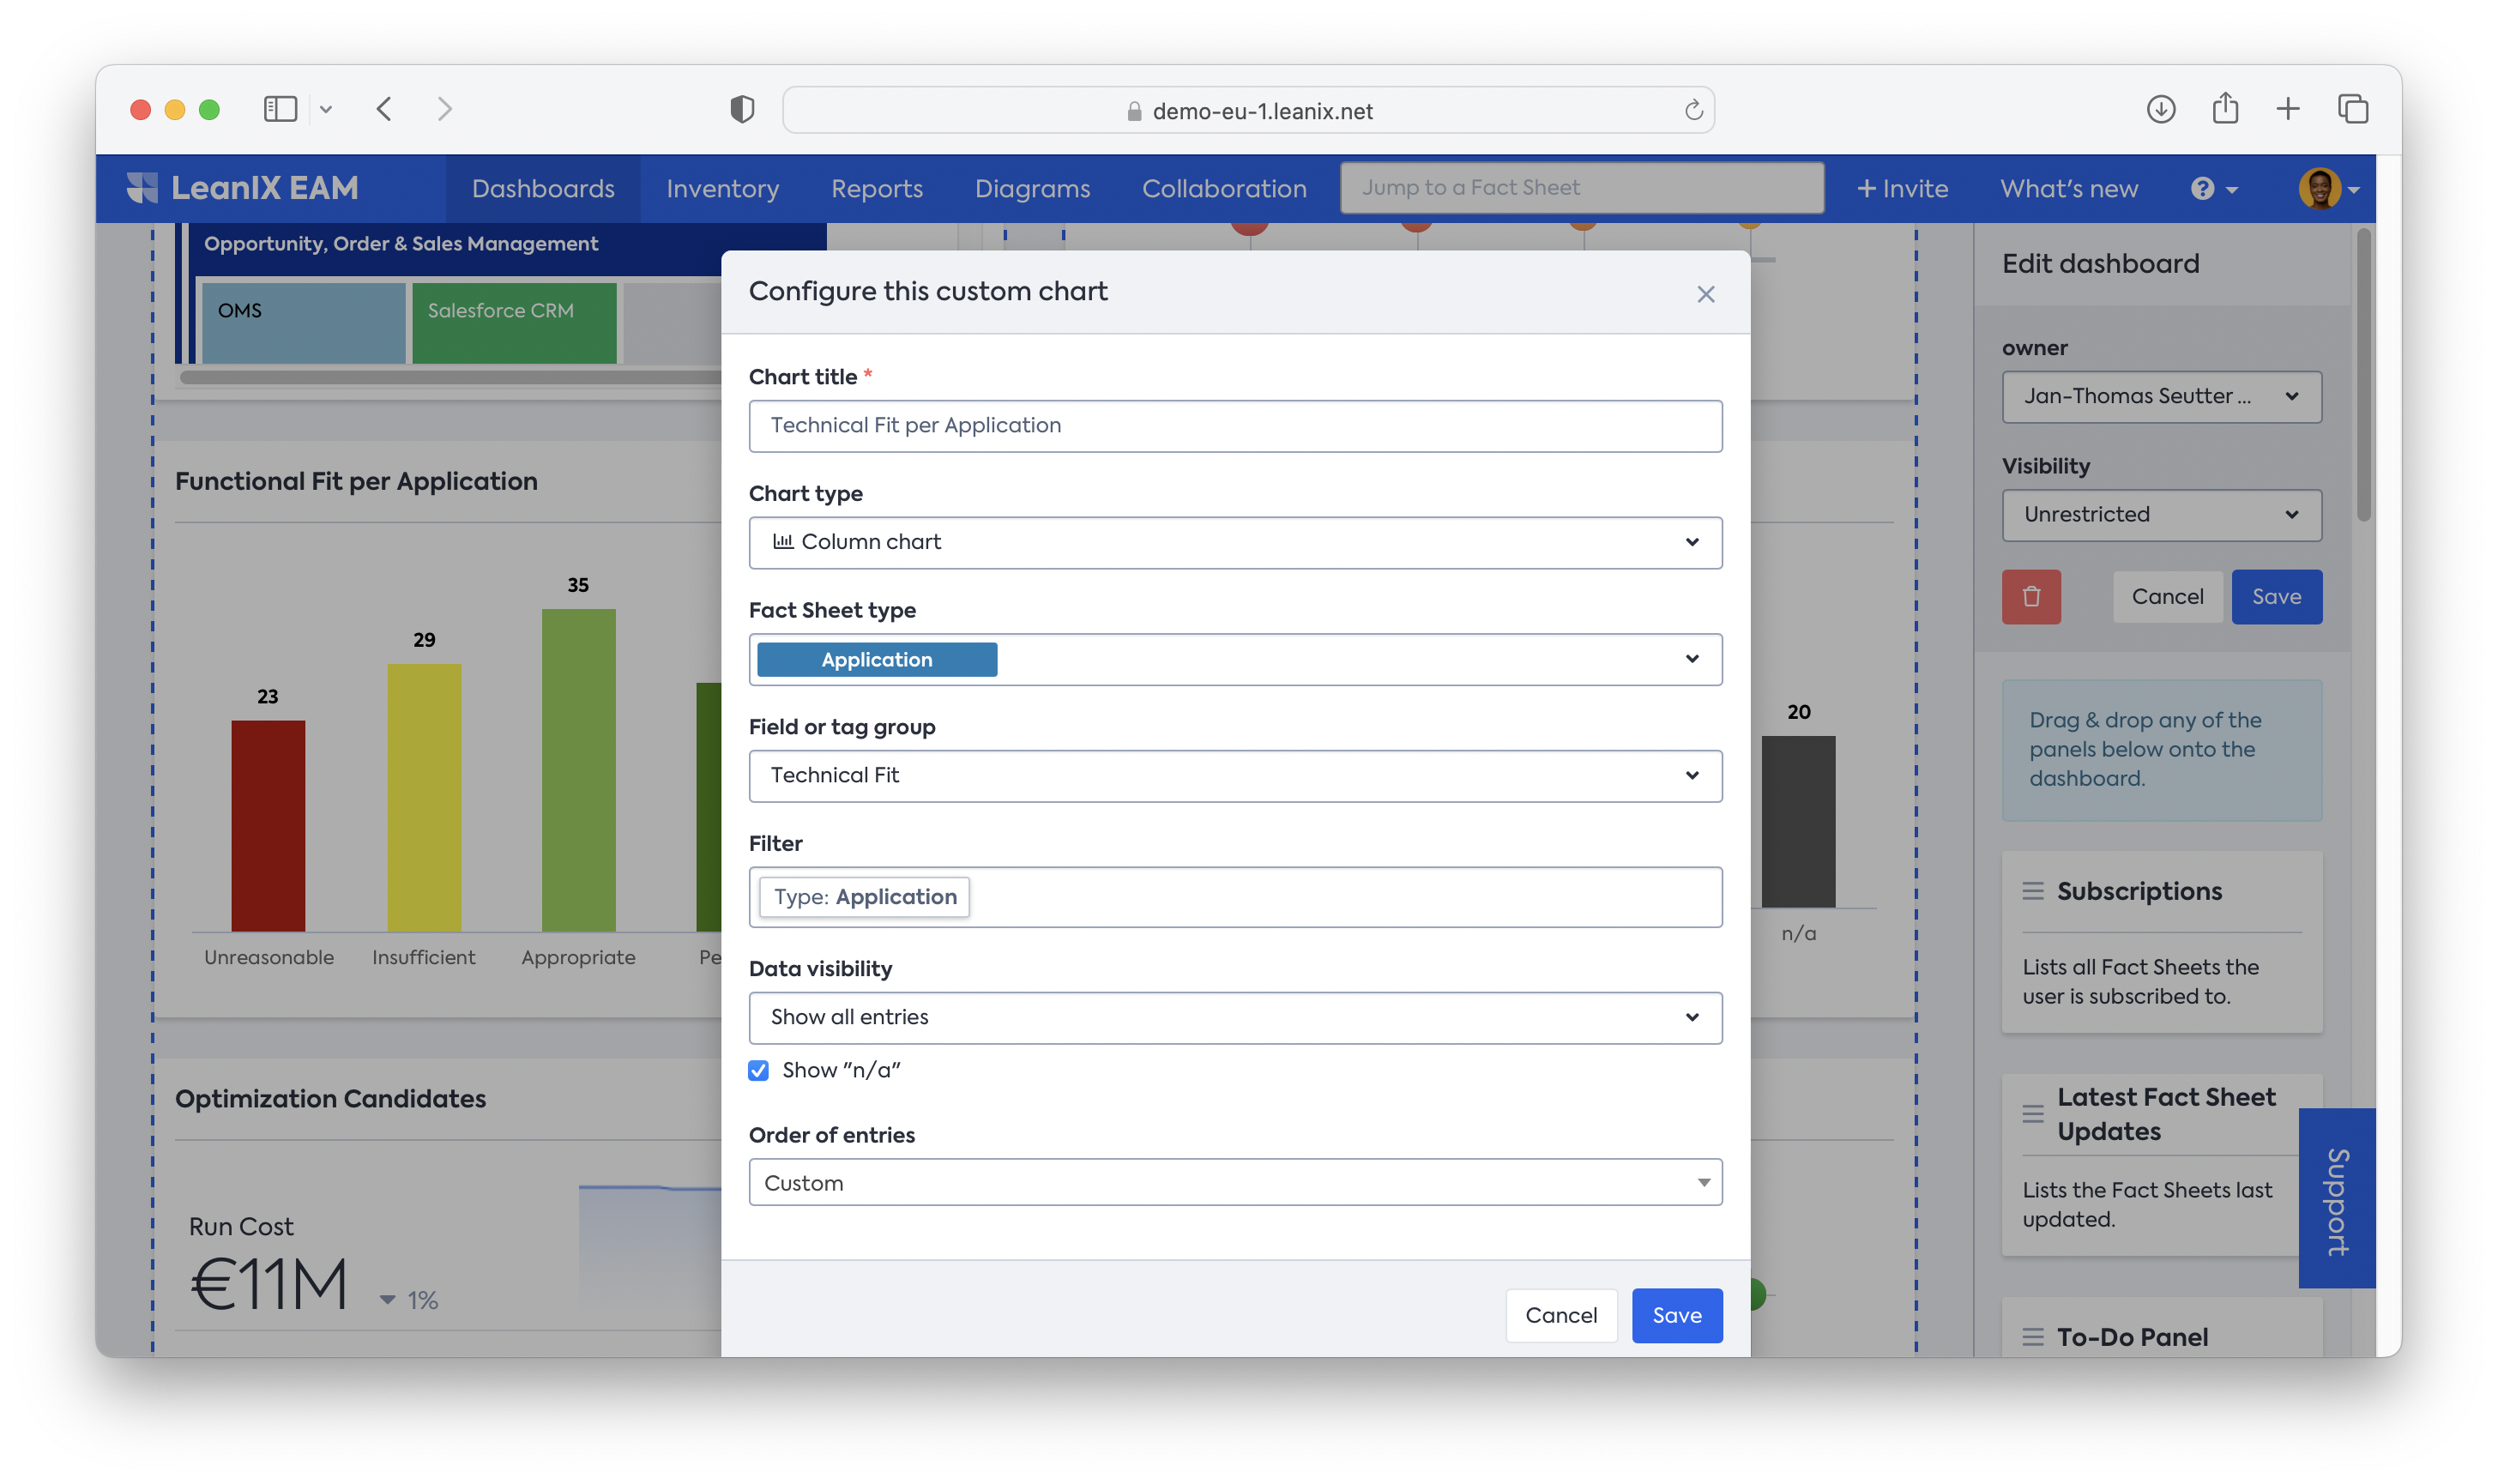
- Create two Fact Sheet charts, one representing the functional fit and the other for the technical fit of all the assessed applications. The distribution between those attributes becomes even clearer with a pie chart.
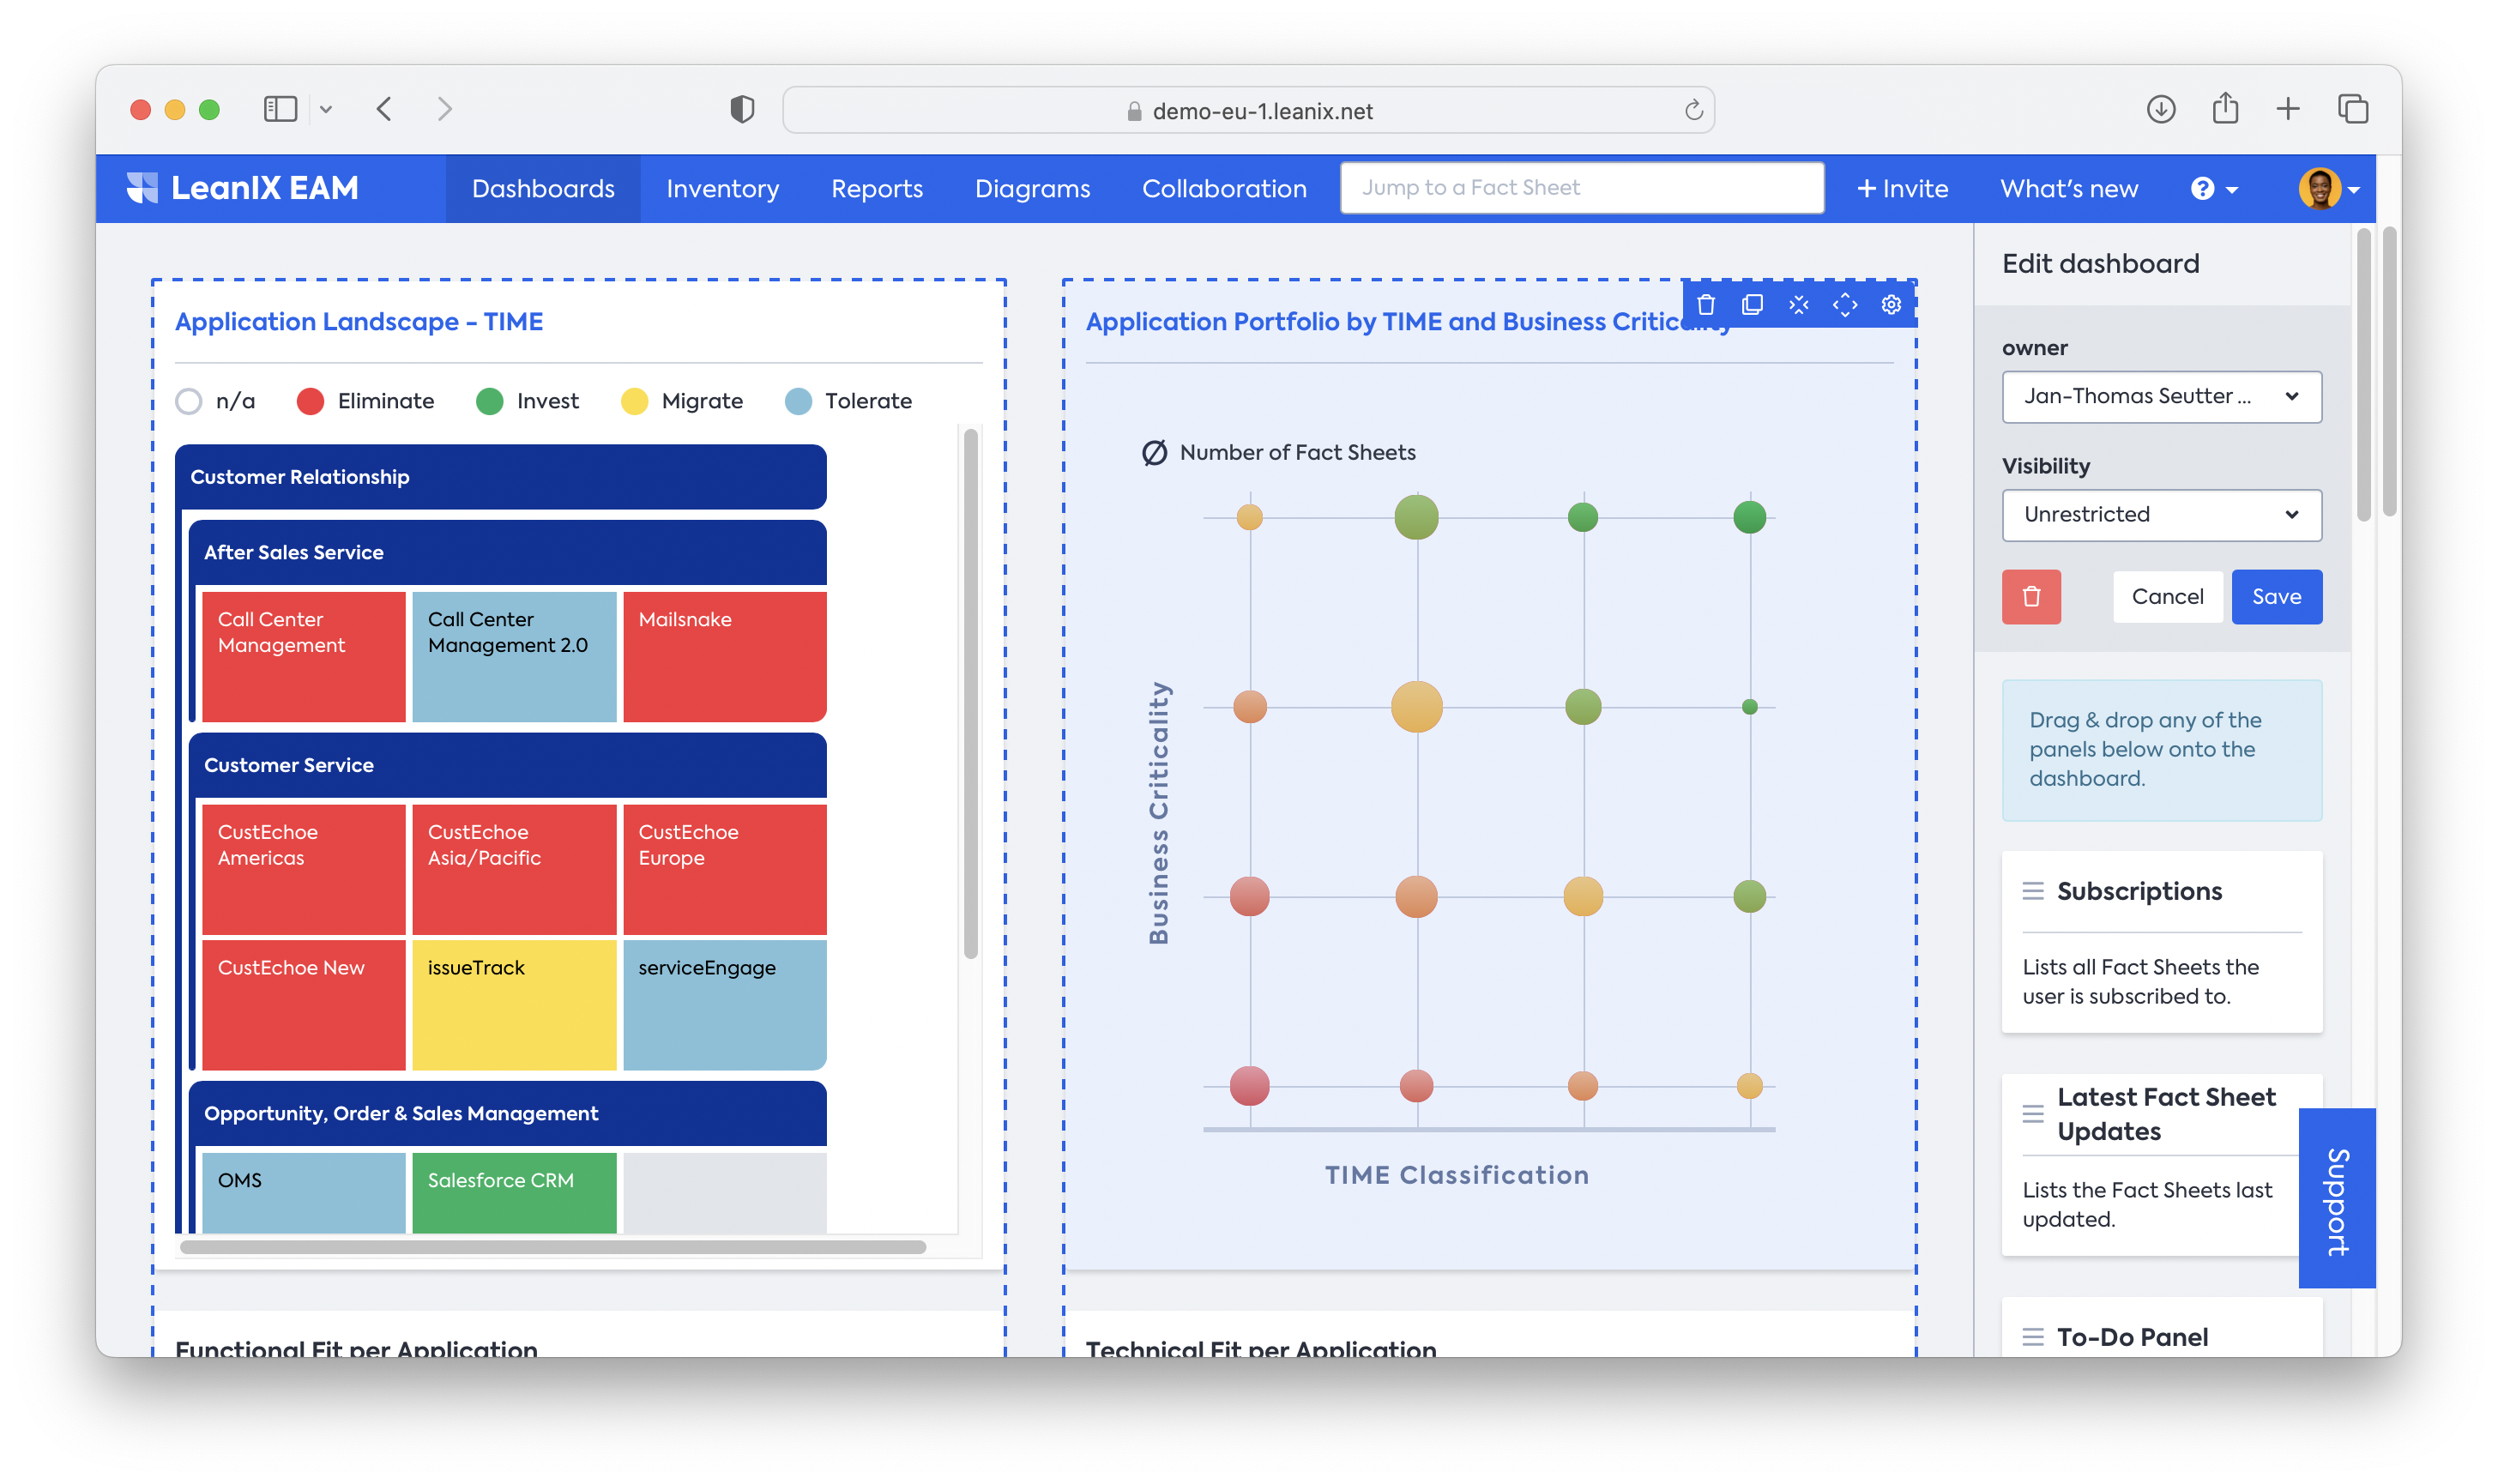
- Add a Report panel to your dashboard. To create transparency in all your assessed applications, use the application landscape filtered down to your scoped applications and set the view to TIME Classification.
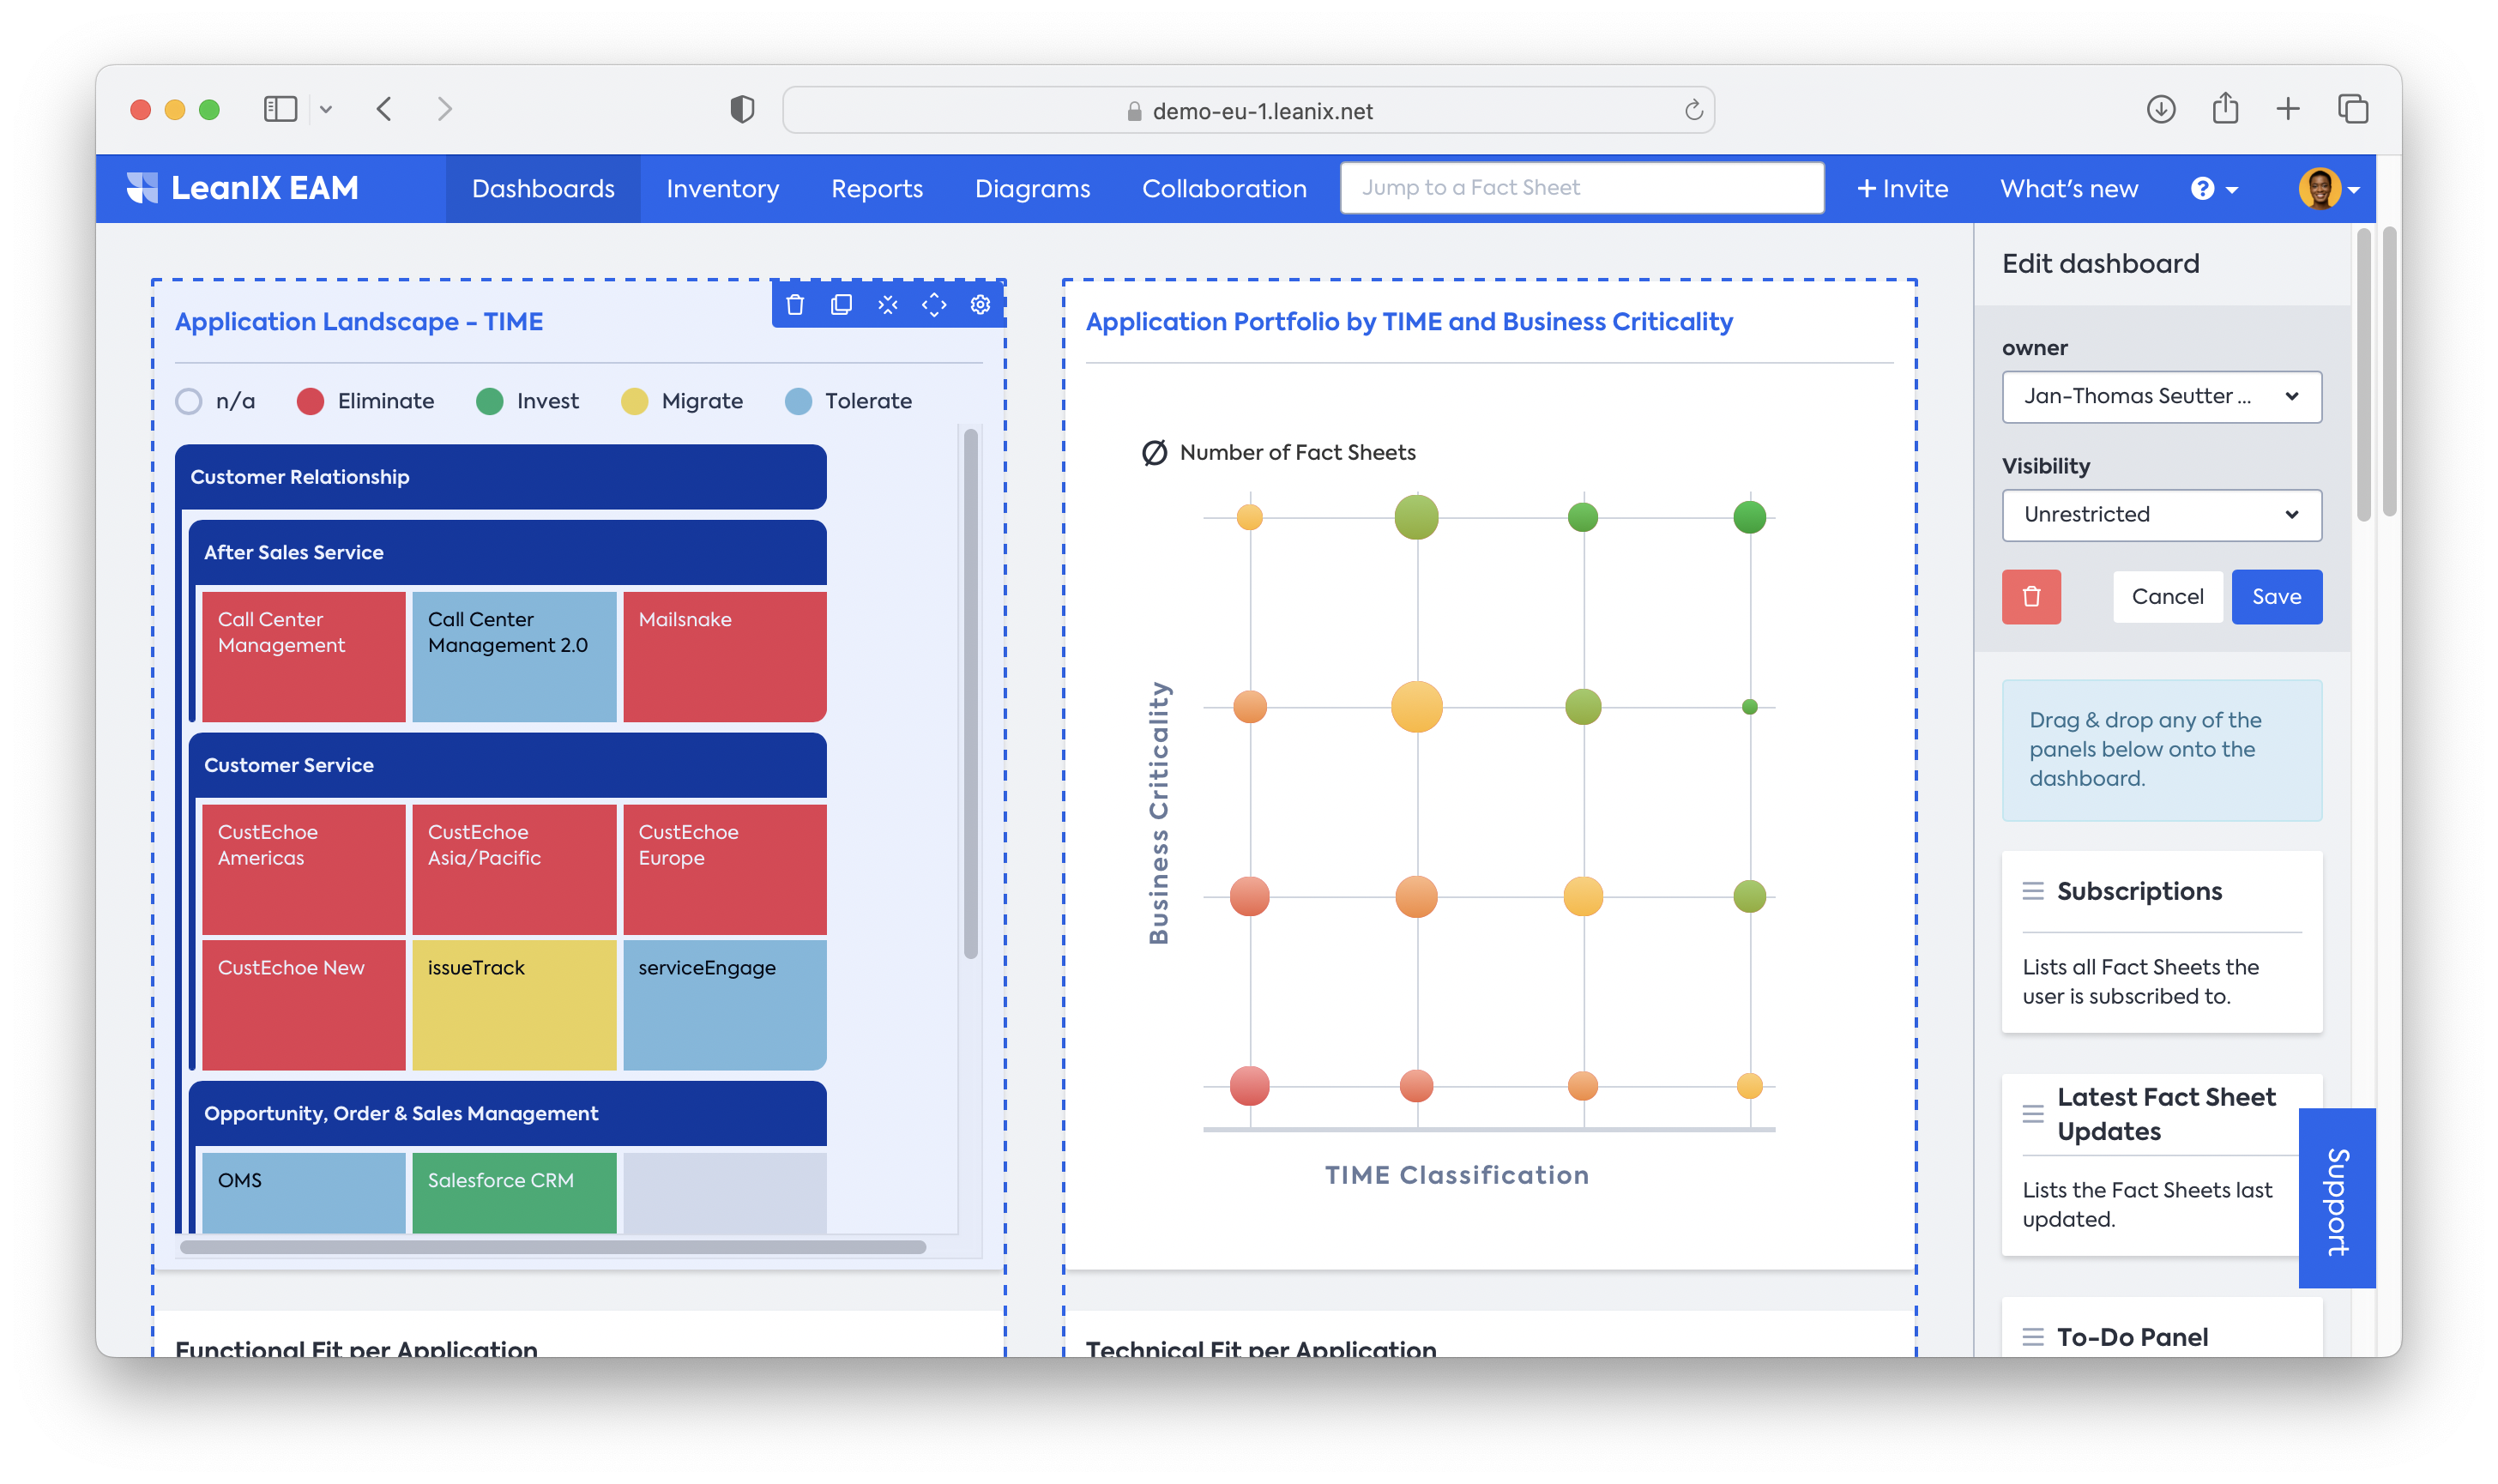
- Add another report panel to your dashboard to prioritize your projects with Business Criticality and TIME Classification axis. Identify quick wins by focusing on Eliminate candidates with a low business criticality. When changing the bubble size to cost, you can add another dimension to your analysis.
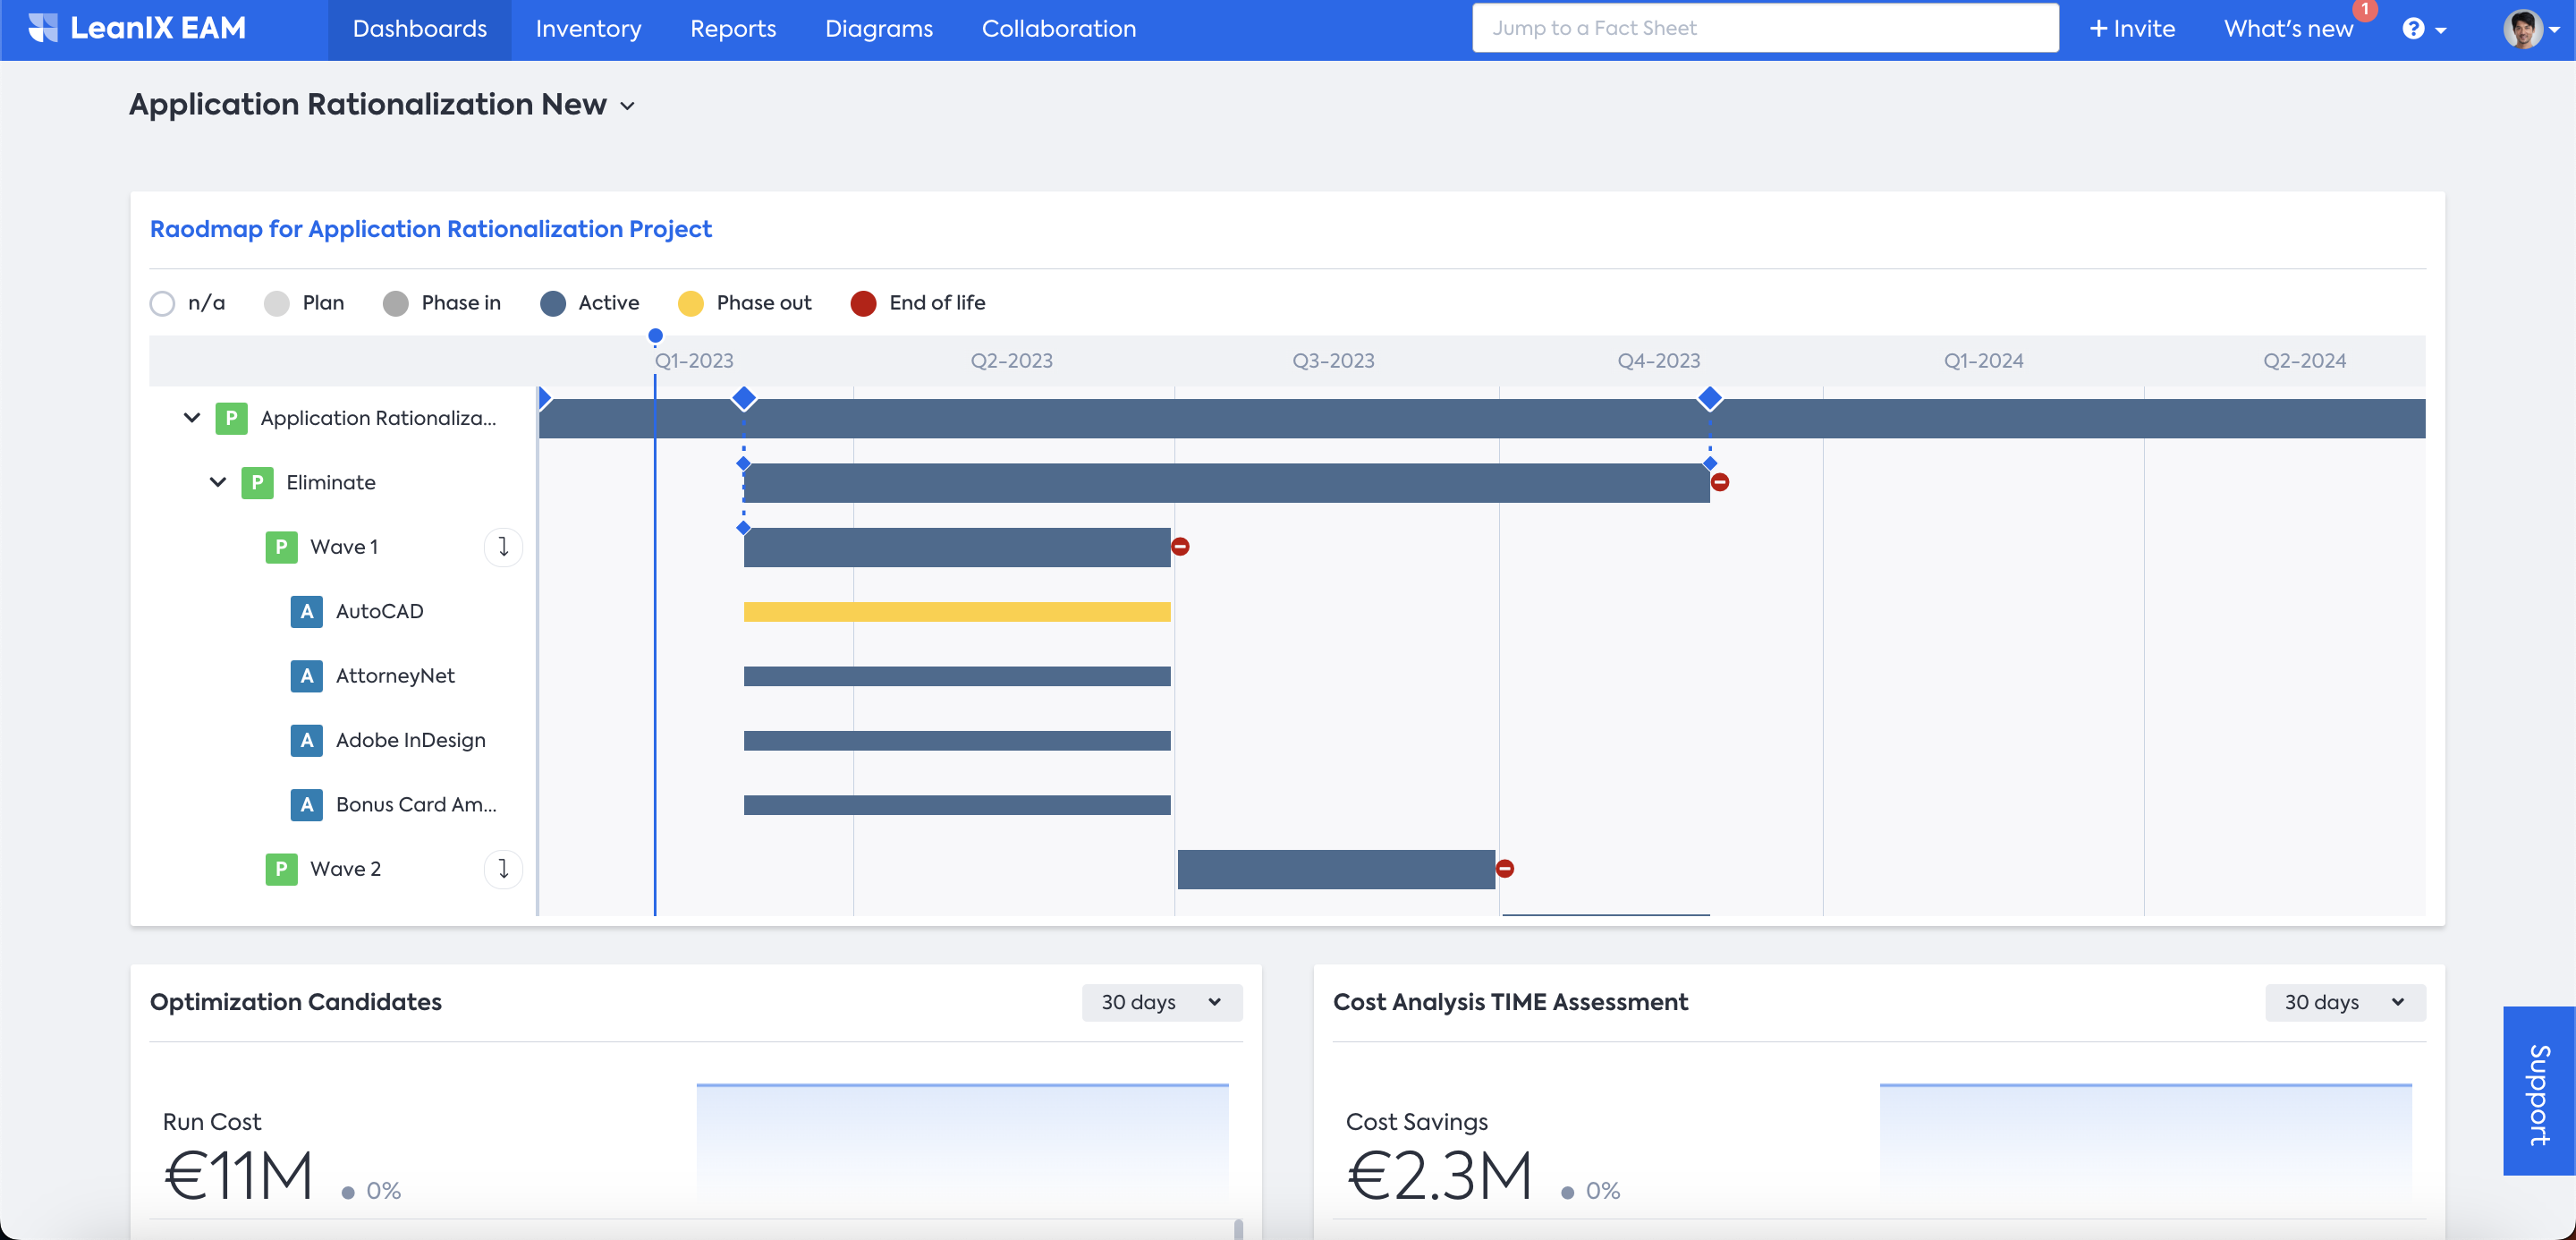
- To outline the next steps and planned projects, add your crafted project roadmap to the dashboard. Make sure to filter down the report to only show your initiative broken down into TIME classifications and waves.
- In the end, you may want to show how your application landscape will look at the end of your initiative. Add the same Application Landscape from the previous step to the dashboard, but select your project. The Time slider on top should automatically jump to the end of your initiative and show your future landscape.
Information
All SAP LeanIX workspaces come with use case-specific KPI dashboards, including application rationalization. Make use of it or copy and adjust the dashboard to your organization-specific requirements.
Updated 29 days ago