
General Modeling Guidelines
This page provides an end-to-end example of how to use SAP LeanIX’s predefined Meta Model. It will help you understand how the Meta Model works and how to interpret key concepts like Fact Sheet attributes, tags, hierarchies, parent-child relations, and others.
See the subpages for detailed guidance on each Fact Sheet type.
Complete Modeling Example – SAP LeanIX as an Application
The following modeling example is based on SAP LeanIX as an Application. The diagram below has been created with SAP LeanIX Diagrams. Diagrams are great to start modeling anything in SAP LeanIX. They are intuitive to new users, and you can easily visualize multiple Fact Sheet types and additional architecture objects together and share them with anyone.
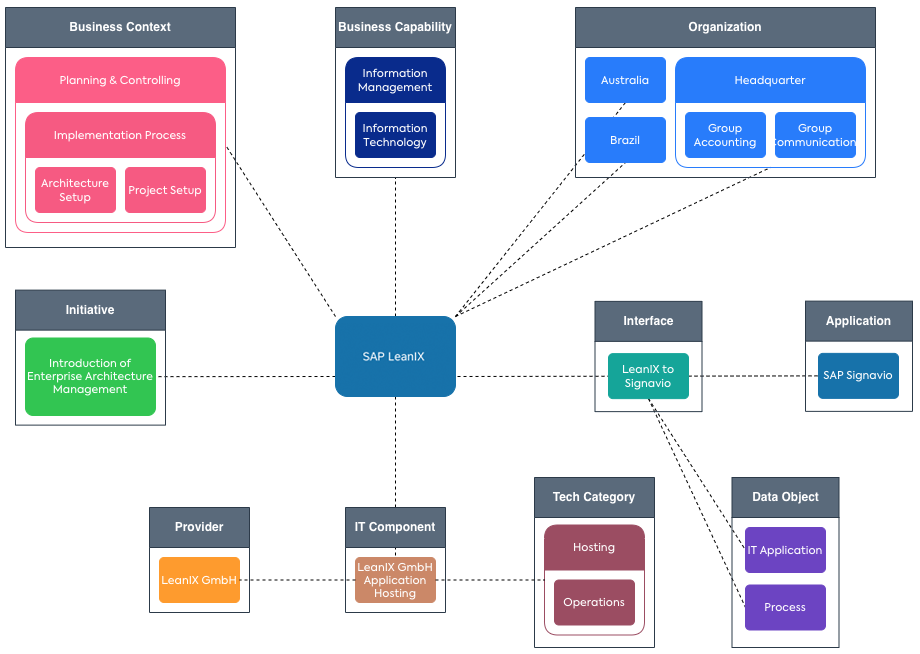
In the example above, SAP LeanIX is an Application. It operates within a Business Context, is used by a Business Unit, and Interfaces with other Applications.
We are looking at three dimensions:
- What is SAP LeanIX doing? — It supports the Business Capability “Information Technology”, which is part of “Information Management”.
- How is SAP LeanIX being used? — It is embedded in the Business Context of the subtype Process. There it is part of “Planning & Controlling”, more specifically, the Process to “Implementation Process”, within the sub-steps “1. Project Setup” and “4. Architecture Setup”.
- Who is using SAP LeanIX? — “Headquarters”, “Australia” and “Brazil” use SAP LeanIX.
An Interface to “SAP Signavio” has been implemented. They exchange the Data Objects “IT Application” and “Process.”
From a hosting perspective, an IT Component has been modeled, and related to a Provider and a Tech Category.
- SAP LeanIX is SaaS, so the provider “LeanIX GmbH” provides an IT Component called “Application Hosting” (service). It is grouped in the Tech Category “Hosting / Operations.”
Finally, SAP LeanIX is included in the Initiative “Introduction of Enterprise Architecture Management” scope.
General Guidelines
Here is a summary of some best practices, which are explained below in more detail:
- Before modeling something, creating new tags, etc., apply the “thinking backward” rule by asking yourself these questions: What are we trying to achieve? Which insights from reports and views do we want to create? This will give you guidance on what you need.
- Especially for larger teams and organizations, it can be beneficial to document and communicate these decisions to get consistent modeling for similar entities; e.g., the modeling of your ERP platform should be agreed on and understood by everyone in your team. This way, you get a global view of your EA landscape.
- Use Fact Sheet subtypes, tags, custom fields, and hierarchies in SAP LeanIX wisely. Each element you add beyond the default settings will add more data and require more maintenance. Explore and use what is already in the default settings before adding a new element.
- The more SAP LeanIX standards you apply, the more you and your organization can rely on SAP LeanIX documentation and resources – removing the heavy lifting for your team to create separate documentation.
- If you make changes or add new elements, ensure that all of that is documented and understood by your team and other relevant stakeholders using SAP LeanIX.
How to use Fact Sheet subtypes
If subtypes are used, use them consistently and avoid placeholder subtypes like ‘n/a’. It might be tempting to have it for the future, but if a (predefined) subtype does not fit your use case – remove it (e.g., Business Unit); adding it again later is easy.
How to use tags vs. custom fields
Both tags and custom fields are ways to bring more information to Fact Sheets in the inventory. They should always be used carefully, as more data requires more effort to maintain. Ensure the outcome exceeds the effort for each new tag or custom field added. Please refer to the tags and custom fields documentation page for detailed information.
The following screenshot summarizes the main properties of tags and custom fields and where to find them in the Fact Sheet.
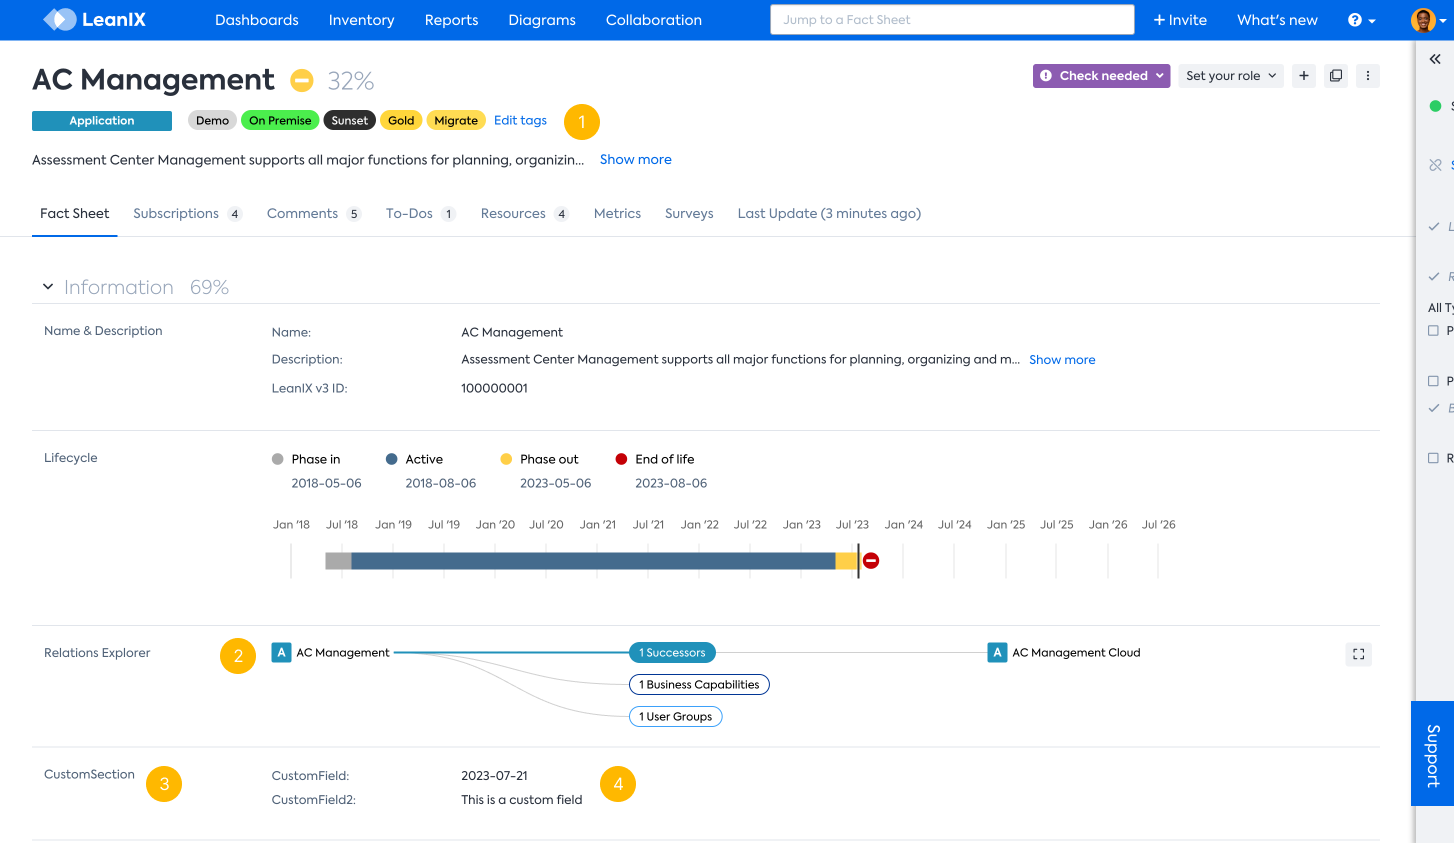
- Tags are displayed prominently at the top of the Fact Sheet.
- Related Fact Sheets are displayed on the Relations Explorer.
- Custom sections and fields can be displayed at arbitrary positions defined in the Meta Model configuration.
- Different data types can be used for custom fields (e.g., strings rendered as text or dates or double rendered as numbers, percentages, or costs).
When to use a tag
- Using no more than 5-7 tag groups per Fact Sheet type is good practice.
- Use them for the most important and most prominent attributes (e.g., a strategic initiative, an SLA classification, or any other clustering across Fact Sheet types).
- Use tag groups if they have a finite number of possible elements (<10).
- Use tags to depict a relatively temporary status since it is easy and convenient to add/remove tags and entire tag groups.
When to not use a tag
- If something can be modeled adequately using the SAP LeanIX Meta Model, then avoid using tags for that.
- If you already have more than seven tag groups applicable for the same Fact Sheet type, consider moving a tag group to a field before introducing a new one.
- When it adds another data point relevant to a use case and stakeholders.
When to use a custom attribute
- Suppose you want to capture other information that is a relevant attribute for the Fact Sheet but not available in the predefined Meta Model. This attribute would typically have a lifecycle not independent of that Fact Sheet (why you would not want to model it as a separate entity).
- If you require other data types than a value list (e.g., a text area).
- If an attribute is only relevant to specific stakeholders or use cases, e.g., for Legal or GDPR cases, and you want to place it near the bottom of the Fact Sheet.
- If you would like to limit access (read or write) to specific users.
Single- and multiple-select fields and tag groups
Tags can be part of a tag group, and the tag groups come in two different types:
- Single-Select Tag Groups
- Multiple-Select Tag Groups
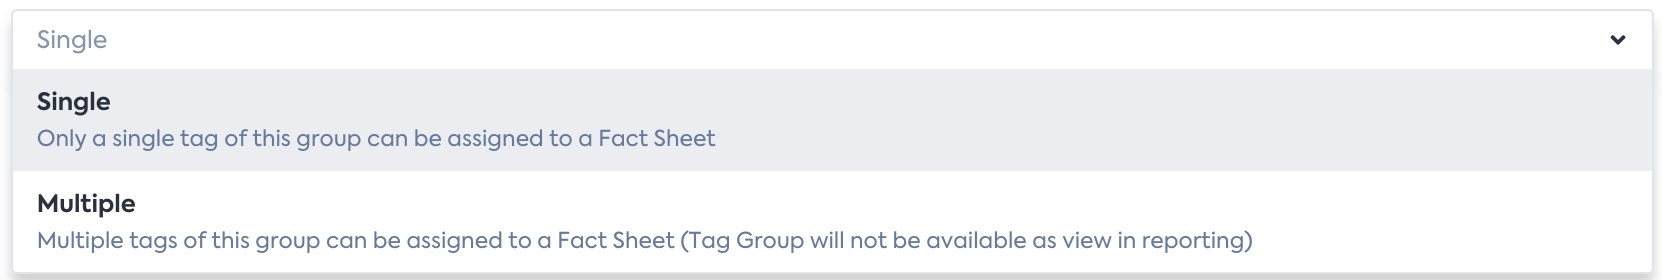
In our Meta Model, there are corresponding fields of type single-select and multiple-select, and thanks to an Excel import and export, it is easy to transfer the values of a tag group to a corresponding field and vice versa.
Both tags and custom attributes share three other significant properties:
- You can access them via an API and XLS/XLSX (both read and write) and see them in the inventory’s table view.
- If they are of mode/type single-select,
- you can filter for them (both in the inventory and the reporting), and
- you can assign custom colors and use them as views in the reporting.
How to use Relations: Parent / Child vs. Requires / Required by vs. Explicit Relations.
In SAP LeanIX, on top of the explicit relations connecting two specific types of Fact Sheets (e.g., between Data Objects and Applications), you will find three different types of relations between Fact Sheets:
- Hierarchical structures that are organized like a tree (e.g., parent/child relations).
- Generic relations, connecting any type of Fact Sheets (e.g., requires/required by relations).
- Other relations: You will notice indirect relations that connect, e.g., Business Capabilities on Level 2 with another Fact Sheet type that has an explicit relation with the parent Business Capabilities. This is what we would call a transitive relation. This way, if you filter, e.g., for all Applications being used in HR, you will also end up with all Applications being used in "HR / Recruiting“ or any of the other children of HR (or the children of the children and so on).
Parent/child relations allow the creation of distinct relations between Fact Sheets (tree structure) within one Fact Sheet type (e.g., Business Capability). A child can only have one parent Fact Sheet, whereas a parent can have multiple children Fact Sheets. The result is a tree with different levels (top parent = level 1, children of top parent = level 2, children of level 2 parents = level 3, …). Some modeling examples in SAP LeanIX:
- Organizations to build a clear regional structure: Europe / Western Europe / Netherlands (Europe = Level 1, Western Europe = Level 2, Netherlands = Level 3).
- Tech Category to build a clear Tech Category structure: Database / Relational Database (Database = Level 1, Relational Database = Level 2).
Attention
Use hierarchies with care. More details always require more maintenance. Start with low granularity and refine only where it makes sense. An aligned understanding of a simple hierarchy of a few levels (2-3) is worth more than a fine-granular hierarchy of five or more levels that other business users don’t understand.
When creating hierarchies of items, make sure to keep them manageable. In EA, there is a consensus that you should have about 5-10 items per level, e.g., 5-10 Business Capabilities on level one, and then for every Business Capability on level one, at most 5-10 capabilities on level two, and so forth. Check out Business Capability Map Library | SAP LeanIX for examples.
How to build a tree hierarchy for a taxonomy, e.g., for Tech Categories
In an ideal world, every parent node is a classification that is then split up into multiple subclassifications that together build the parent. That means:
- Full-coverage: If something can be classified as an item of the parent classification, then it must fit into exactly one of the sublevels. (If that doesn’t work yet for all items and you can’t find a single term for the remaining items, you can group them in “Others” for the moment).
- Mutually exclusive: If something can be classified as belonging to a certain child item, it cannot belong to another child in the same category.
The hierarchies are used in Landscape and Matrix reports for the clustering and aggregation of the items, e.g., in an Application Landscape, the Applications get clustered by Business Capabilities (or any other relation that you choose). This gives a structure to navigate your Applications in a meaningful way. While hierarchies for representing your Organization, your capabilities, or Data Objects make perfect sense, they don’t serve well for things that are usually long lists, e.g., the Applications or IT Components of your EA repository.
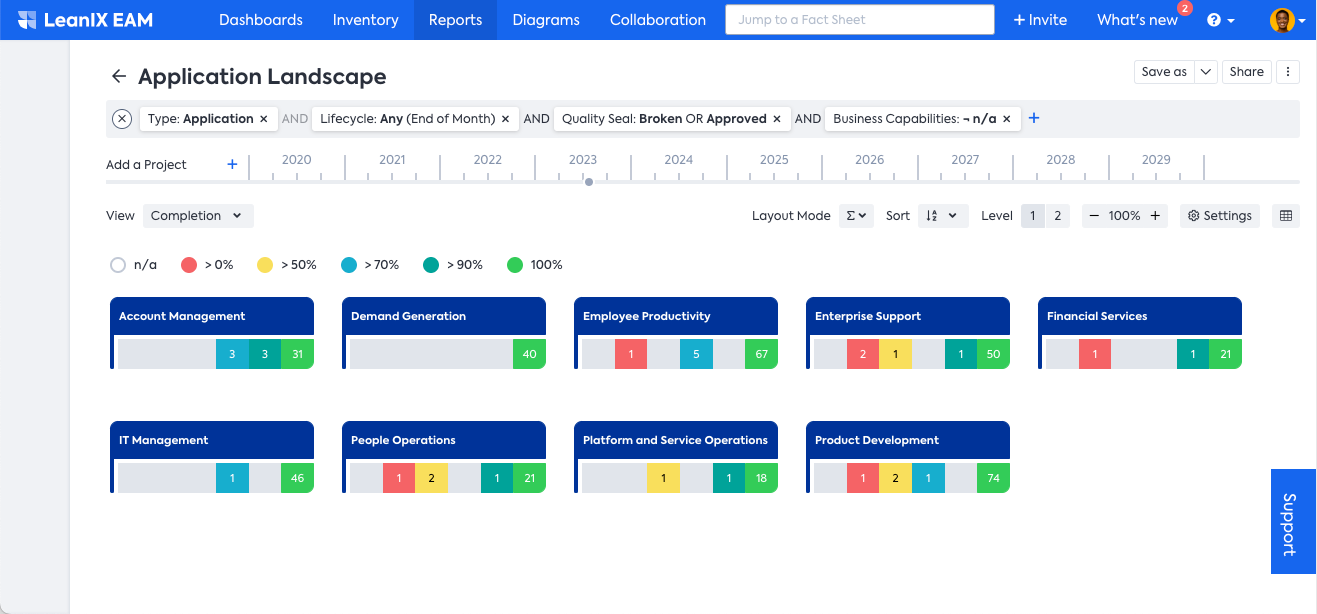
Example of how Applications are rolled-up into the Business Capabilities, thereby giving a structure to the data that is meaningful to your business.
Parent/child relations also play a crucial role in the display name of most Fact Sheet types, as the parent Fact Sheet will be put in front of the display name of a Fact Sheet, e.g., the level 2 Organization “Western Europe” will have the display name “Europe / Western Europe” or its child Netherlands will have the display name “Europe / Western Europe / Netherlands”.
Most relations in the SAP LeanIX Meta Model, and the ones you will create, are explicit or typed relations defined between Fact Sheet types on the SAP LeanIX Meta Model and work very well with SAP LeanIX’s filtering and reporting capabilities. We highly recommend using this type of relation if available for your use case. In some cases, these relations include specific attributes to specify the relation (e.g., “total annual costs” on the relation Application – IT Component or “usage” (CRUD) on the relation Application – Data Object). These relations are typically between two different Fact Sheet types, but they can also be used between Fact Sheets of the same type (Think of a blocked/blocked by the relation between Projects – a subtype of the Fact Sheet type Business Context).
Requires / Required by relations can be used to create further logical dependencies within one Fact Sheet type or between Fact Sheet types:
- Within the same Fact Sheet type: A server requires an OS (operating system). These are both IT Components, but only the server is directly linked to the Application. Using logical n:m dependencies, however, the “Obsolescence: Aggregated Risk” views allow you to extract the information that the OS is also linked to, albeit indirectly, through the server. However, you cannot see the indirect connection in the obsolescence risk views of the Application Matrix and Landscape reports.
- Between Fact Sheet types: For documentation purposes, showing the dependencies between Fact Sheets of different Fact Sheet types (e.g., Data Object to Process) might be helpful. This relation cannot be visualized in standard reports and is only available on the Fact Sheets and in the table view.
Attention
Requires / Required by is a powerful concept that should be used carefully. There are use cases (e.g., Obsolescence Risk Management) where using it will improve the data quality and insights that can be drawn from SAP LeanIX. In other instances, however, using this relation might create more harm as it overloads the data model. Explicit relations should always be considered before opting for Requires / Required by.
Relations and new Fact Sheet types
The un-typed relations (requires/required by) and the structured relations among Fact Sheets of the same type (parent/child and successor/predecessor) apply to all Fact Sheet types. If you create a new Fact Sheet type, these relations will be available immediately for the new type.
Remember that relations (especially typed or explicit relations) are crucial to making your inventory work. Without them, it is just a flat list of unconnected items.
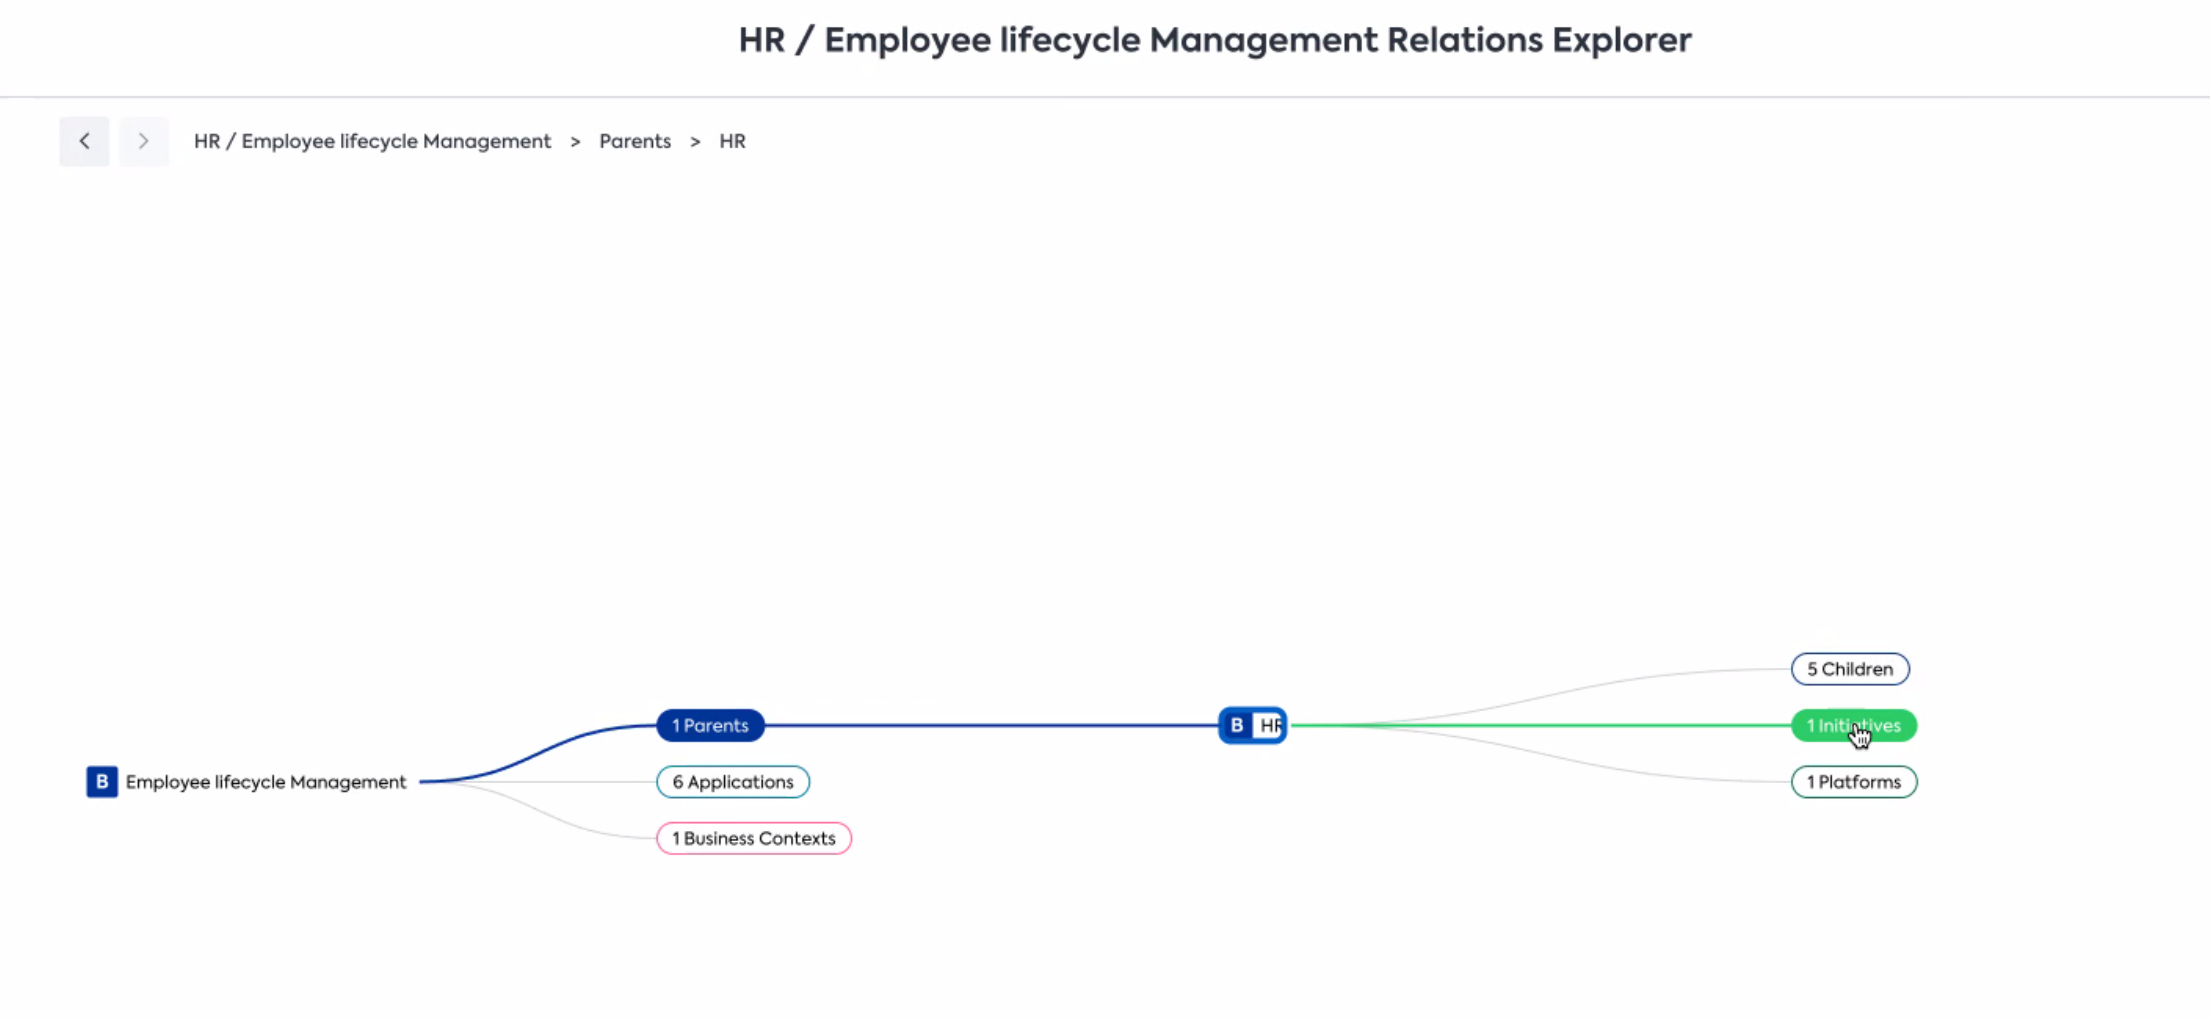
Other indirect (transitive relations): You will notice other indirect relations in SAP LeanIX that are not displayed on the Fact Sheet, but you can see them, e.g., in the Relations Explorer. The below example shows how the Level-2 Business Capability Employee Lifecycle Management is related to the parent (Level-1) Business Capability HR, which again is related to an Initiative and Platform. This indirect relation is responsible for the fact that if you filter for the Business Capabilities that are part of a specific Initiative, the children of HR are returned as well.
Impact of Modeling on Reports
One of the main reasons for any modeling activity is that you are trying to get specific insights with reports. This is why thinking backward makes sense – a rule we always recommend applying when using SAP LeanIX. First, get an understanding of what are the reports and views you want to create (keeping in mind the audience of that as well), then explore which options you have in SAP LeanIX, and identify the most intelligent way of doing it: Use default settings and fields first, add tags only if you need them, etc. This will avoid getting lost in the variety of options SAP LeanIX offers – to stay lean with your enterprise architecture work.
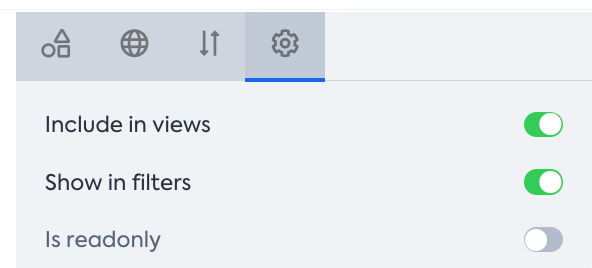
Not all default fields on Fact Sheets are automatically listed in filters and the drop-down selection of views on reports. To make them visible, enable the Include in views and Show in filters options per field in the meta model configuration. To learn more about these options, see Showing Fields in Views and Showing Fields in Filters.
The below example shows what thinking backward means and how you can apply it in SAP LeanIX.
Scenario: Reflecting GDPR Status of Applications in Reports
GDPR compliance is relevant for all companies that make their services available to EU citizens. In this scenario, you would like to give your business stakeholders transparency regarding the GDPR compliance of your IT application landscape by showing the GDPR status of your applications. The Application Landscape report would be the best way to visualize whether an Application applies to GDPR at all and, if so, whether it is compliant. Then there might be some edge cases that warrant exclusion etc. It can be as sophisticated as you need it – for the argument, we will stick with a single-select field with the following options:
- Unknown – Application status is not known centrally and therefore poses a risk.
- In progress – the GDPR assessment is currently being done.
- Completed – the Application’s GDPR assessment has been done.
- Not relevant – not required to perform a GDPR assessment on this Application (e.g., it doesn’t use or transfer any relevant data for GDPR, etc.).
For this purpose, you must create a new custom field on your Application Fact Sheet using the Meta Model Configuration with the type of SINGLE_SELECT and add values for every option.
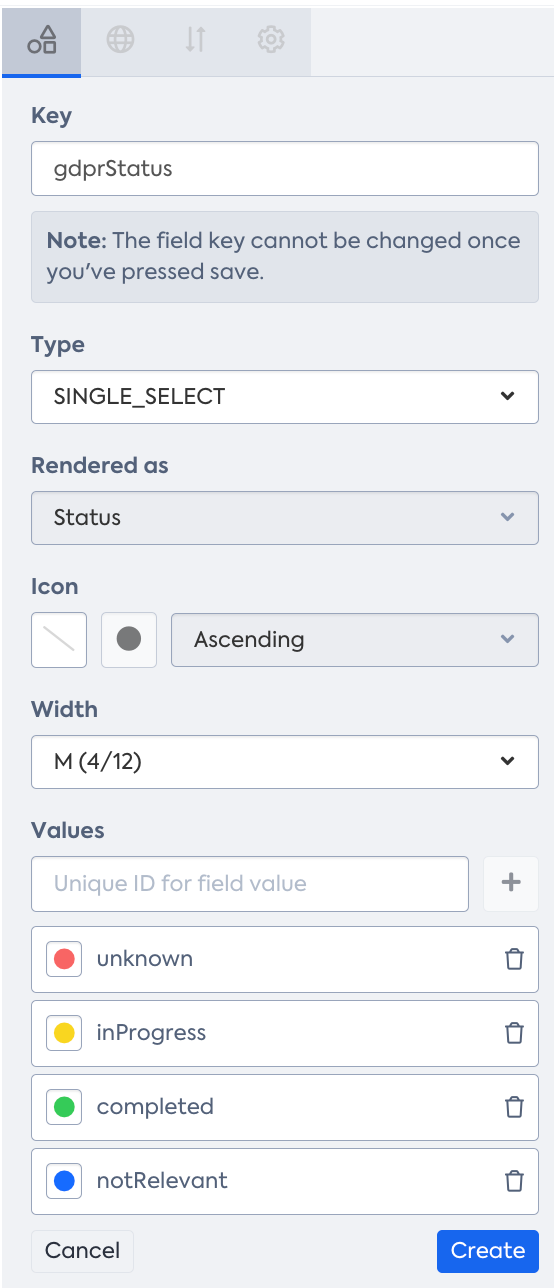
Here is a step-by-step guide to help you achieve this:
- To set all Applications to an initial state of unknown, utilize the inline edit capability in the Inventory table view. Consider using the Excel export and import capability for larger sets of Applications (over 100).
- Obtain a flat list of all Applications along with their respective GDPR status. Then, enhance comprehension by categorizing Applications based on Business Capabilities or your organizational structure within the Organization.
- Ensure each Application has a designated subscriber of type "Responsible." This individual can have a specific subscription role, such as "Application Owner" or "Business Owner.”
- Connect Applications to relevant Organizations and Business Capabilities by utilizing mandatory fields and surveys, which can significantly speed up the process and involve stakeholders effectively.
- Create an Application Landscape report and choose to cluster by Business Capabilities or Organizations, depending on what suits your stakeholders' needs better. Finally, choose the GDPR status field for a clear and focused view of the Applications' GDPR compliance.
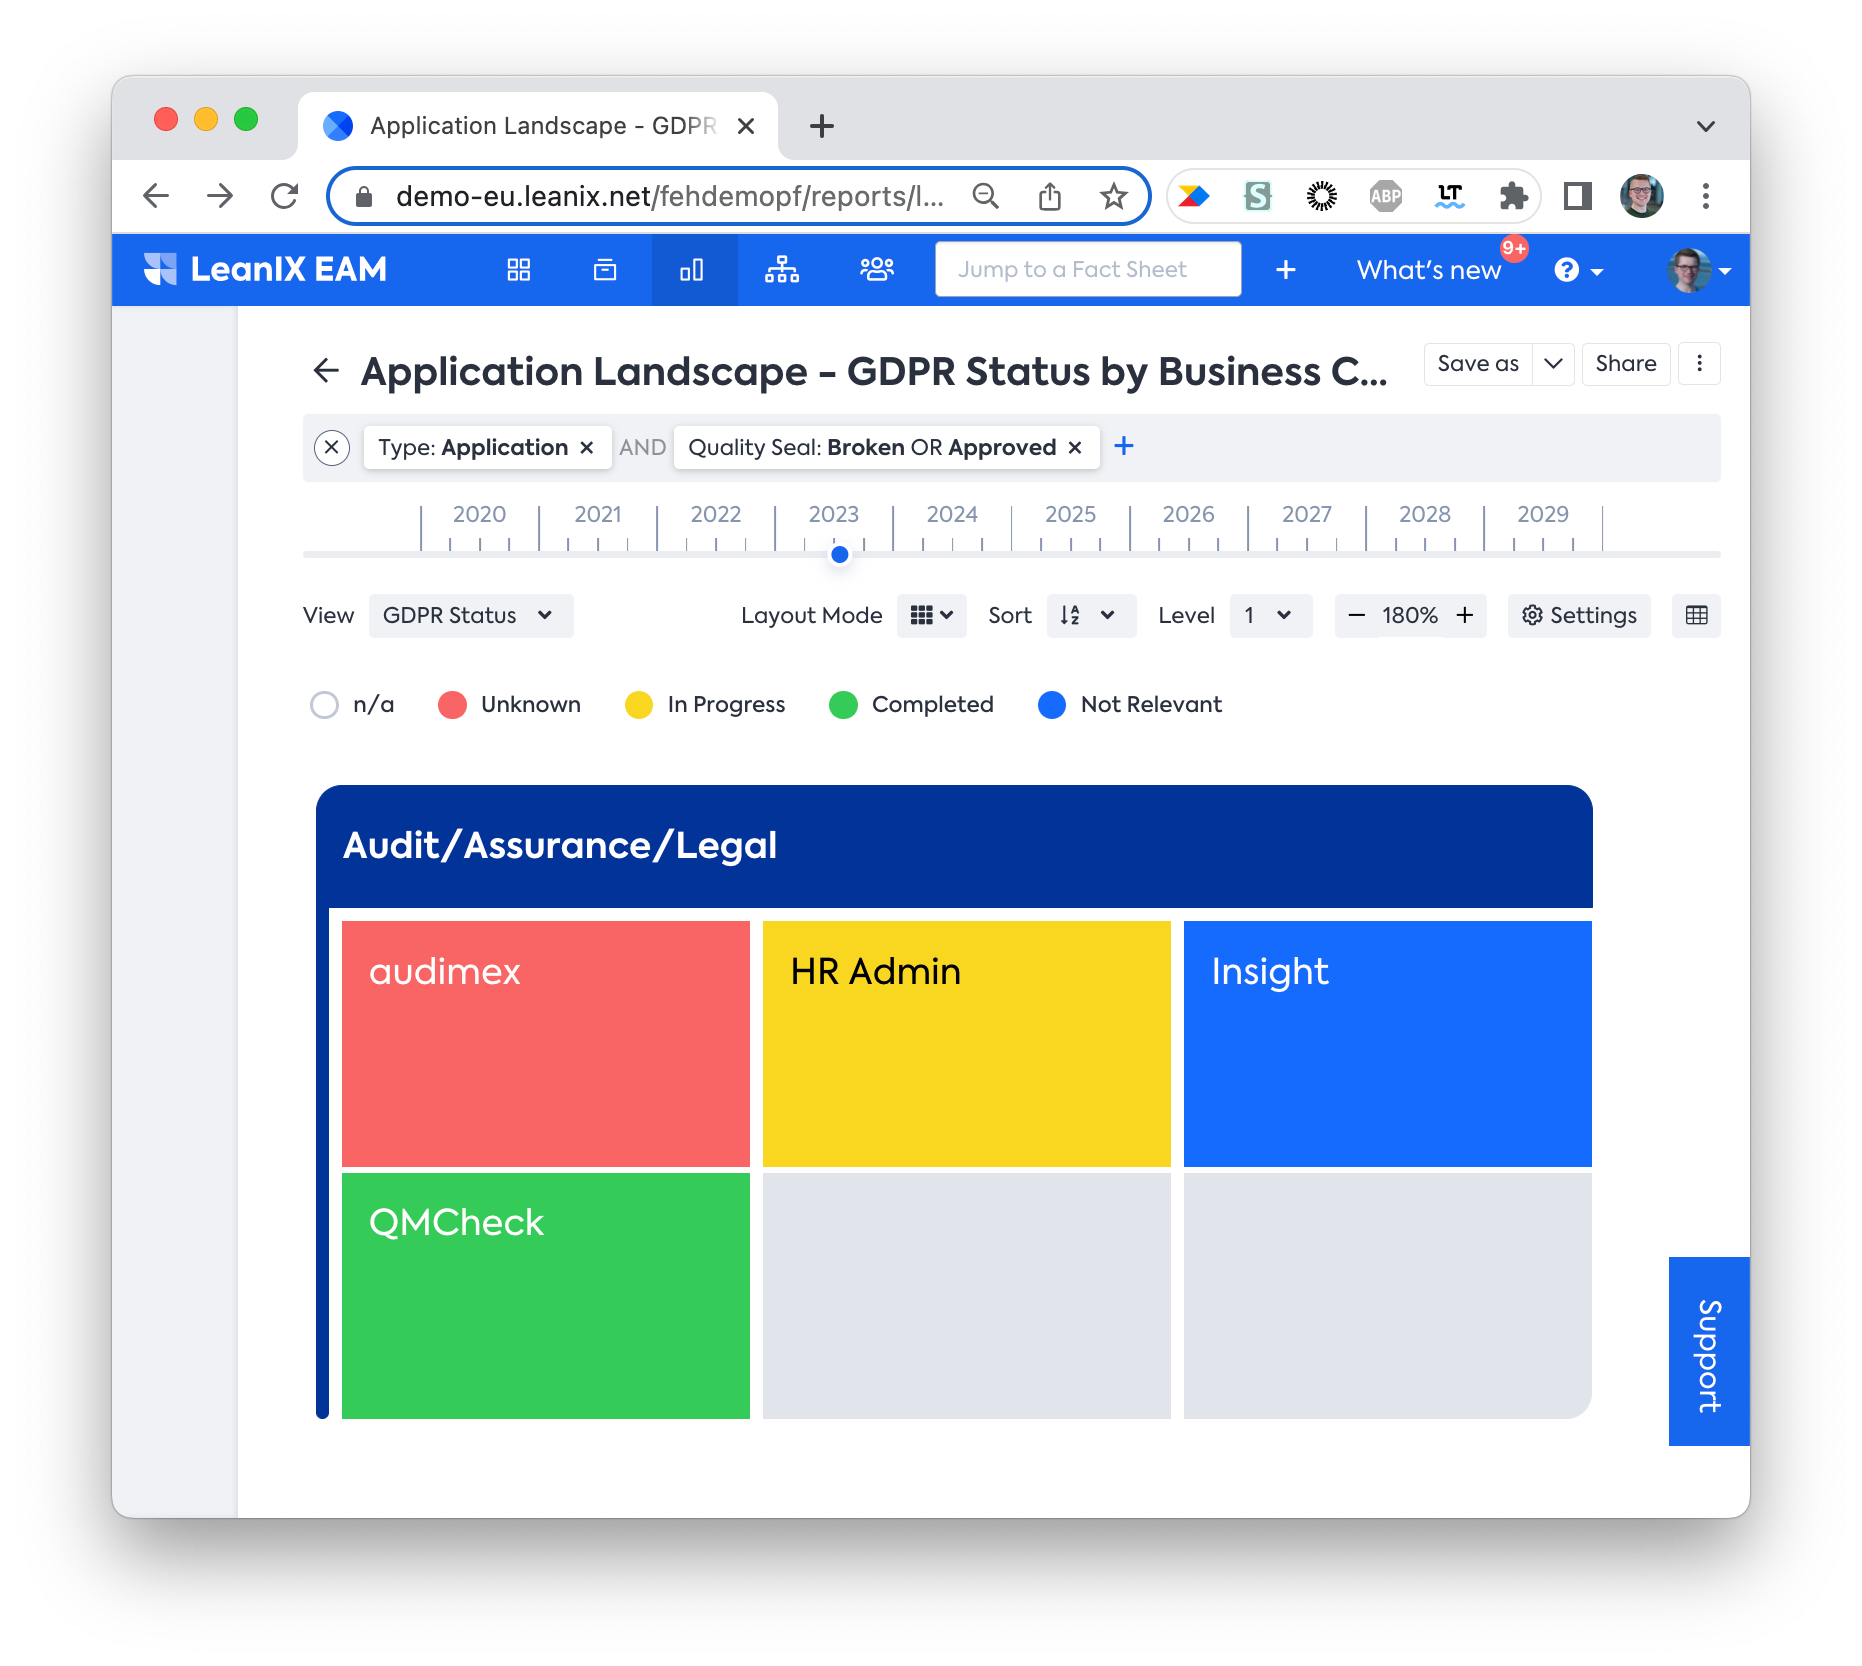
If the view isn’t available in the view drop-down, ensure the field is set to “Include in views” in Meta Model Configuration.
Updated 2 months ago