
Step 4: Evaluate your Target architecture
After having added your Transformations, you can easily visualize and evaluate your target architecture with the SAP LeanIX Architecture and Road Map Planning (previously known as BTM module). As an enterprise architect, a key responsibility is to create a target architecture that outlines the future state of how business capabilities are supported to be more agile, enhance new business models, etc. SAP LeanIX Architecture and Road Map Planning allows for tracking the impact of modernization efforts on the application landscape by automatically classifying and color coding changes, such as new applications introduced, rolled out, decommissioned, or changes in functionality and interfaces. You can see how many applications are impacted, where technical changes are needed, how many applications can be decommissioned etc.
Visualize the impact of change with the Application Landscape Report.
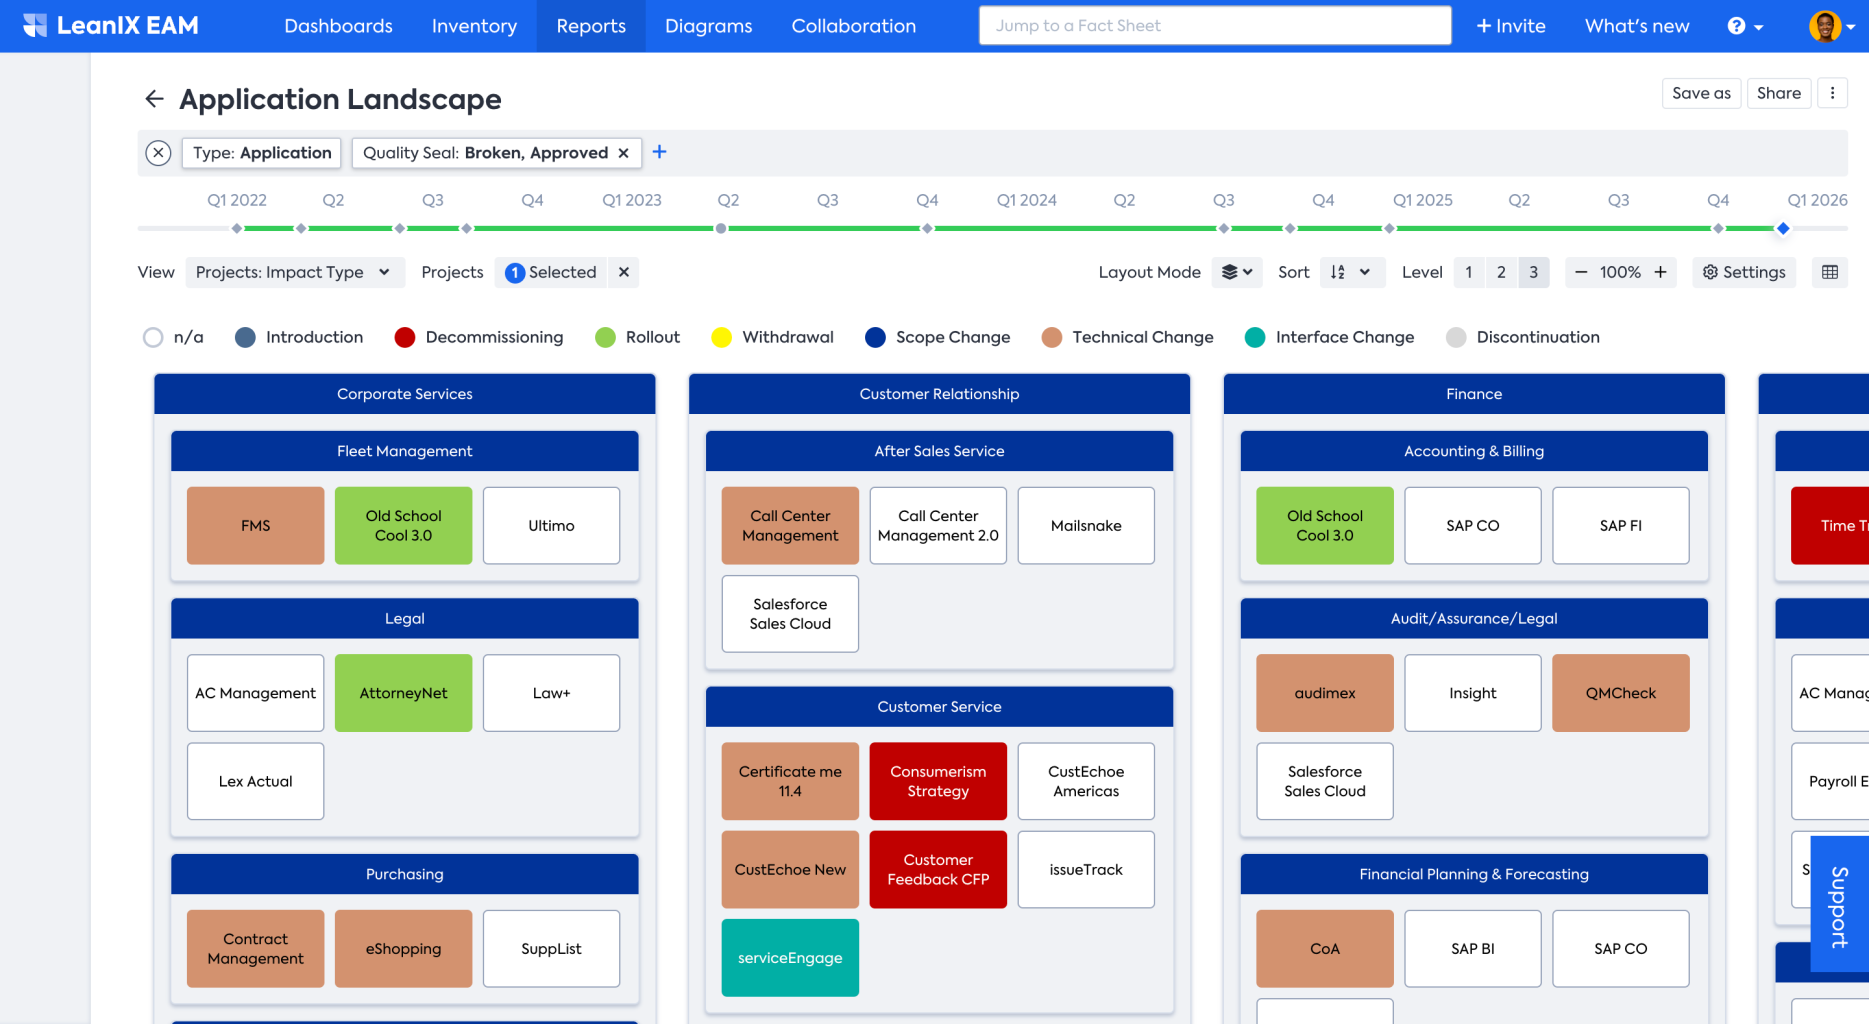
To view the impact of modernization efforts on the application landscape, make use of the Application Landscape Report.
- Select the Application Landscape Report from the Reports section of your workspace.
- Then select the relevant project whose impact you want to visualize from the Projects menu.
- Finally, apply the Projects: Impact Type view from the View menu.
Application Landscape Report provides an up-to-date view and a high-level understanding of the future state of the application landscape. You can dive deep into specific projects and impacts by selecting a project, as shown in the example. So, you can assess if your planned transformation roadmap is meeting the goals and objectives you had set when starting out. Gaining this knowledge allows for better decision-making and investment planning beyond just considering time and money by providing the context.
To take another example: Let’s say you want to know how your Application’s hosting types will have changed from the start to the end of the project, how many on-premise applications were decommissioned, and how many SaaS-, IaaS-, or PaaS-based applications were introduced. To get this view, you need to apply the Application Landscape Report as follows:
- Go to Landscape Reports and select Application Landscape.
- In the report, select the relevant project from the Projects menu. You can also filter the chosen projects according to inventory data, such as specific relationships and attributes (e.g., only active projects).
- From the View drop-down menu, choose Hosting Type to see the Target Landscape at the end of your transformation initiative. You can click on any point in time during the project’s lifecycle or milestones on the Time slider to visualize the expected landscape.
Visualize the delta between as-is and to-be (differential views & Layout Mode)
SAP LeanIX Reports allow you to visualize a differential view to contrast expected changes. To do so, hold down the Shift key and select 2 points on the Time slider. In the example below, you can see how your hosting architecture will have changed from the start to the end of the project. For example, the application ‘Call Center Management’ has changed color from grey to green, indicating its hosting type has changed from On-Premise to PaaS.
You can also change the report's Layout Mode to address different types of stakeholders. For example, as shown below, the Rolled-up Layout Mode could be more easily consumed by business owners and CIOs.
As you can easily grasp from the above example, 5 On-Premise applications are being removed, and 2 new Software as a Service, 4 Platforms as a Service, and 1 Infrastructure as a Service are being introduced in the Customer Relationship capability.
While in SAP LeanIX Application Portfolio Management you can apply the differential view mode only for Lifecycle view, with the SAP LeanIX Architecture and Road Map Planning, you have the ability to apply the differential view for a broad range of attributes, for example Lifecycle, Hosting Type, Functional Fit, Business Criticality, Technical Fit etc, and analyze the transformation across time in differential view mode.
The differential view shows the delta of your architecture at two different points in time.
Visualize impact on interfaces between Applications (Interface Circle Map)
One can visualize the impact on interfaces between Applications with the Interface Circle Map. This can be achieved by applying the differential view in the Interface Circle Map. This report shows you how the planned transformation affects the connections between applications.
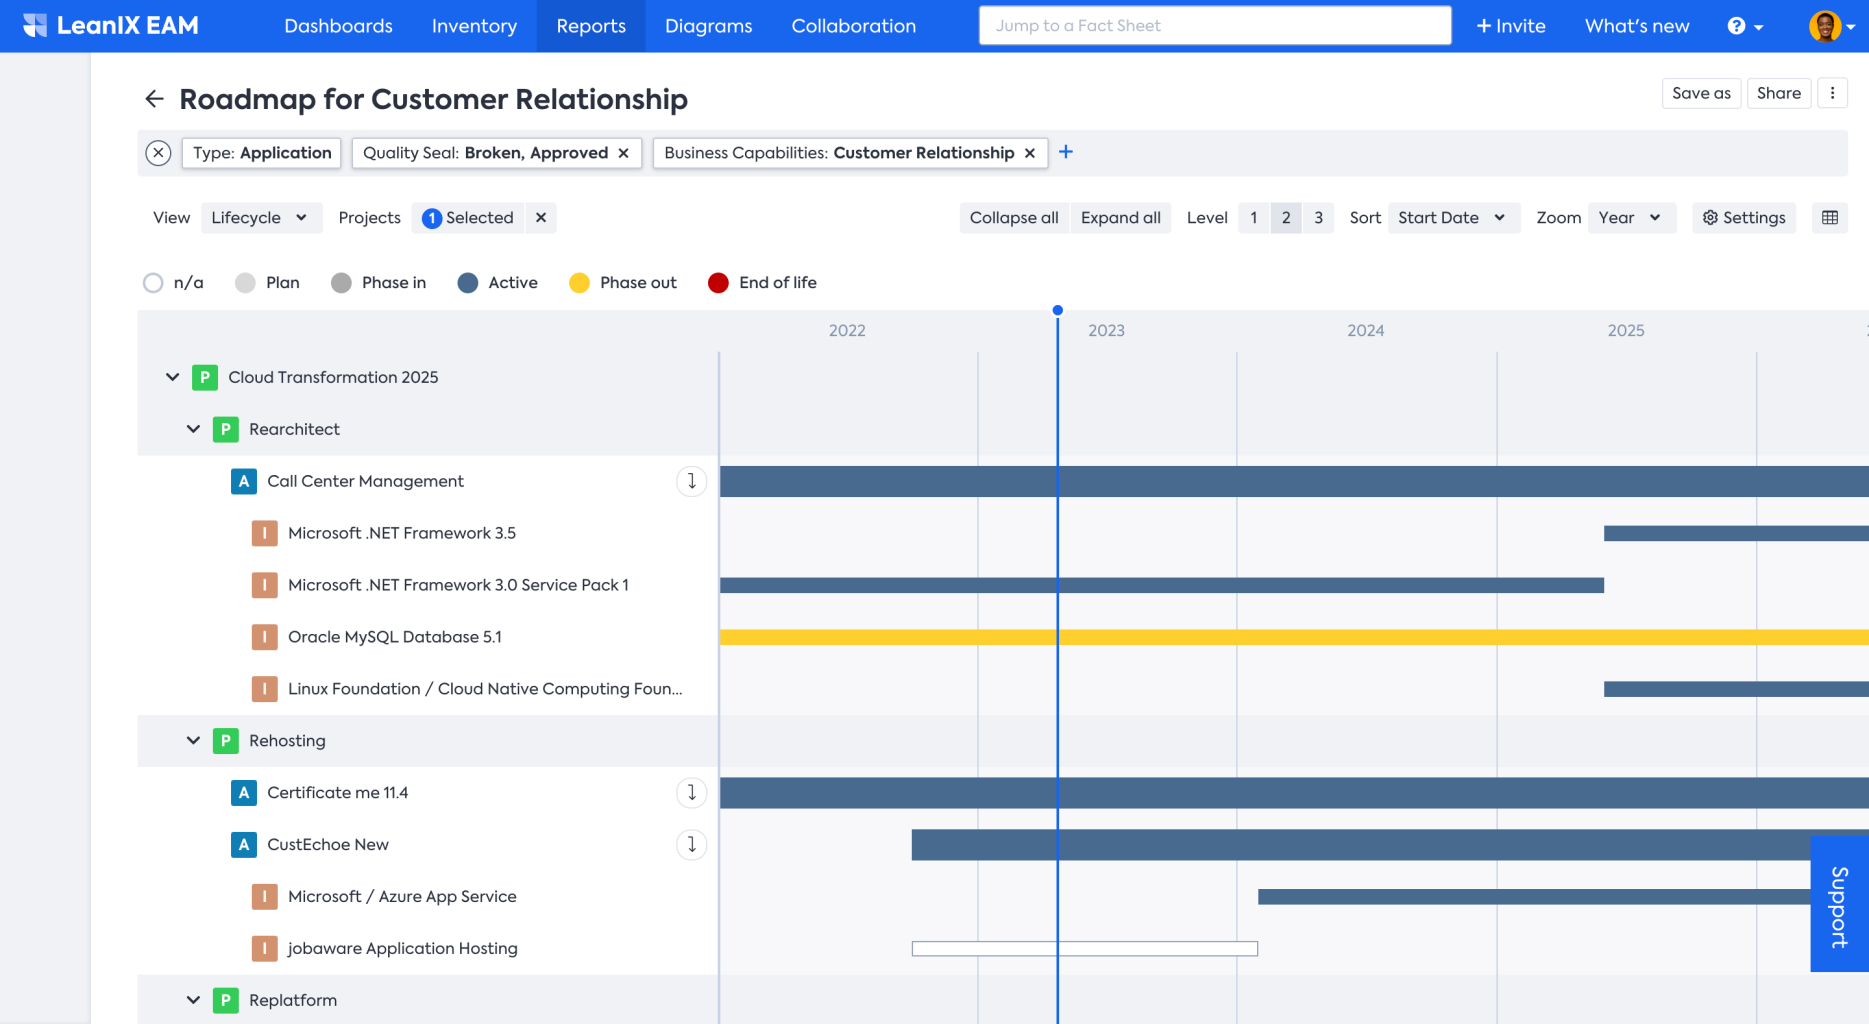
Visualize changes in the Roadmap Report
SAP LeanIX allows you to seamlessly transition from inventory information to a transformation roadmap with Roadmap Reports. You can play around with the impacts and see the changes in real-time to keep your target architecture always up to date. For example, the below roadmap focuses on the planned IT Component upgrades for the Customer Relationship Business Capability, describing components reaching End of life and otherwise being introduced for a specific set of applications.
Next Step
Updated 28 days ago