
Adding and Editing Data in Fact Sheets
Users with the appropriate permissions can add and edit data in fact sheets, while administrators can customize and manage these permissions. By switching to table view in the inventory, you can perform inline editing across multiple fact sheets, and using the import option, you can update multiple fact sheets in bulk.
Introduction
SAP LeanIX allows a collaborative approach to collect and maintain data. Stakeholders who know the required data best - such as application owners, business owners, data architects, etc. - play an important role in contributing and maintaining accurate information.
Users with appropriate permissions, by default members and administrators, can edit and add data in fact sheets. Admins can configure these permissions to include other user roles, including custom roles. They can also modify the permissions for each fact sheet type to restrict or expand write access. To learn more, see Fact Sheet Permissions.
Adding and Editing Data in a Fact Sheet
You can add and edit data in fact sheets by following these steps:
- Hover over the section you want to update and click the + Add or Edit button that appears in the upper right corner of the section.
- Add or modify the information as needed.
- Click Save to complete. If you're working through a new fact sheet, use the Save & Next button to automatically move to the next section. Use the Save & New button if you want to continue adding more items in the same section.
Adding and Editing Data in a Fact Sheet
Tip
- Navigate between fact sheet sections using the list in the upper-left corner of the Fact Sheet tab.
- Find specific sections, subsections, or fields using the search field in the upper-right corner.
- To direct users to specific information on a fact sheet, copy the link to a section or subsection and then share it.
Adding and Editing Multiple Relations
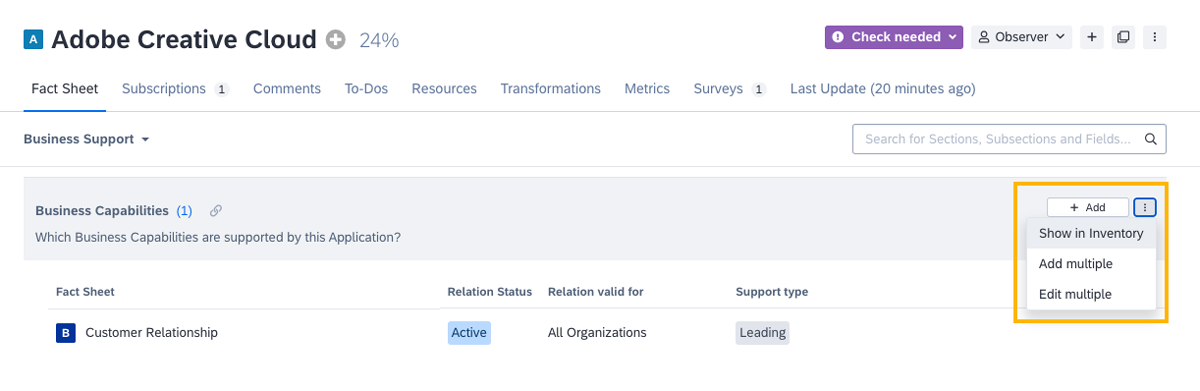
While adding or editing relations to other fact sheets, you can add or edit multiple fact sheets at once to be more efficient. To add or edit multiple relations, do the following:
- Hover over the section where you want to add or edit relations to other fact sheets.
- Click the Add multiple or Edit multiple button from the menu that appears in the upper right corner. From here, you can navigate to the inventory that's filtered for linked fact sheets.
Adding and Editing Multiple Relations
- In the filter overlay that appears, use the available filters and smart search functionality to find specific fact sheets.
- Click Use Selected Fact Sheets.
- You can now edit the ‘fields on relation’ for all the selected fact sheets simultaneously, so input the necessary information.
- Click Save or use the Save & Next button to move automatically to the next section. Use the Save & New button to continue adding more relations in the same section.
Tip
- To preview a relation in the relations explorer, hover over a linked fact sheet, then click See on Explorer on the right.
- To preview a linked fact sheet in the right-side pane, click the fact sheet name.
- To open a linked fact sheet in a new tab, hover over the fact sheet, then click the arrow button on the right.
Constraining Relations
Constraining relations introduce more granularity and specificity to relations between fact sheets. For example, when a business capability is related to an application fact sheet, it implies that the application supports that business capability in all the organizations it is part of. However, you can constrain that relation to only those organizations where the application actually supports that business capability.
While constraining relations add granularity, they also increase the maintenance effort, and hence, only a few relations are available as constraining relations. For a relation, the presence of the Relation valid for column indicates if it can be constrained. To constrain a relation, click an item in the column, adjust the scope by adding or removing fact sheets, and then click Save.
Constraining Relations
Best Practice
Start without relation constraints and add them later only if needed.
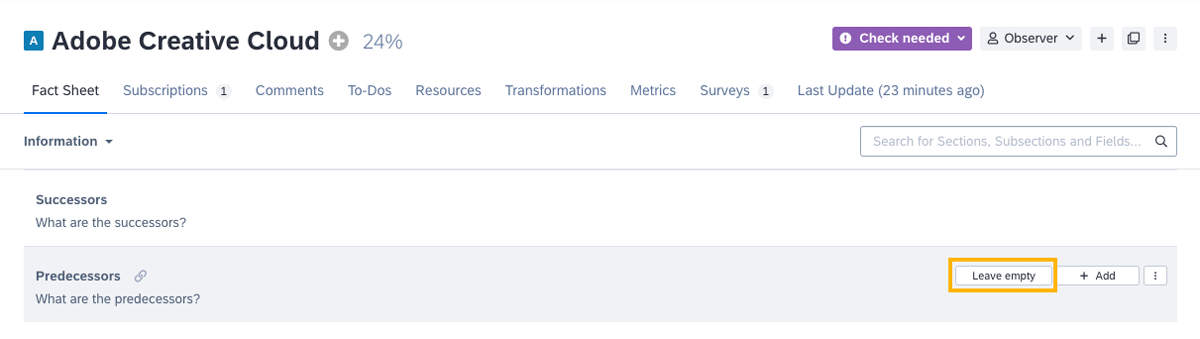
Leaving a Relation Empty
A relation can intentionally be left blank by selecting Leave Empty. This indicates that no relevant information is mistakenly missing from that field. The relation is treated as filled for calculating the fact sheet completion score, and you can use 'Leave Empty' as a filter criterion in the inventory.
Leaving a Relation Empty
Deleting Relations
You can delete the added relations in fact sheets by following these steps:
- Hover over the relation and click the Edit button that appears in the upper right corner.
- In the bottom left corner, click Delete entry.
Bulk Updating Data in Inventory Table View
By switching to table view mode in the inventory, you can add or update data across multiple fact sheets in one go.
Table View
In the inventory, switching to the table view mode displays factsheets in a tabular format, with factsheets in rows and their attributes as columns. This offers you a structured way to visualize your inventory data and is valuable for conducting comparative analyses. You can easily scan, sort, and compare data across different criteria and make informed decisions. More importantly, you can add or edit data directly in the table, just as you would in a spreadsheet.
You switch from list view to table view by selecting the As Table icon.
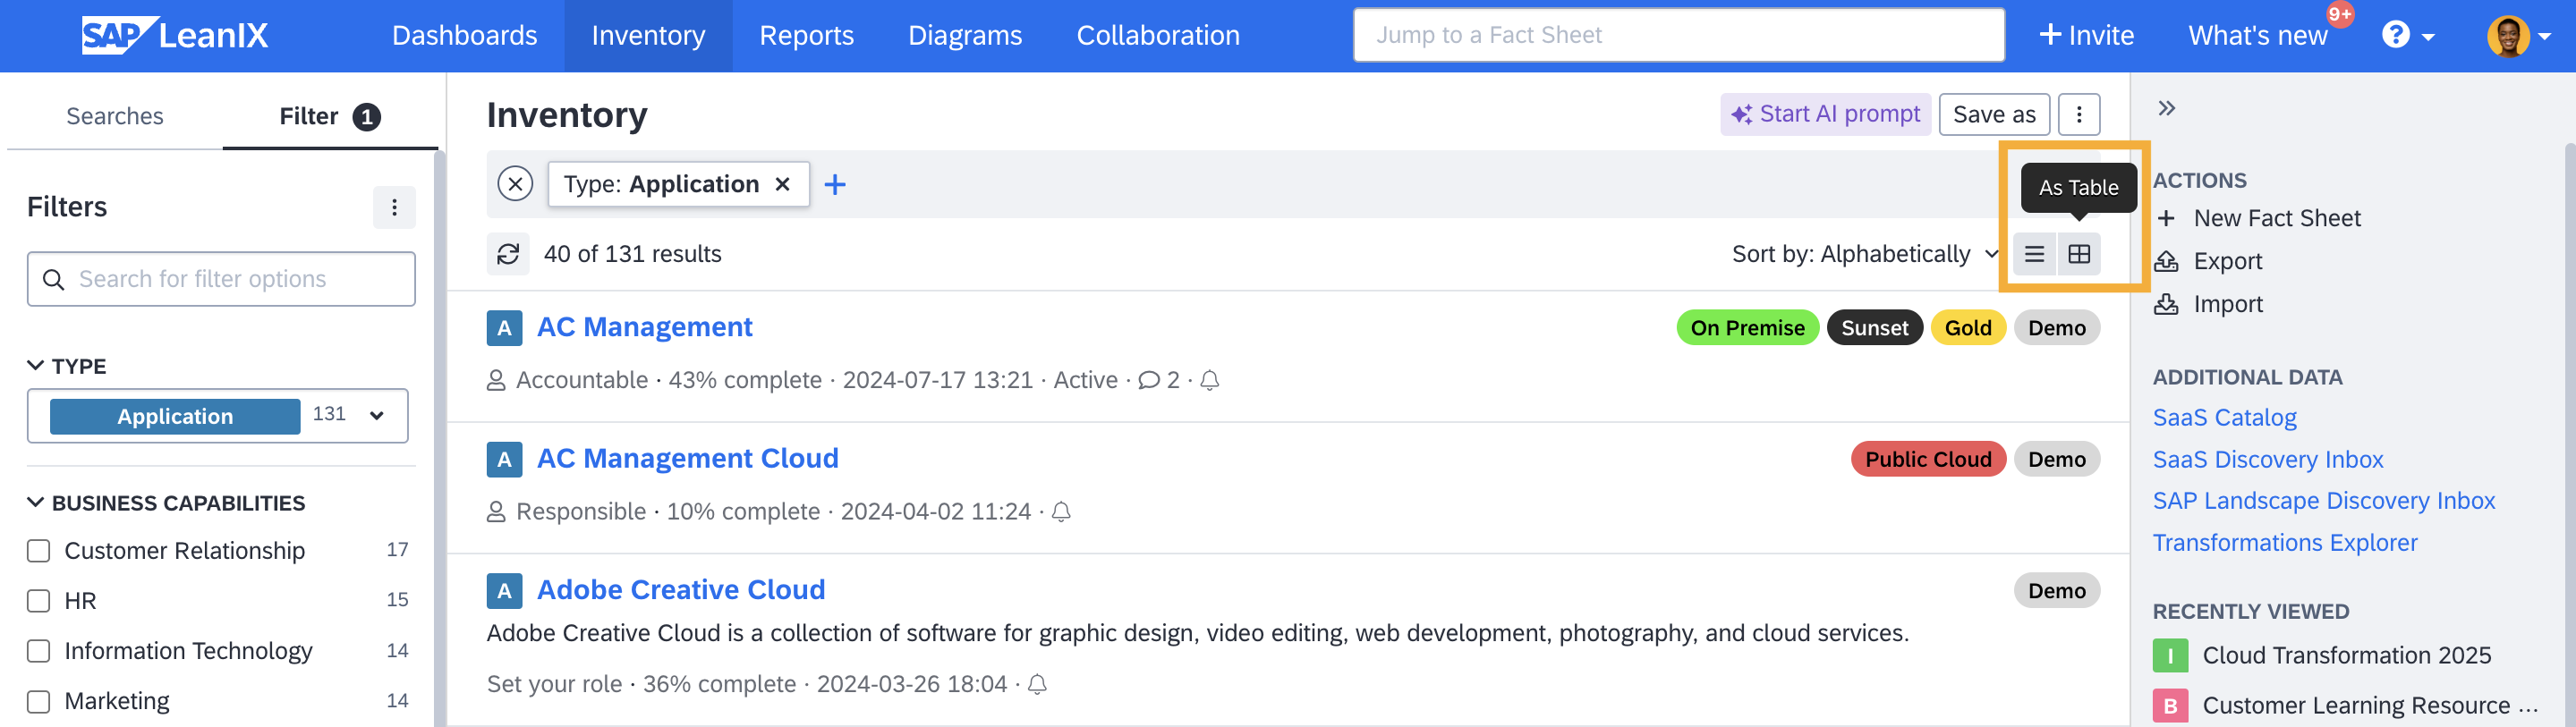
Switching to Table View in the Inventory
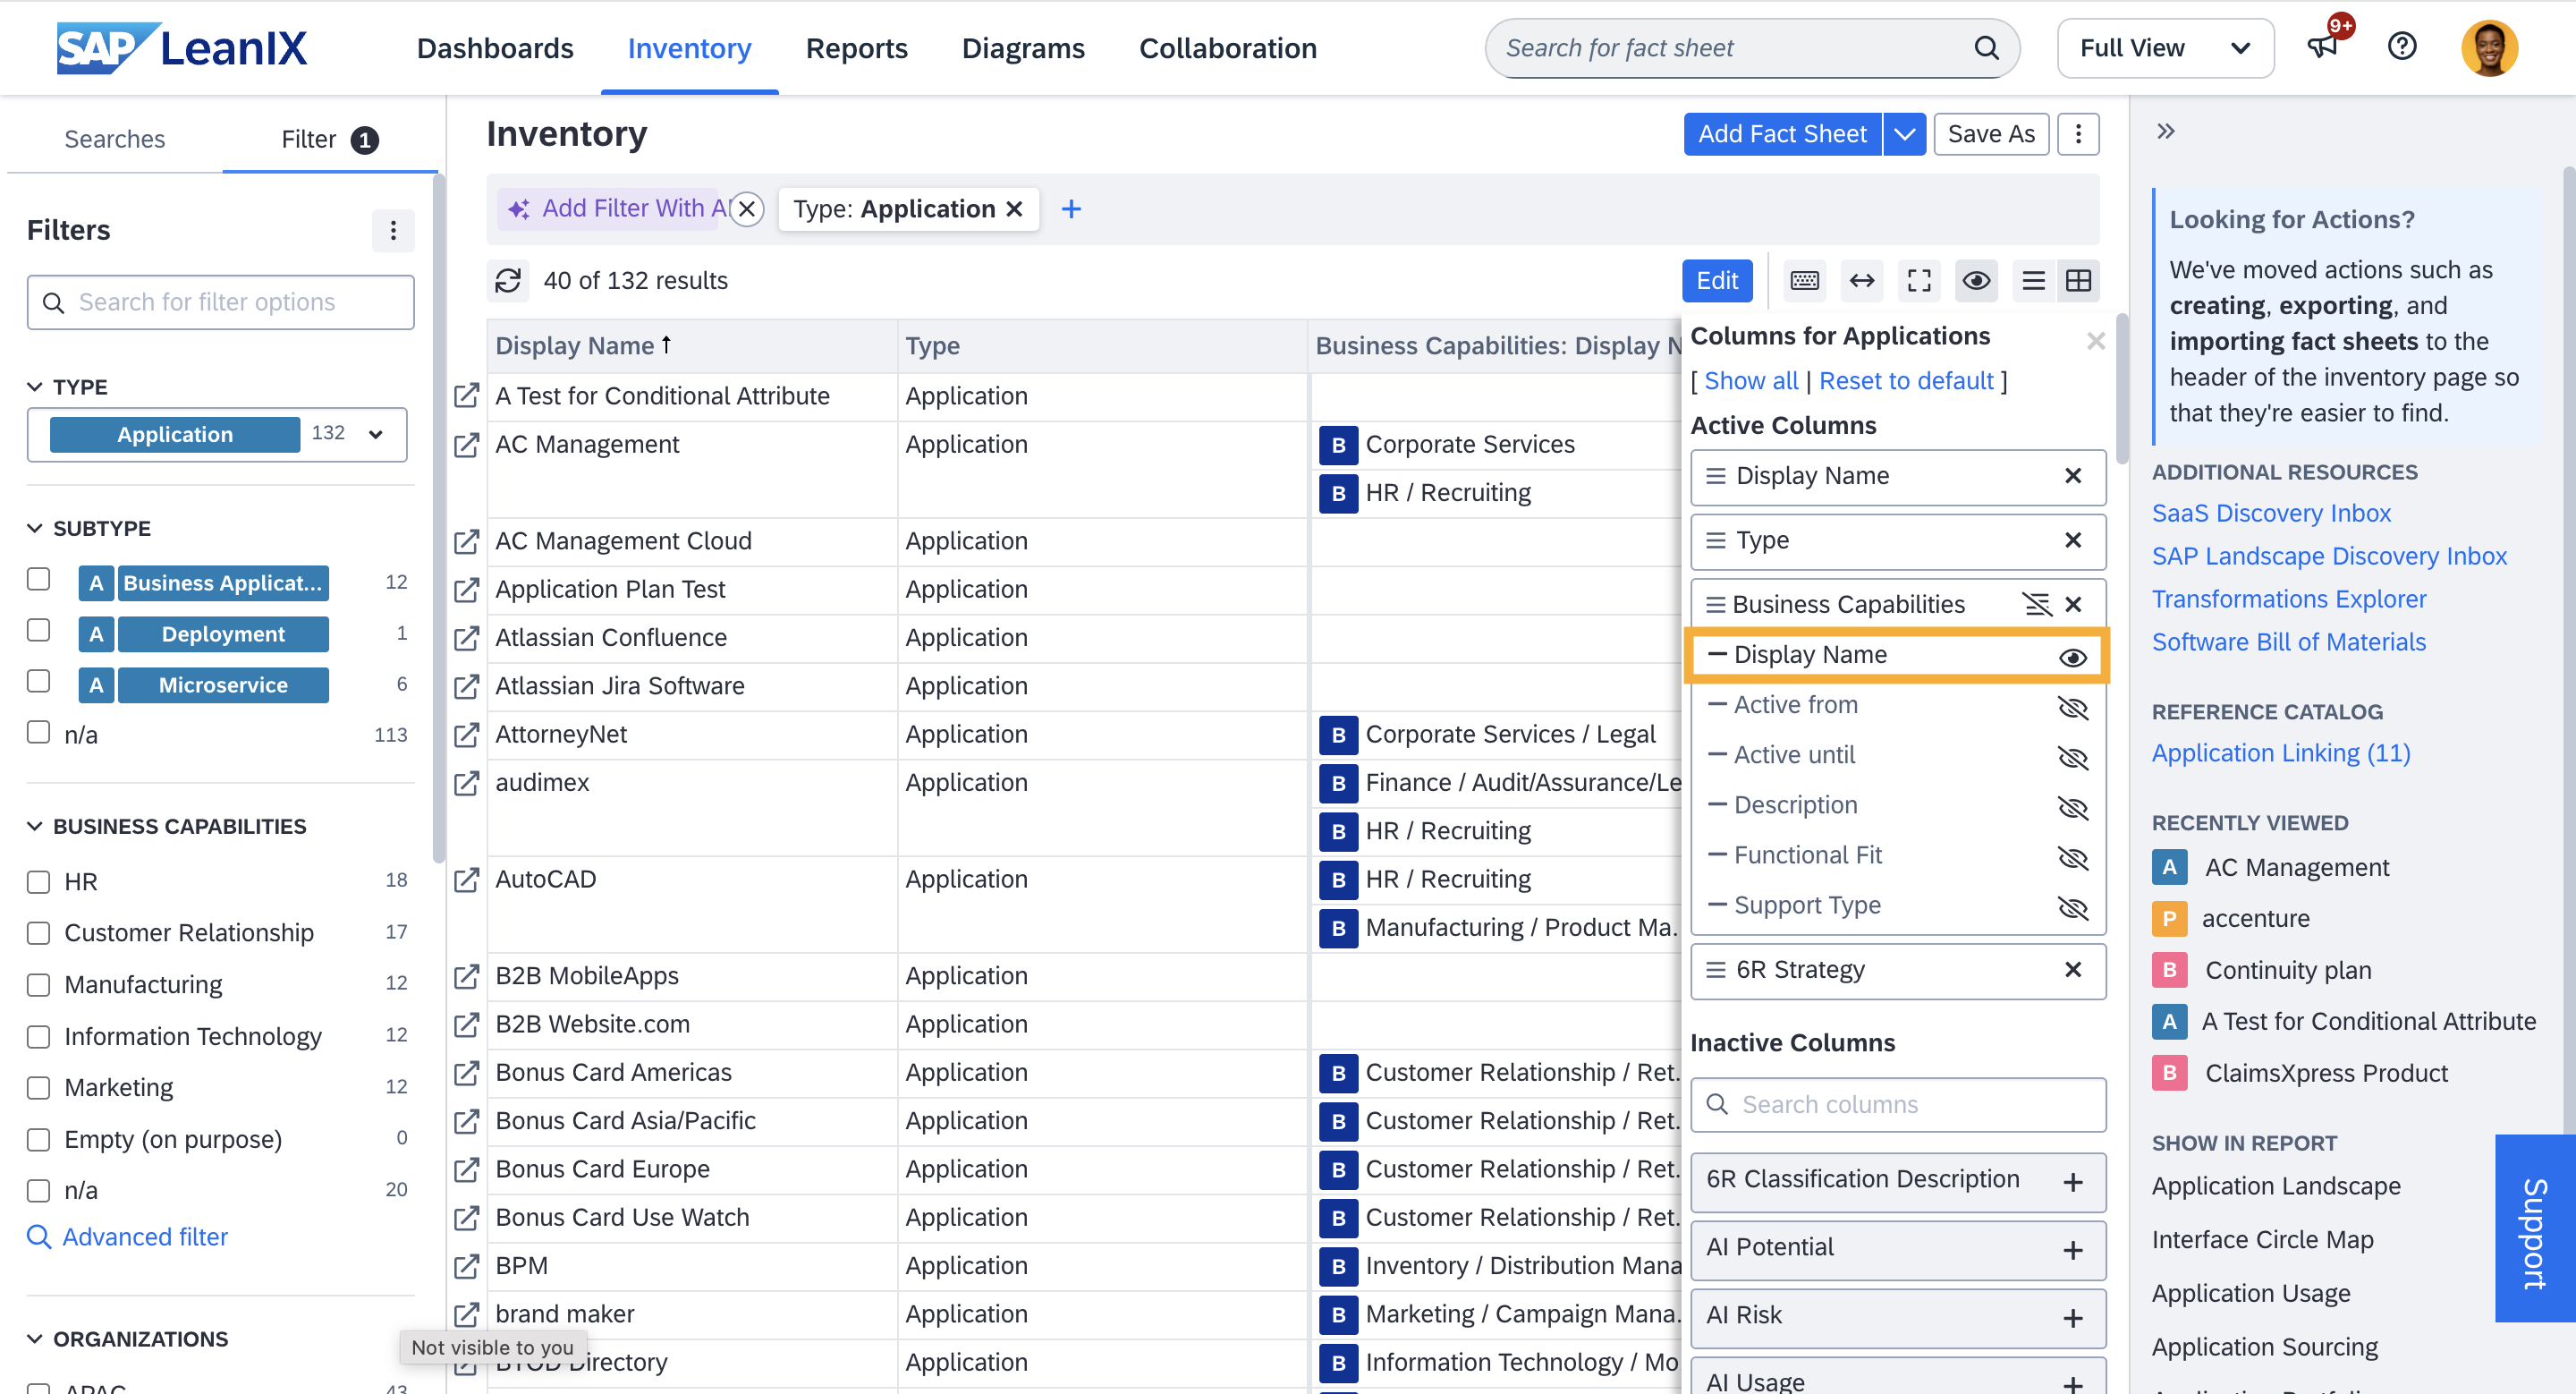
By default, the table shows basic information such as fact sheet name and type, but you can add further columns to display more attributes of the fact sheets. To add or hide columns in the table, do the following:
- At the top right of the table, click the eye icon. This opens a panel for selecting the fact sheet attributes you want to include as columns.
- From under the Inactive columns section, choose and add the column to be shown by clicking the '+' icon. You can also search for a column by its title.
Note
The columns available for selection depend on the type of fact sheet you are working with. If you haven't filtered for a specific fact sheet type, some columns—particularly those relevant only to certain fact sheet types, like specific fields or tag groups—will not be visible or available for selection.
- Under the Active columns section, drag and reorder the items as needed. To exclude an existing column, click 'x' next to the item.
Show or Hide Columns in the Table View
Inline Editing
In the table view, you can do inline editing, allowing you to quickly update and modify information for multiple fact sheets in one go. Click Edit at the top right of the table to activate inline editing. You can do the following actions:
- Add or update content: Click on any cell to add or edit its value directly, including relations.
- Copy and paste: Copy values from one cell to another using the right-click menu or your system's default shortcuts for copy and paste functions.
- Autofill cells: Autofill cells by dragging the handle at the bottom right corner of the selected cell downwards.
- Fill date fields from the calendar: Double-click on date fields, such as lifecycles, and choose a date from the calendar overlay that appears.
- Choose values for multi-select fields: Double-click on a multi-select field to open a dropdown menu, then choose from the available values.
Once you have made changes to the fact sheets in the inventory, the total count of changes is shown at the top of the inventory table. All the cells you changed are highlighted with a change in color, making it easy to review. If everything is correct, save the changes by clicking the Save button in the top right corner.
Inline Editing in Table View Mode
Editable and Non-Editable Fields
Not all fields can be edited in inline editing, and such fields are greyed out in the table during editing.
| Editable Fields | Non-Editable Fields |
|---|---|
| Text Number Single and multi-select fields Date Tags Subscriptions Quality seal* Relation** Fields on relations | Base Fields (e.g., Fact sheet type, ID, etc.) Calculated Fields (e.g., Display Name) Documents |
*Quality seal can be edited only when one specific fact sheet type is listed in the table.
**To edit relations, make sure to unhide the relation’s display name by clicking the eye icon.
Unhiding the Relation’s Display Name to Edit Relations
Keyboard Accessibility
You can navigate and perform actions in table view using keyboard keys. Use the arrow keys to move through cells, and press Enter to select and edit a cell. Clicking Enter on a column header will sort the table by that column.
Bulk Updating Data Through Excel File
SAP LeanIX’s import feature allows you to efficiently add, update, and remove data in fact sheets through an Excel file. Here’s a high-level guide to bulk updating your data:
- Use the export option on the right-side panel of the inventory to create a template file for import. This file includes columns for each necessary fact sheet attribute in the proper format. You can choose which columns to include or exclude by switching to table view and selecting and un-hiding the attributes to be shown before exporting.
- In the exported template, each row corresponds to a fact sheet, and each column corresponds to a fact sheet attribute. Fill or update the data in the spreadsheet as required.
- Import the completed Excel file back into SAP LeanIX through the import option on the right-side panel of the inventory. Based on the changes made in the spreadsheet, this process will add, update, or remove data in your fact sheets.
For a detailed guide, see Importing Fact Sheet Data Through Excel File.
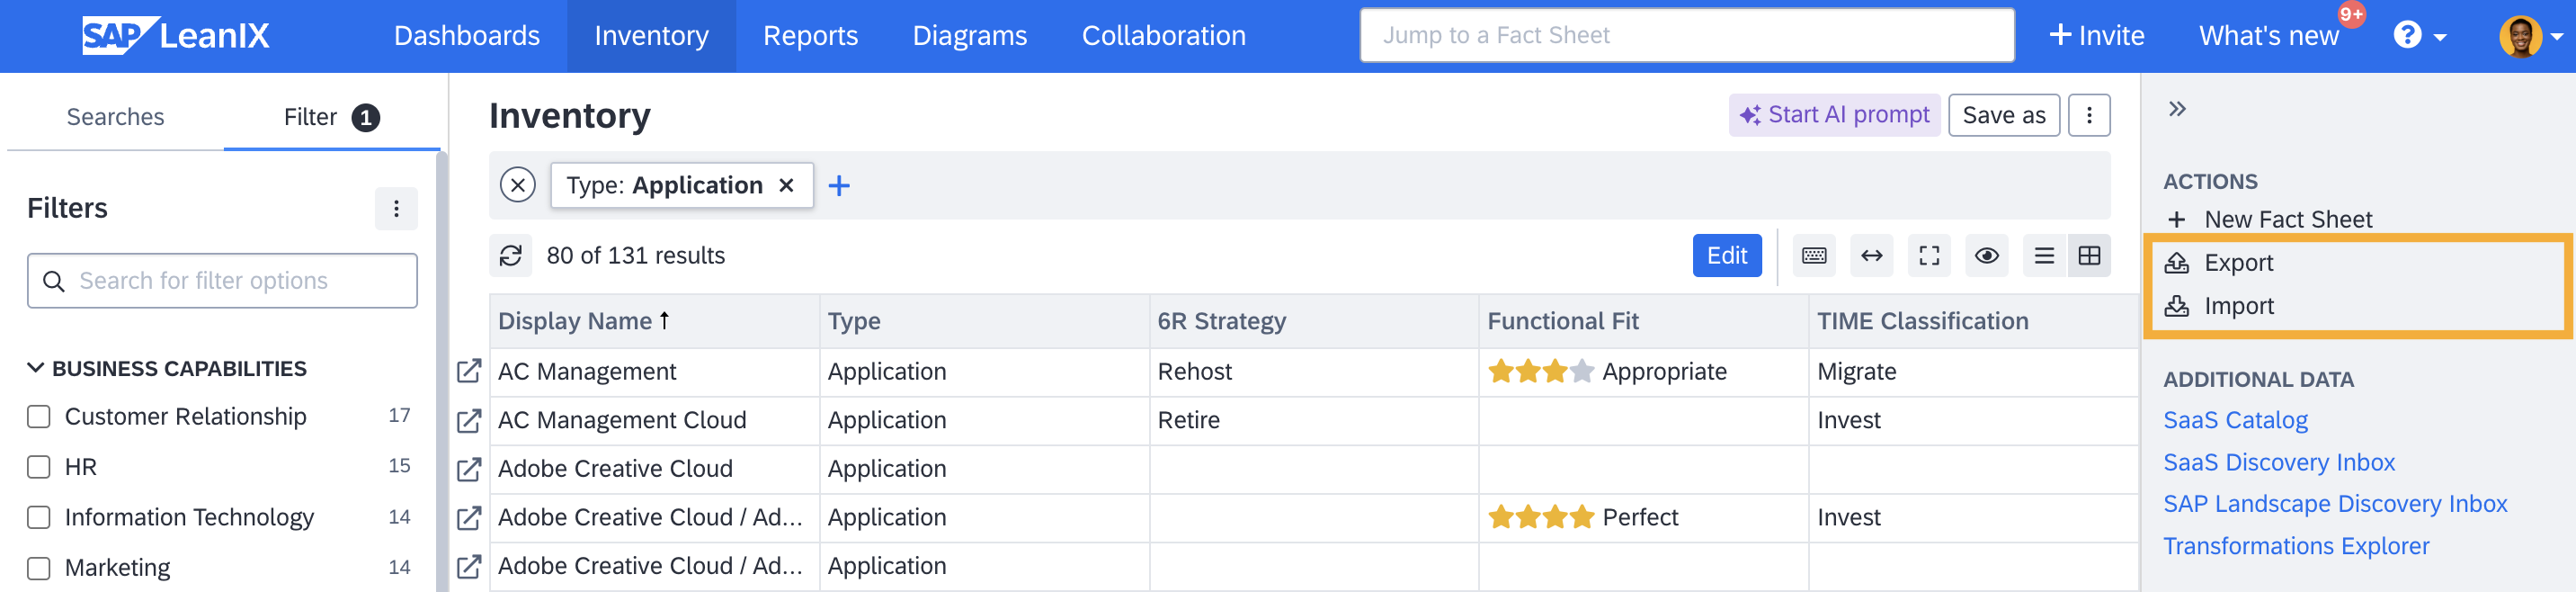
Bulk Updating Data Through Export and Import Feature
Best Practices
SAP LeanIX offers several features to help maintain and improve the quality and completeness of your data. These include fact sheet completeness, mandatory fields, quality seals, surveys, reference catalog, discoveries, and integrations. Learn more about them in Increasing Your Data Quality.
When updating SaaS applications, IT components, and SAP applications, leverage the reference catalog and discovery features. The reference catalog intelligently recommends suitable items for fact sheets, and once linked, important attributes like the product category, SSO, hosting details, lifecycles, version specifics, and more are automatically updated. This enhances data quality and accelerates data entry. To learn more, see Reference Catalog and Discoveries and Integrations.
Updated 28 days ago