
Layout Modes in Landscape and Matrix Reports
Landscape and Matrix reports can change their layout for different visualizations as well as better condensation of information, e.g., by rolling up the contents of every cluster or cell.
Layout Modes
The following layout modes are available on Landscape and Matrix reports:
| Layout | Landscape | Matrix |
|---|---|---|
| Detailed (legacy) | Available | Available |
| Rolled-up | Available | Available |
| Stacked | Available | Not Available |
| Detailed (new design) | Available | Not Available |
To get to the different layout modes, simply use the dropdown menu at the top right of any matrix or landscape report and pick another mode.
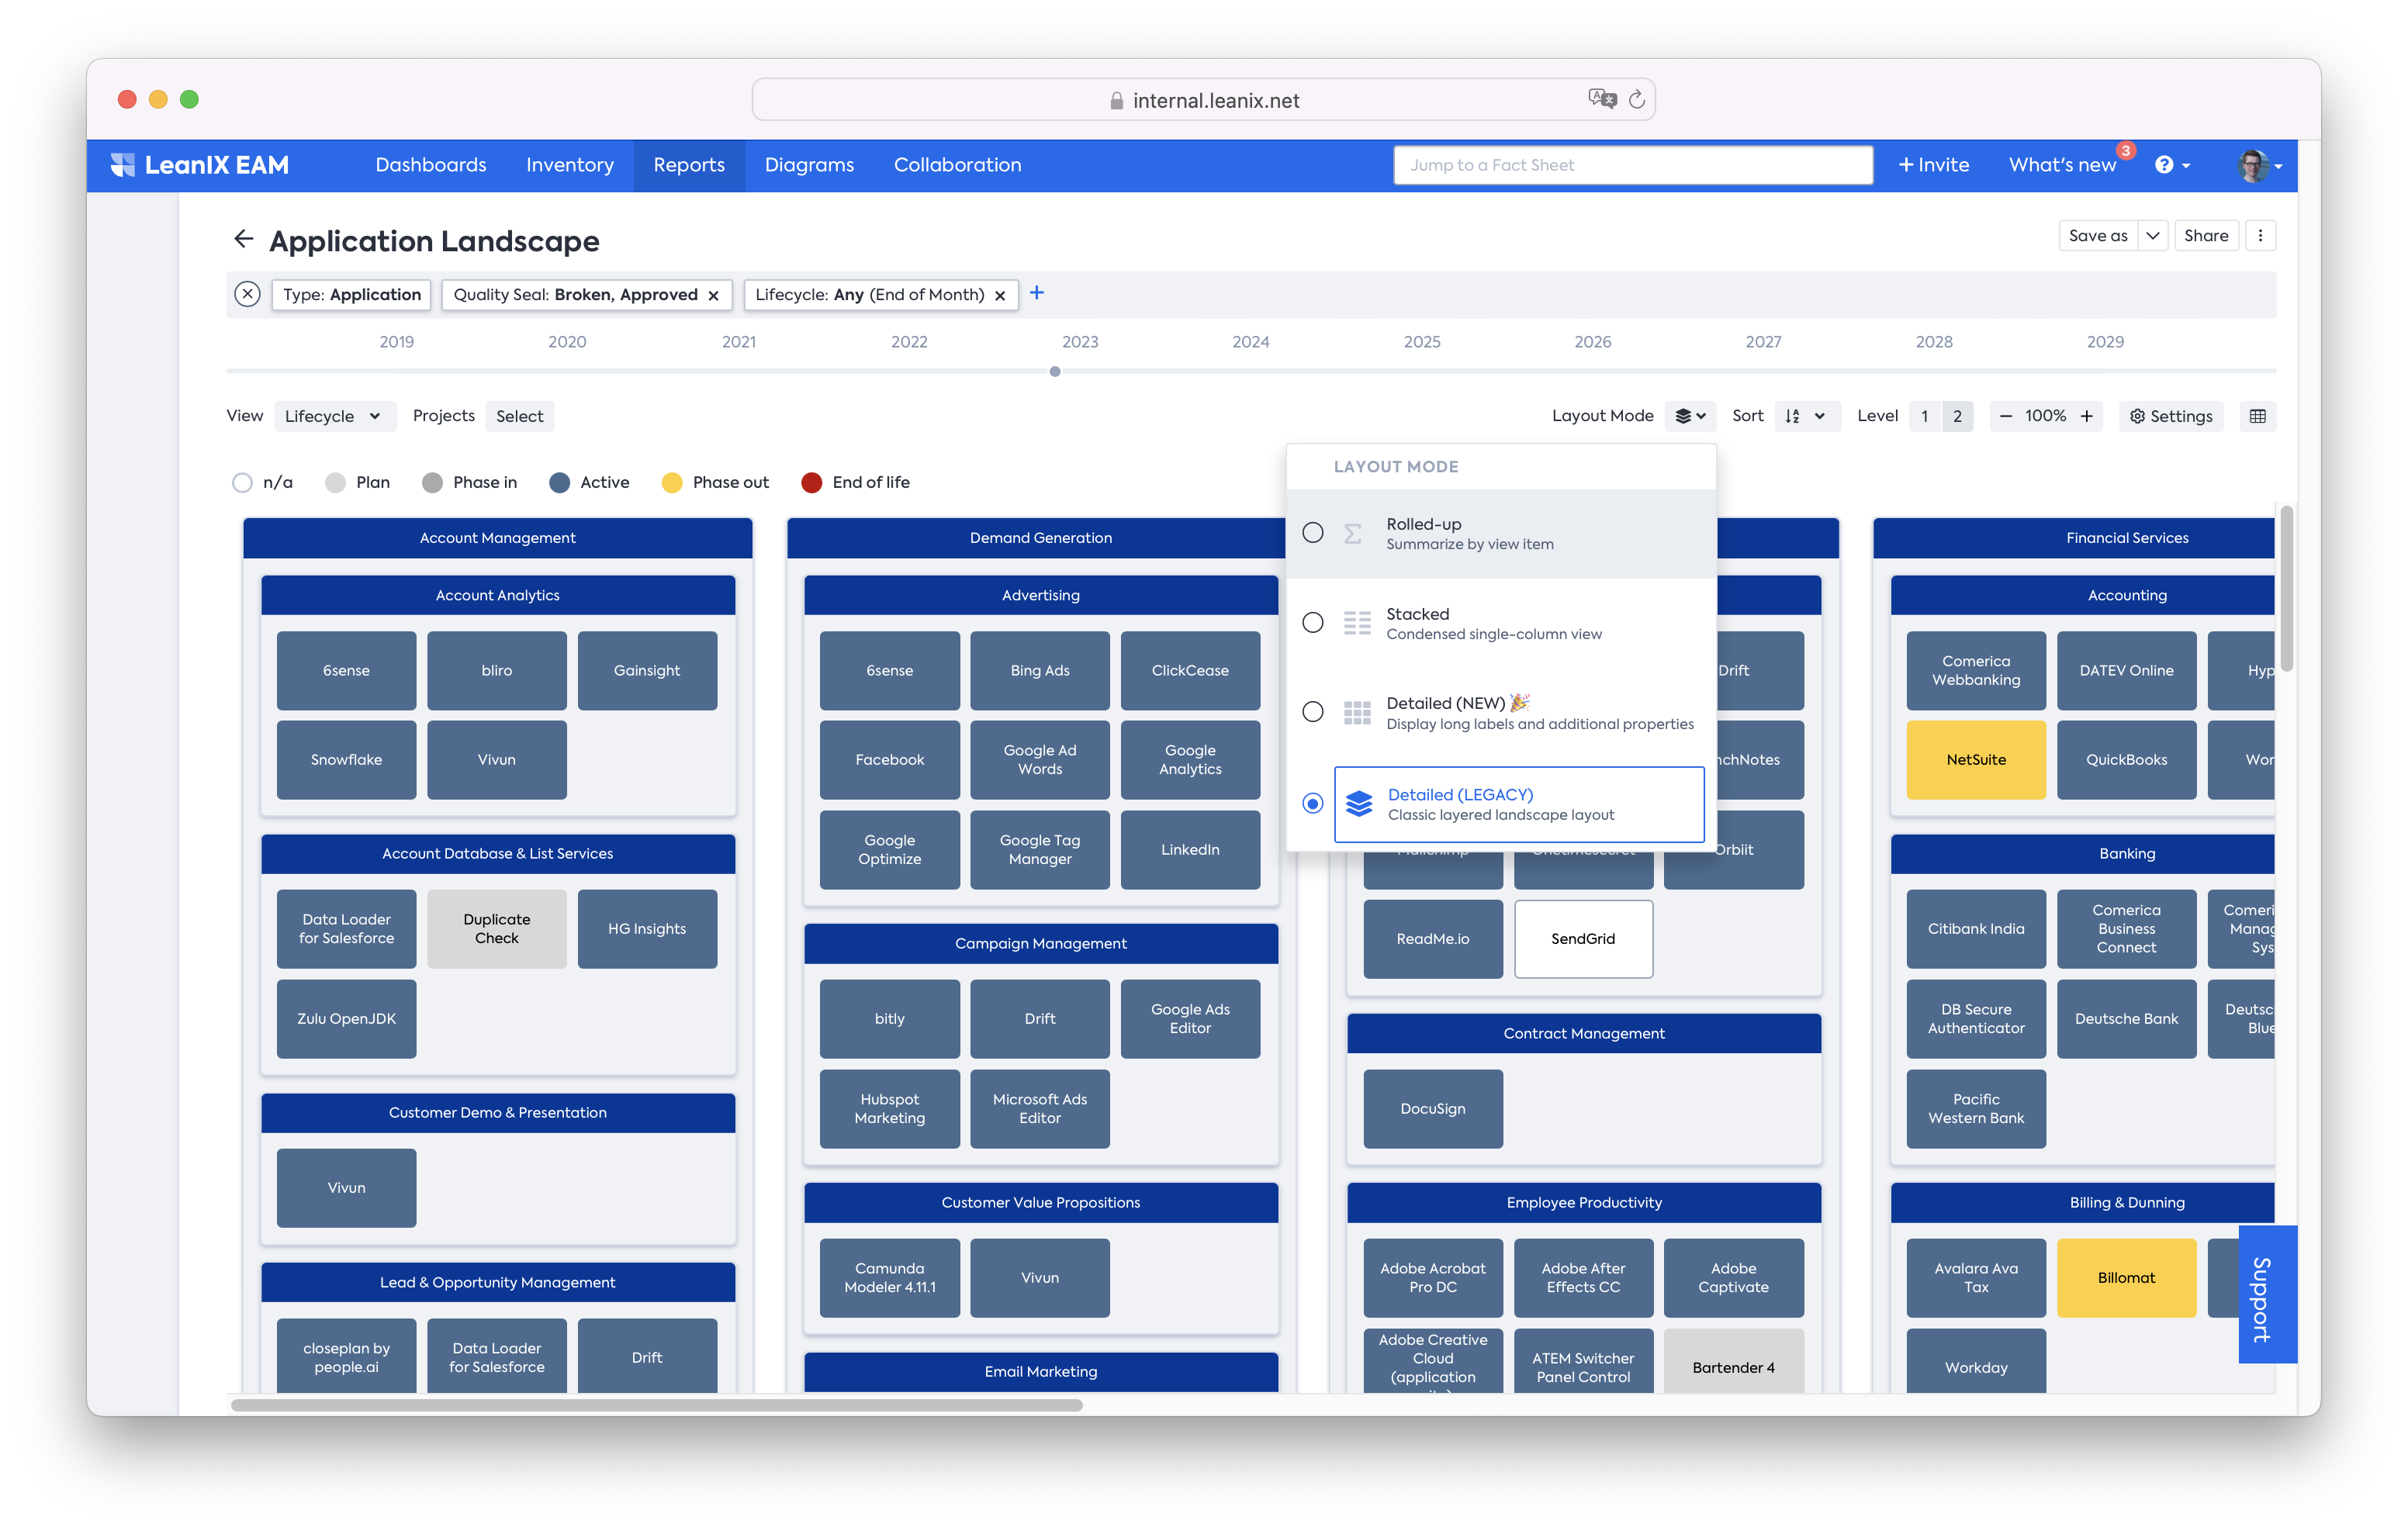
Rolled-up layout
In the rolled-up layout, any clusters get aggregated by the chosen view.
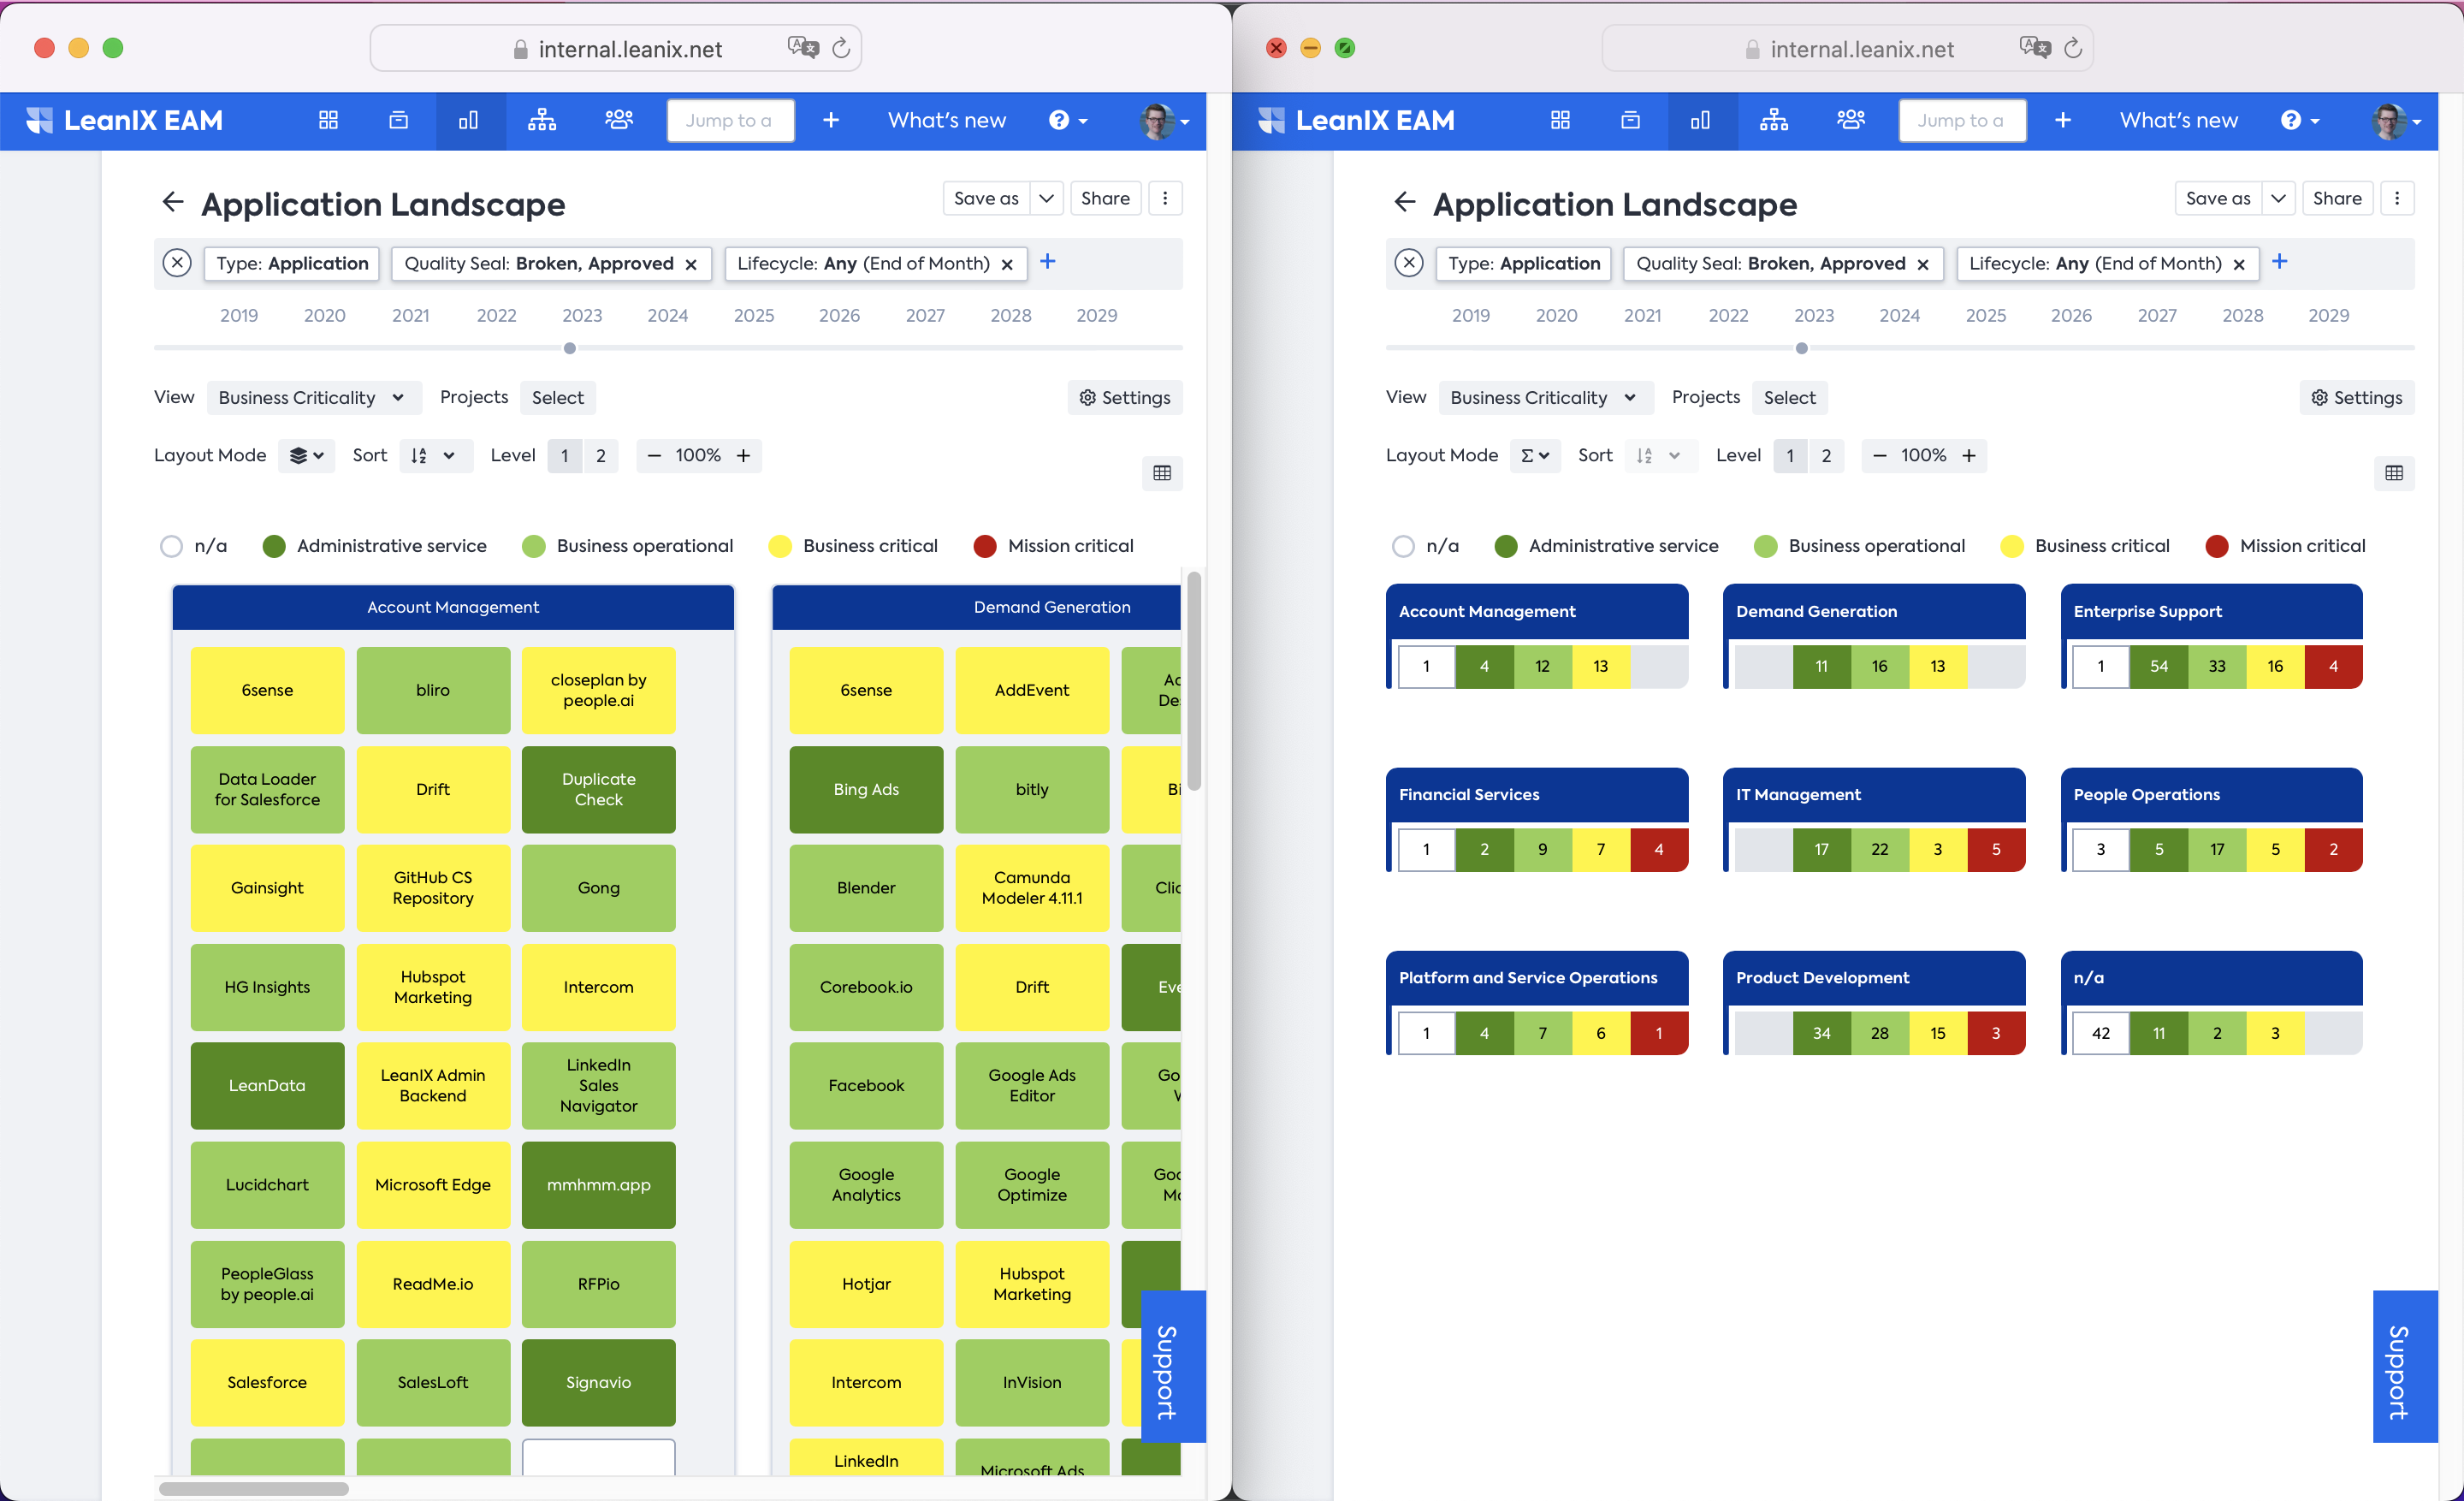
Left side: Detailed Layout
Right side: Roll up Layout
The rolled-up layout allows for an easier consumption of more information and also to quickly spot and identify the issues in your landscape or matrix report.
White space / grey space in rolled-up layout
In the rolled-up layout, LeanIX maintains the positions of any view buckets in every cell or cluster, so that visually impaired persons can still identify what bucket belongs where. Also, this makes the consumption of data very fast and lets you identify issues quickly.
Especially on matrix reports, the easier consumption of data gets apparent:
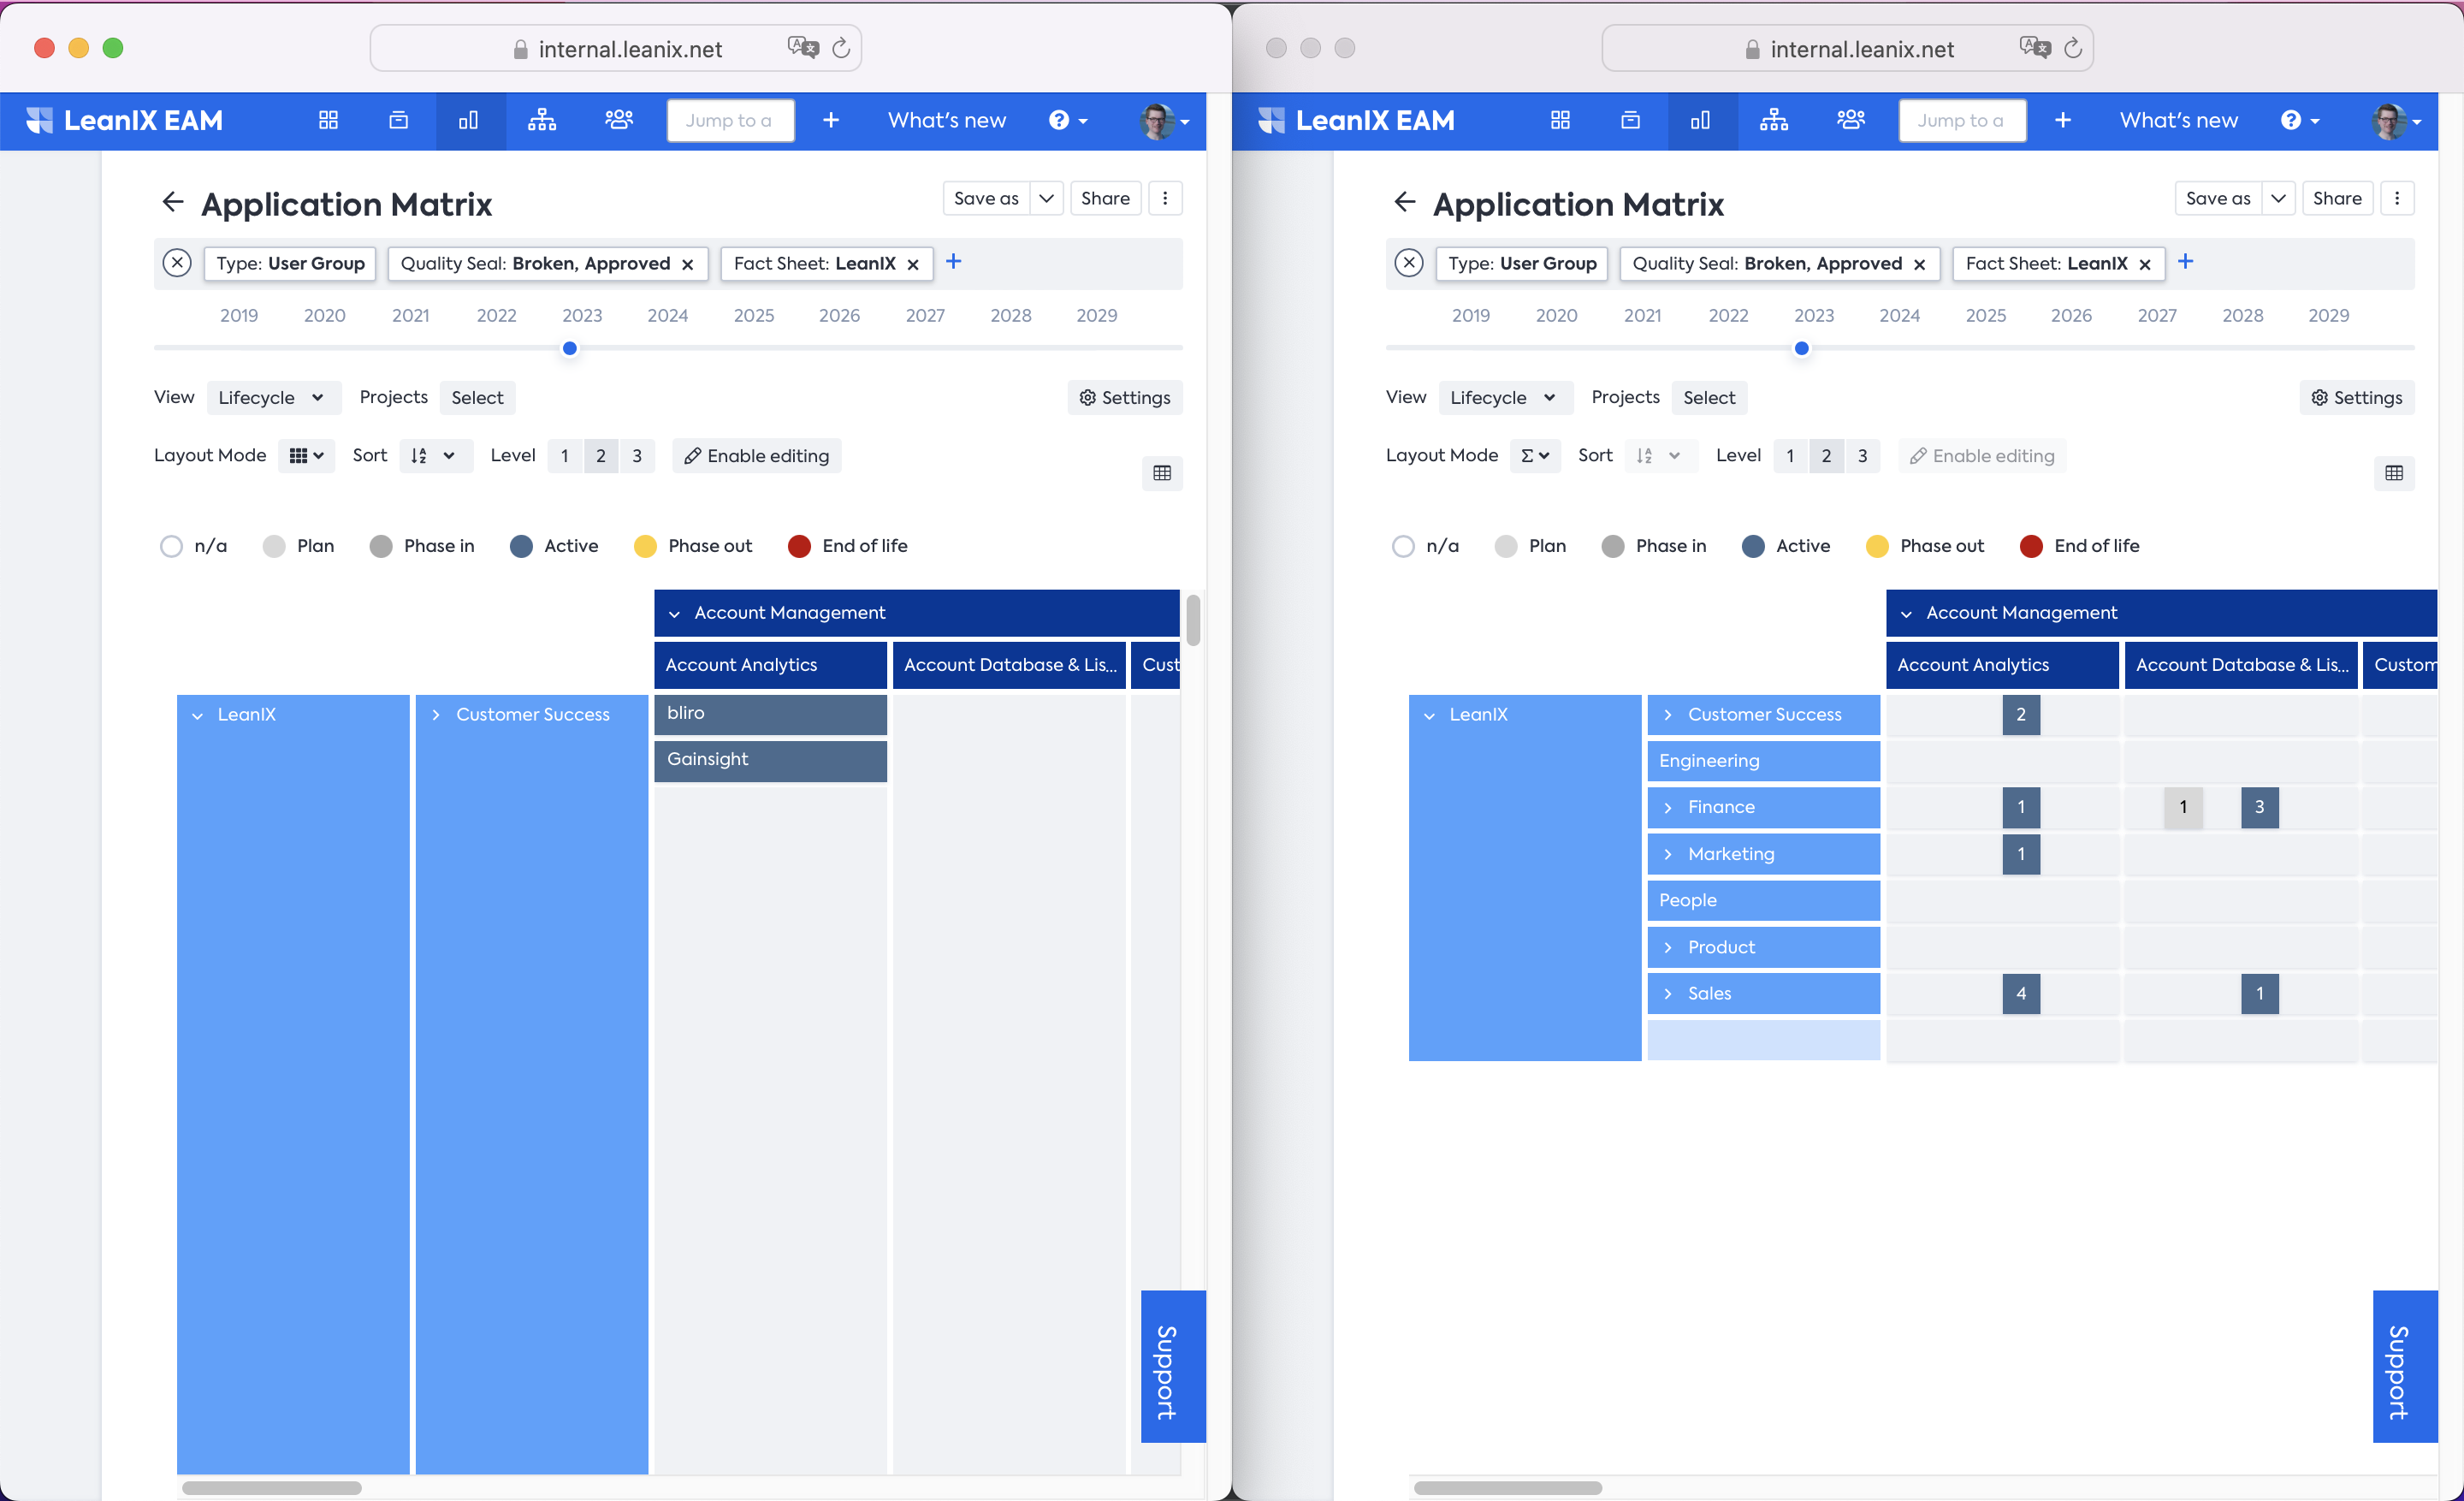
Left side: matrix report with detailed layout.
Right side: matrix report with rolled-up layout.
On the left, it is not feasible to see all clusters at the same time due to some clusters being much larger and therefore further to the right of the current view.
Landscape: Differential view
On landscape reports, we offer the feature to select two points in time on the time slider above the report. This way, users can quickly determine what changes in a given time frame.
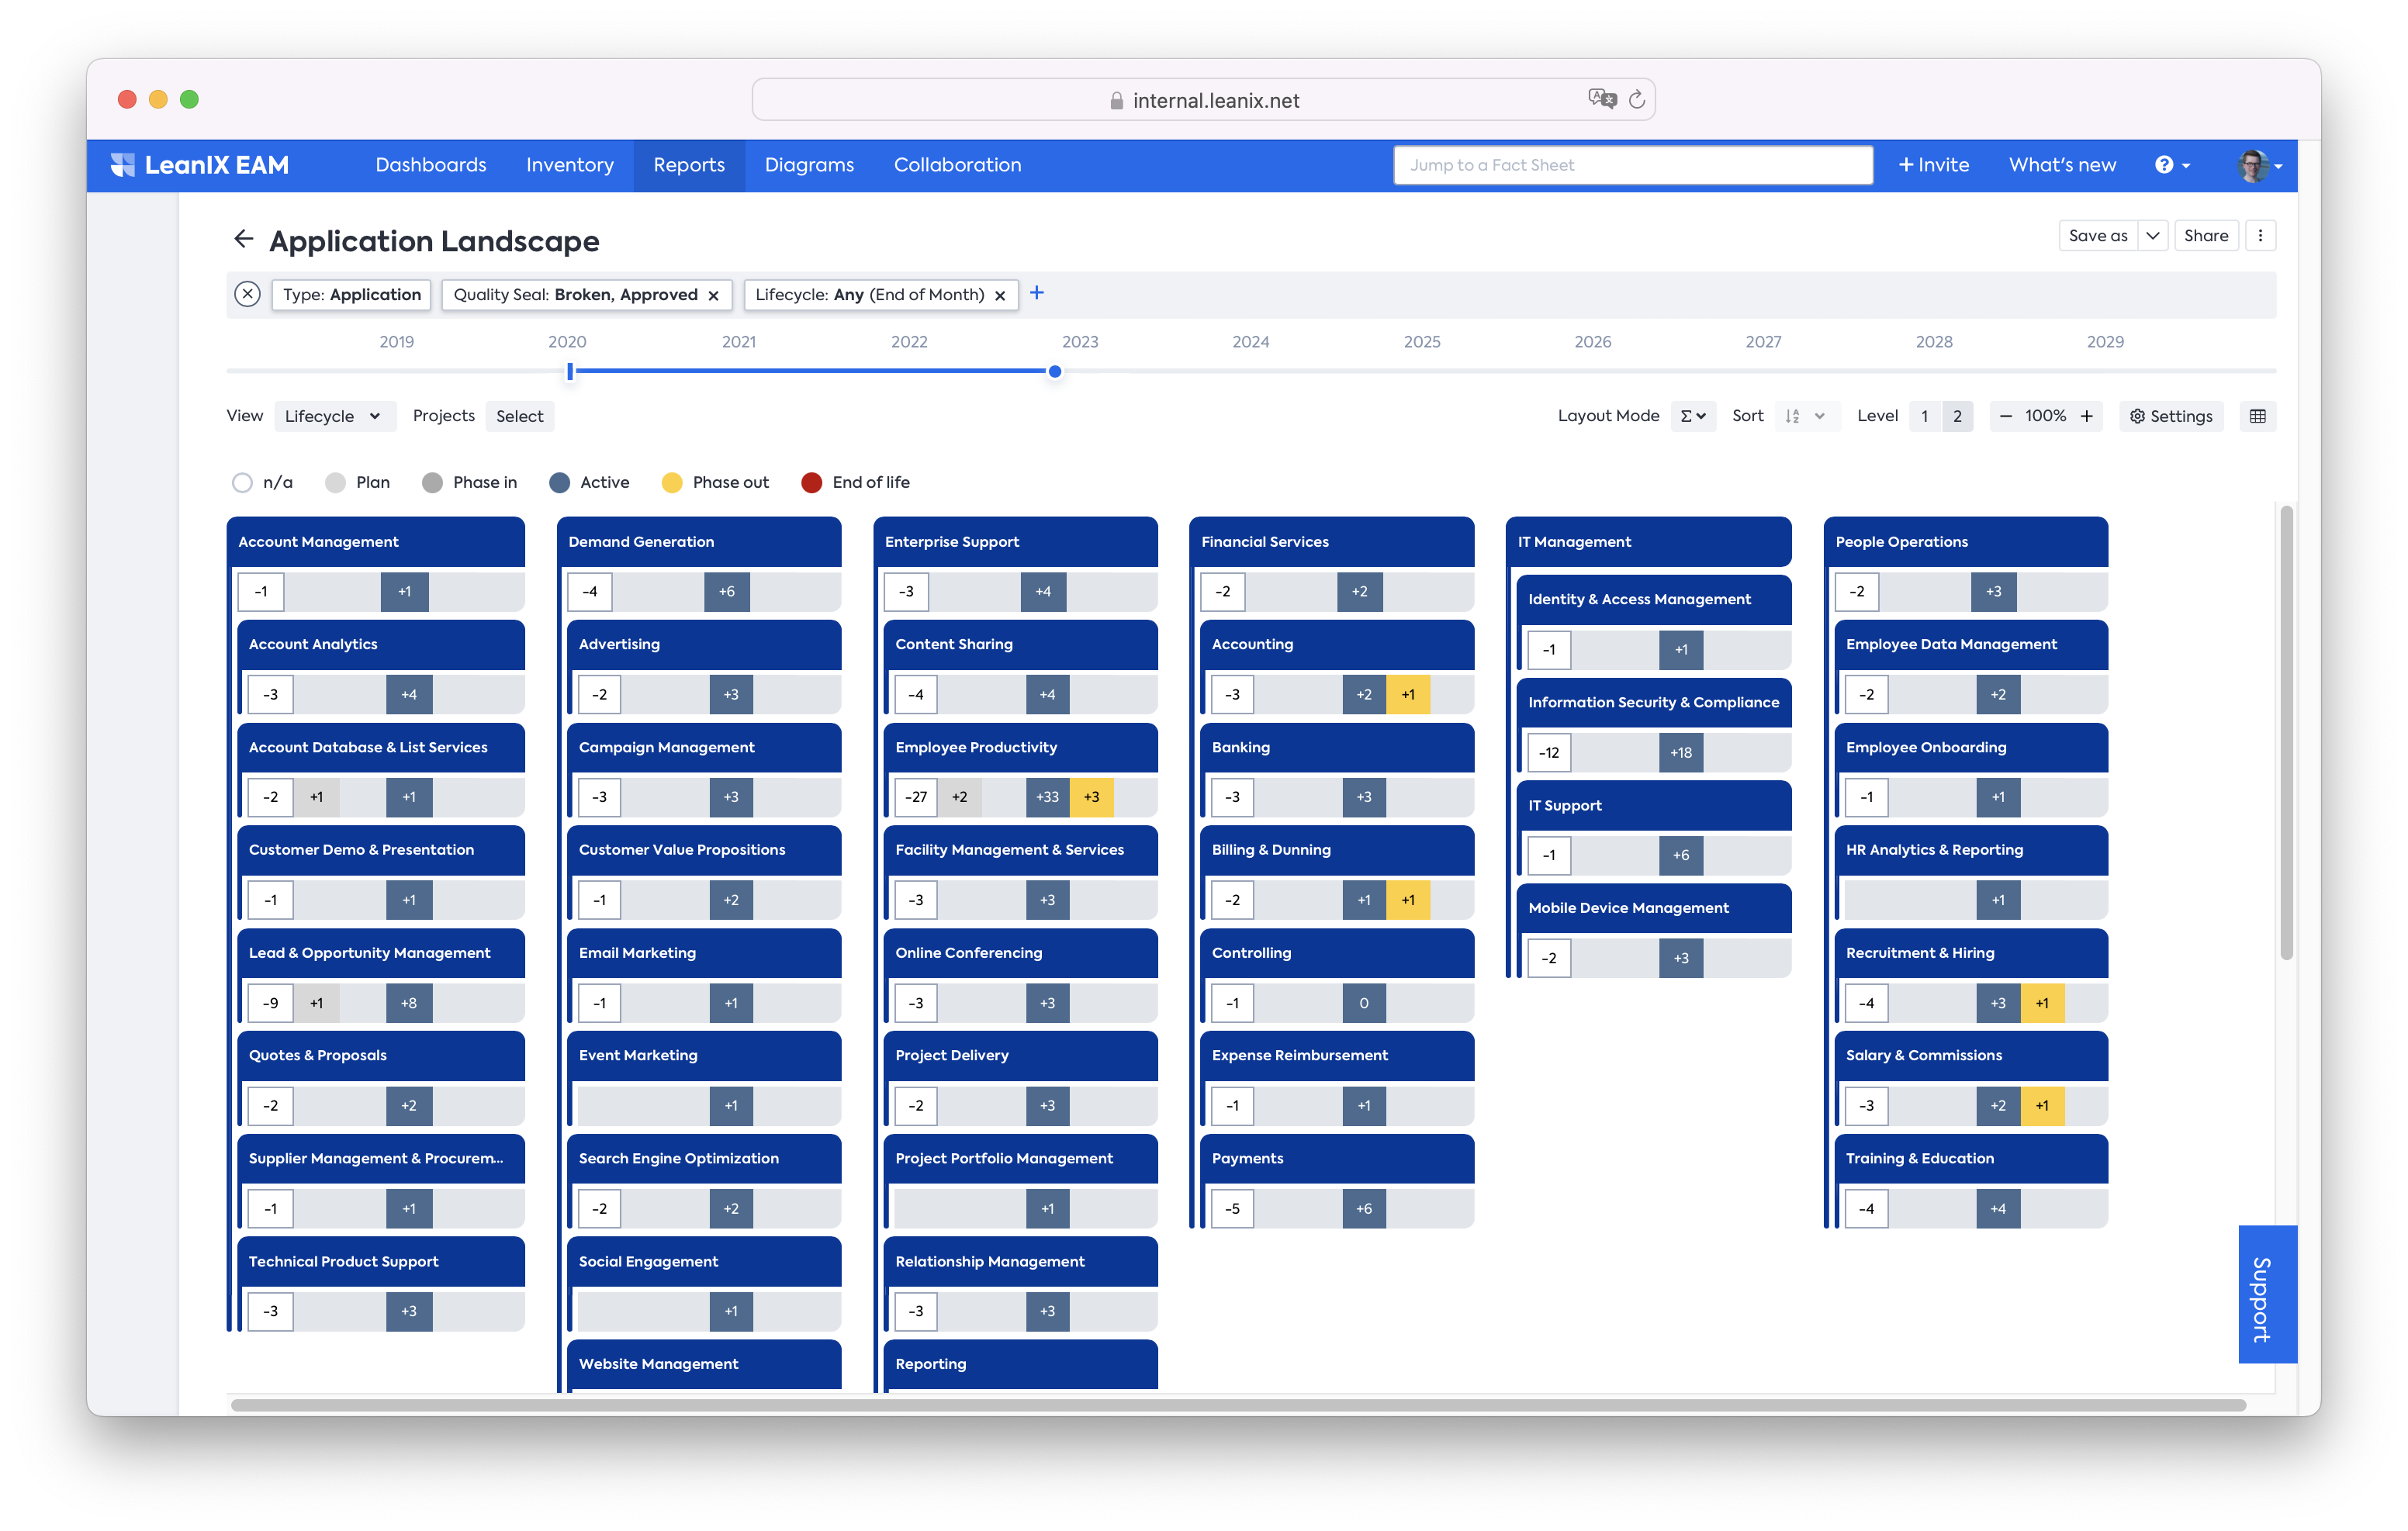
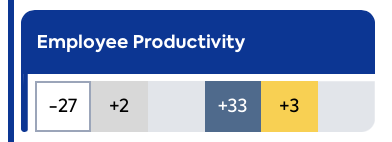
In the differential view combined with the rolled-up layout, we will show the numbers of changes for each view bucket, e.g., for employee productivity, three tools were going to a phase out in the selected time frame:
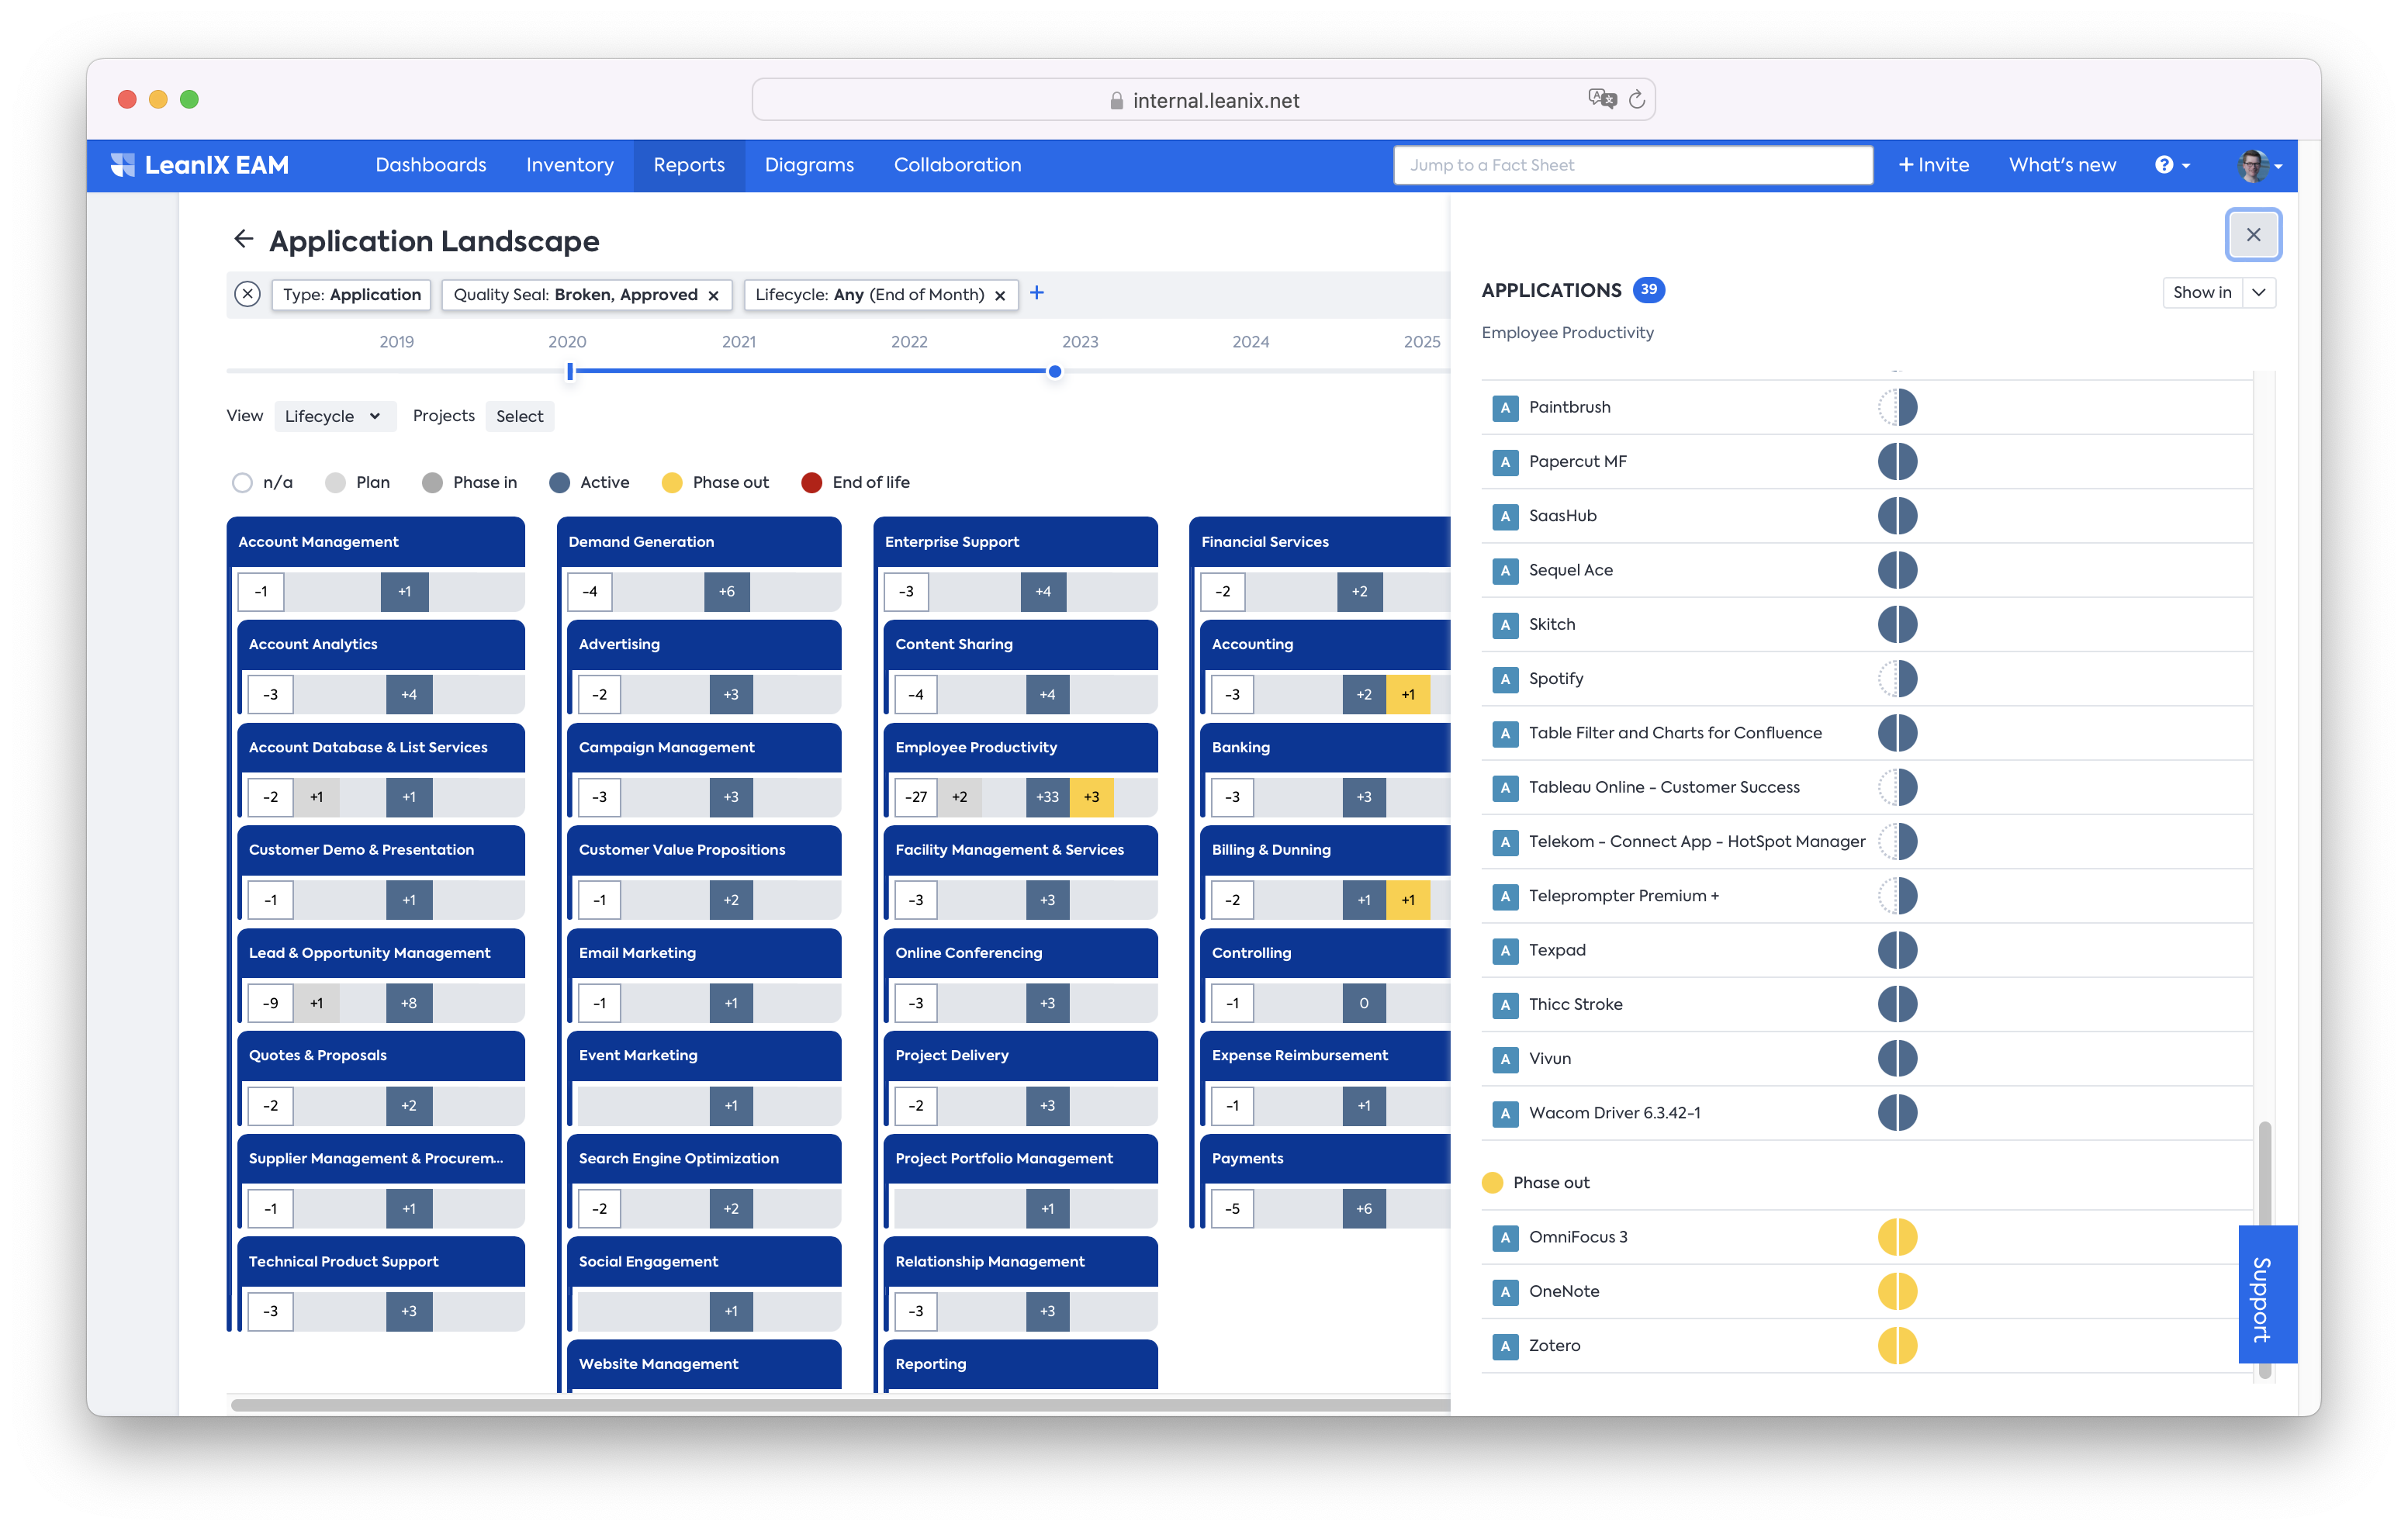
On click of any view bucket, the side pane opens, highlighting the changes:
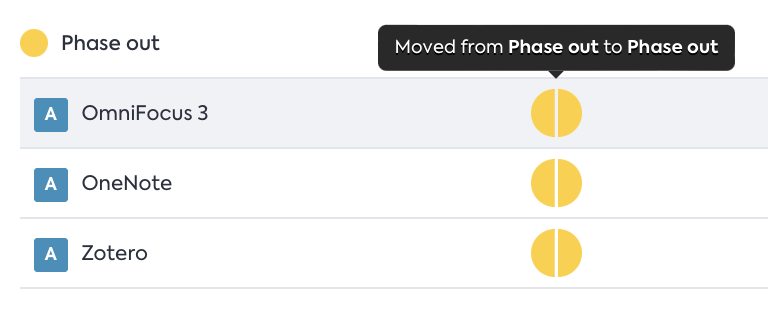
On hover, we will also explain what the icon showing the change means:
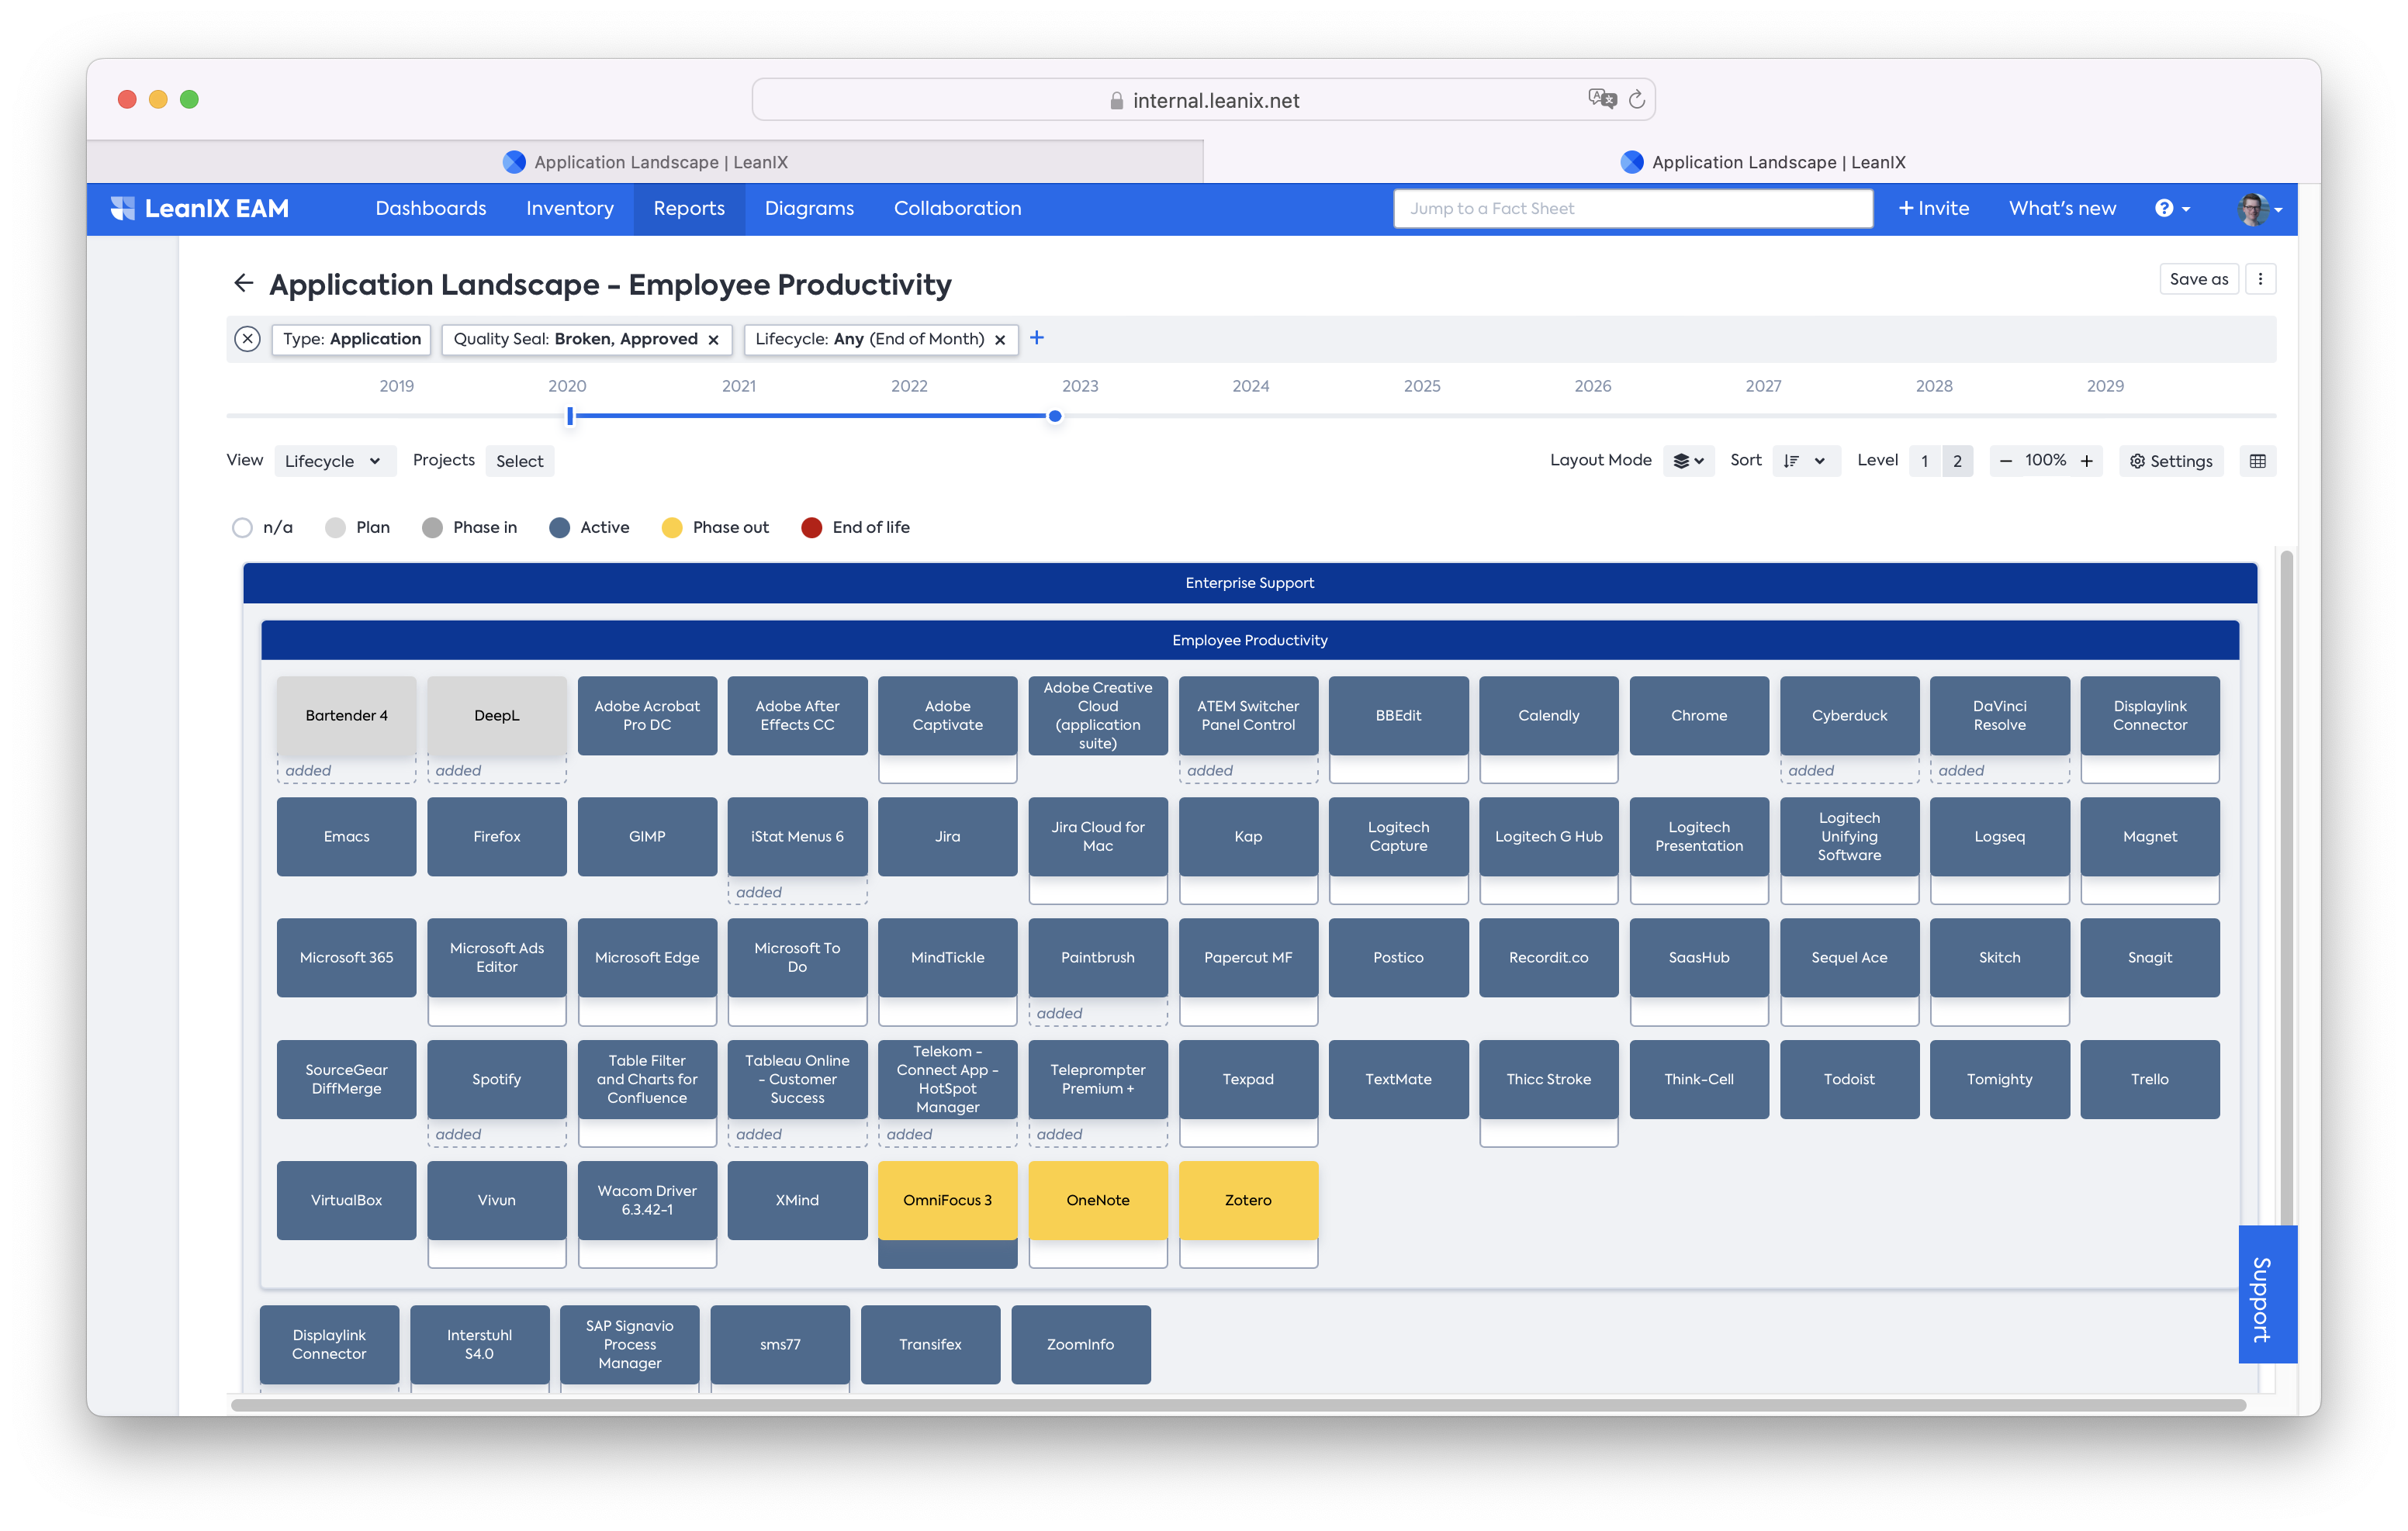
Users can also navigate from the side pane to a more specific "zoomed in" report.

The zoomed in report opens in a new browser window with the following features:
- The name is changed to highlight the “zoom in”.
- Filters are changed so only the selected cell or cluster is shown.
- Any other settings are copied over (e.g., differential view)
- Items in the cell or cluster are sorted by view legend.
Landscape Layout modes
We are going to improve the “detailed” layout by introducing an improved layout.
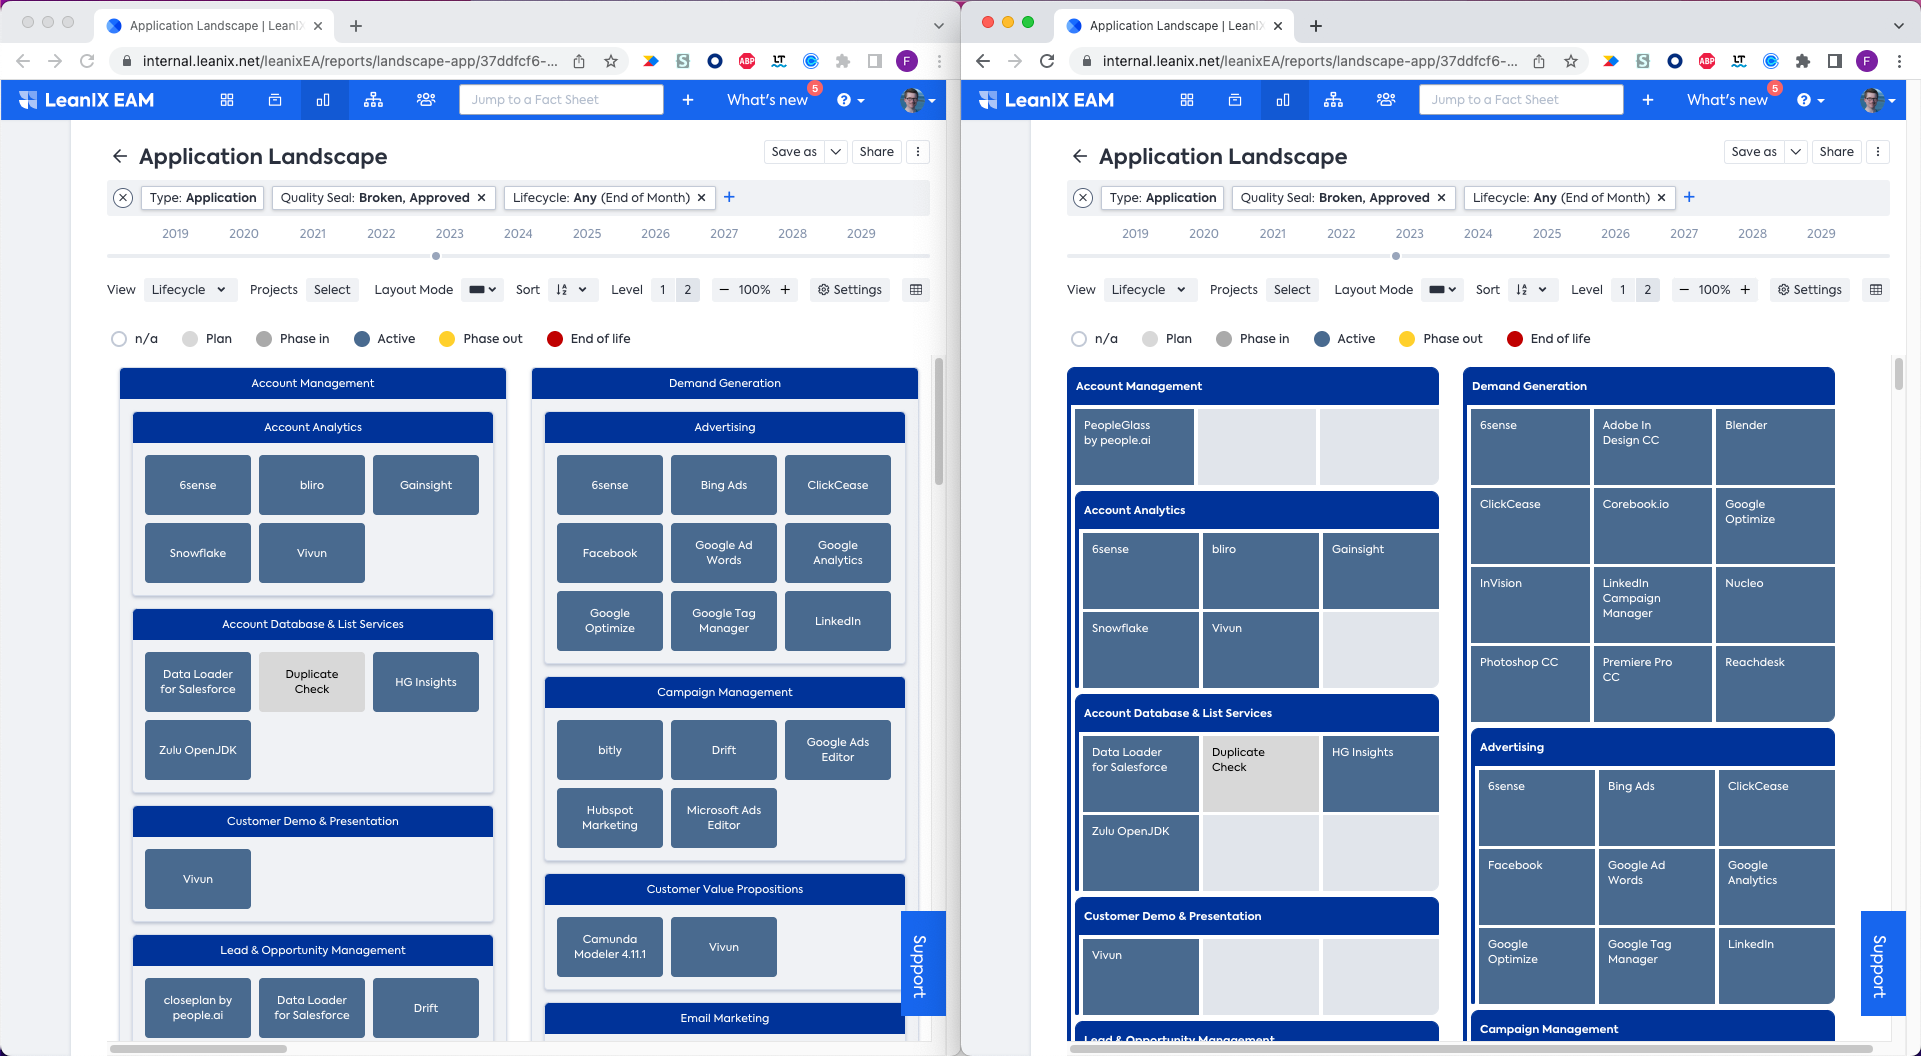
Old layout on the left, new layout on the right – leaving more space for additional attributes, less “white space” and a clearer view on the hierarchies in the clustering Fact Sheet type.
Updated over 1 year ago