
Data Flow
Data Flow diagrams in SAP LeanIX enable you to add and explore applications and their interfaces, providing a comprehensive understanding of data flow within their environment. You can visualize how data moves from one application to another, identify the supporting technologies, and gain insights into the specific data exchanged between applications.
Data Flow diagrams are especially valuable in integration architecture scenarios, as they help you understand how applications are integrated and how they exchange information. For instance, when replacing an application, the diagram helps identify dependencies and the data transfer that needs to be recreated. Similarly, when adding a new application to the landscape, the diagram shows which existing applications need to be integrated based on the data they provide and the data the new application offers. In both cases, the Data Flow diagram provides crucial insights into the integration process and facilitates smooth transitions in the application landscape.
Accessing Data Flow
To begin creating diagrams in the Data Flow, log in to your workspace and follow these steps:
- Navigate to the Diagrams section by clicking on the Diagrams tab from the top navigation bar.
- Click on New Diagram button to open the panel of available diagram editors.
- Select Data Flow from the available diagram types.
- Provide a name and description. Here, you can also set read and write permissions, and choose whether or not labels and view colors should automatically update based on changes in the inventory.
- Click Save Diagram to open the editor and start working on the diagrams.
Auto-Save
To prevent accidental data loss, changes to the diagram are saved automatically in real time. If you accidentally close the window without explicitly saving a diagram, the next time you open it, you are prompted whether to discard the previous changes or continue editing from where you left off.
Admins can utilize the Collections feature to better manage the groups of diagrams. This feature introduces individual categories among Reports and Diagrams. Check out the Collections page on how to manage these categories.
Using the Data Flow
Using the Data Flow is very similar to using Free Draw, starting from Layout to creating data flow models. It differs in that it is focused specifically on the Application Fact Sheet type to visualize the data flow between your Applications, Interfaces, and the protocols used to exchange data.
Let's consider an example: say we want to understand the integration of an application responsible for handling administrative tasks in Human Resources. We want to examine how it is integrated with other applications and the type of employee data it exchanges. To begin, we will bring the application to the Data Flow diagram.
Adding Applications
In order to include the Application Fact Sheets from the Inventory in your diagrams, do the following:
- Click on "+" icon in the toolbar. Alternatively, you can also right-click anywhere on the canvas and choose Insert from Inventory.
- A window will open showing all the Application Fact Sheets from the Inventory. Make use of filters to choose the Fact Sheets needed by using the check box to the left and clicking Insert selected. In this instance, the Application HR Admin. One also has the option to insert all of the Fact Sheets by clicking on Insert all.
- Selected Fact Sheets are now presented in the canvas.
To understand the dependencies of this application, including both direct and indirect ones, you can expand the interfaces.
Linking diagram to other diagrams
This feature enables you to manage large and complex architectural diagrams effectively. You can create multiple diagrams with varying levels of detail and link them to navigate across different abstraction layers.
In edit mode, you can link a diagram directly to a shape through a hyperlink. Clicking the shape opens the linked diagram in a new browser tab.
However, the following conditions should be kept in mind:
- You can not link a diagram to a shape if the shape is already linked to a Fact Sheet.
- You can not link a diagram to a shape that is a 'connector.'
- Each shape can be linked to only one diagram.
To learn how to link, unlink, and change the linked diagram, see the instructions here.
Expanding interfaces
You can expand the interfaces of the applications by simply clicking on the arrow icon associated with the application on the canvas. For indirect dependencies, you can further expand the interface of the depending applications and explore the dependencies more deeply, as shown below.
You can choose from three different layouts for your diagram - Vertical Flow, Horizontal Flow, and Manual Flow. Selecting and moving around the shapes is deliberately made rigid in Vertical and Horizontal Flow. In Manual Flow, users can arrange the shapes according to their needs. To select a layout, click the Layout drop-down menu on the toolbar and select the layout you want to apply.
The arrows between the applications represent interfaces, with the direction of the arrowhead indicating the Interface Data Flow Direction (Incoming, Outgoing, Bi-Directional). Their style and color indicate different lifecycle phases:
| Style | Color | Lifecycle Phase |
|---|---|---|
| Dashed | Light Gray | Planned |
| Dashed | Gray | Phase-in |
| Solid | Blue | Active |
| Solid | Yellow | Phase-out |
| Solid | Red | End of Life |
| Solid | Black | No Lifecycle Assigned |
The color of the lines is tied to the lifecycle phase of the interfaces and cannot be manually changed. To adjust a line's color, you must change the lifecycle phase of the corresponding interface.
Apply Labels
To improve representation and understanding, you can add labels to these arrows, which represent the Interface Fact Sheets.
To apply a label, follow these steps:
- Click on Labels from the Toolbar.
- From the drop-down menu, select Interfaces.
- Choose the values/fields to be displayed.
For these connections, you can choose and display multiple labels. All string fields and external IDs are available as labels. Labels can also be applied when Interface Fact Sheets are represented as shapes, such as during drill-down.
Drill-down and Roll-Up Application
It is possible to show the dependencies of Fact Sheets in a diagram. Follow this short instructional example to learn how to show dependent Fact Sheets inside a drill-down container.
- Right-click on the Application for which dependency has to be visualized.
- From the context menu, select Drill Down.
- Based on the specific Fact Sheets linked to that Application, you will see available drill-down options.
- Click on the needed relation to visualize and explore. In this instance, Data Objects that are associated with the application HR Admin.
You can also revert a drill-down by selecting the applied drill-down from the shape's context menu again. This removes the related fact sheets and the drill-down container, resulting in the single fact sheet shape being shown again.
By examining the Data Flow diagram, we can observe that the application HR Admin manages two different Data Objects: Employee and Employee Time. However, we notice that there is currently no flow of information related to Employee Time. This indicates that there may be other applications, such as Payroll Germany or Payroll Europe, that could potentially benefit from this data. For example, the employee time registered in HR Admin could be useful for payroll calculations in these applications.
Roll-up is similar to drill-down in that it helps visualize relations in a structured manner. However, it works conversely compared to drill-down. In roll-up, the selected Fact Sheets are placed inside a bucket, as shown below.
Identifying data transfer gaps presents an opportunity for optimization. By reconfiguring existing integrations and enabling comprehensive data transfer, organizations can enhance application efficiency and improve data exchange.
Applying and aggregating views
You can choose various views, similar to Reports. Views are essentially attributes or relations, which are represented through a color-coded visualization. Each view provides a unique perspective on the data, enabling the user to gain better insights. Check our Report views documentation to understand the different insights you can gain from applying views.
The view toolbar at the top of the canvas becomes active whenever there is at least one Fact Sheet in the diagram. Select the needed view from the drop-down menu. After selecting a view, the view colors will be applied to the related Fact Sheets, and the view legend will be displayed above. When the diagram is saved, the view will also be stored.
Applying views is similar to how it is done in the Free Draw editor. Similarly, it is also possible to change the aggregation of the selected view. Aggregations can only be applied to views of fields that are either Fields on relations or Fields on related Fact Sheets. Learn more about aggregating views here.
View aggregation in Diagrams
For views calculations only Fact Sheets that are present on the canvas and have relations drawn on the canvas are considered. This means the color code is displayed only for the Fact Sheets and relations visible in the view.
However, If a Fact Sheet is selected for the Aggregation view, presence of related Fact Sheets on the canvas is not a requirement; instead, any relations to that Fact Sheet in the inventory determine its value in the view. This functionality differs from reports, where all data is typically shown.
Updates from Inventory
Diagrams always show the view the way it was saved last time. This might differ from the current view of the architecture if changes to the architecture happened after the diagram was saved. Fact Sheets and relations will only be removed from the canvas if you manually apply these updates.
The Data Flow and Free Draw diagram data is kept up to date with the Inventory, so any changes made to the Inventory are automatically indicated in the diagram. However, it's important to note that while updates are indicated, they are not automatically applied.
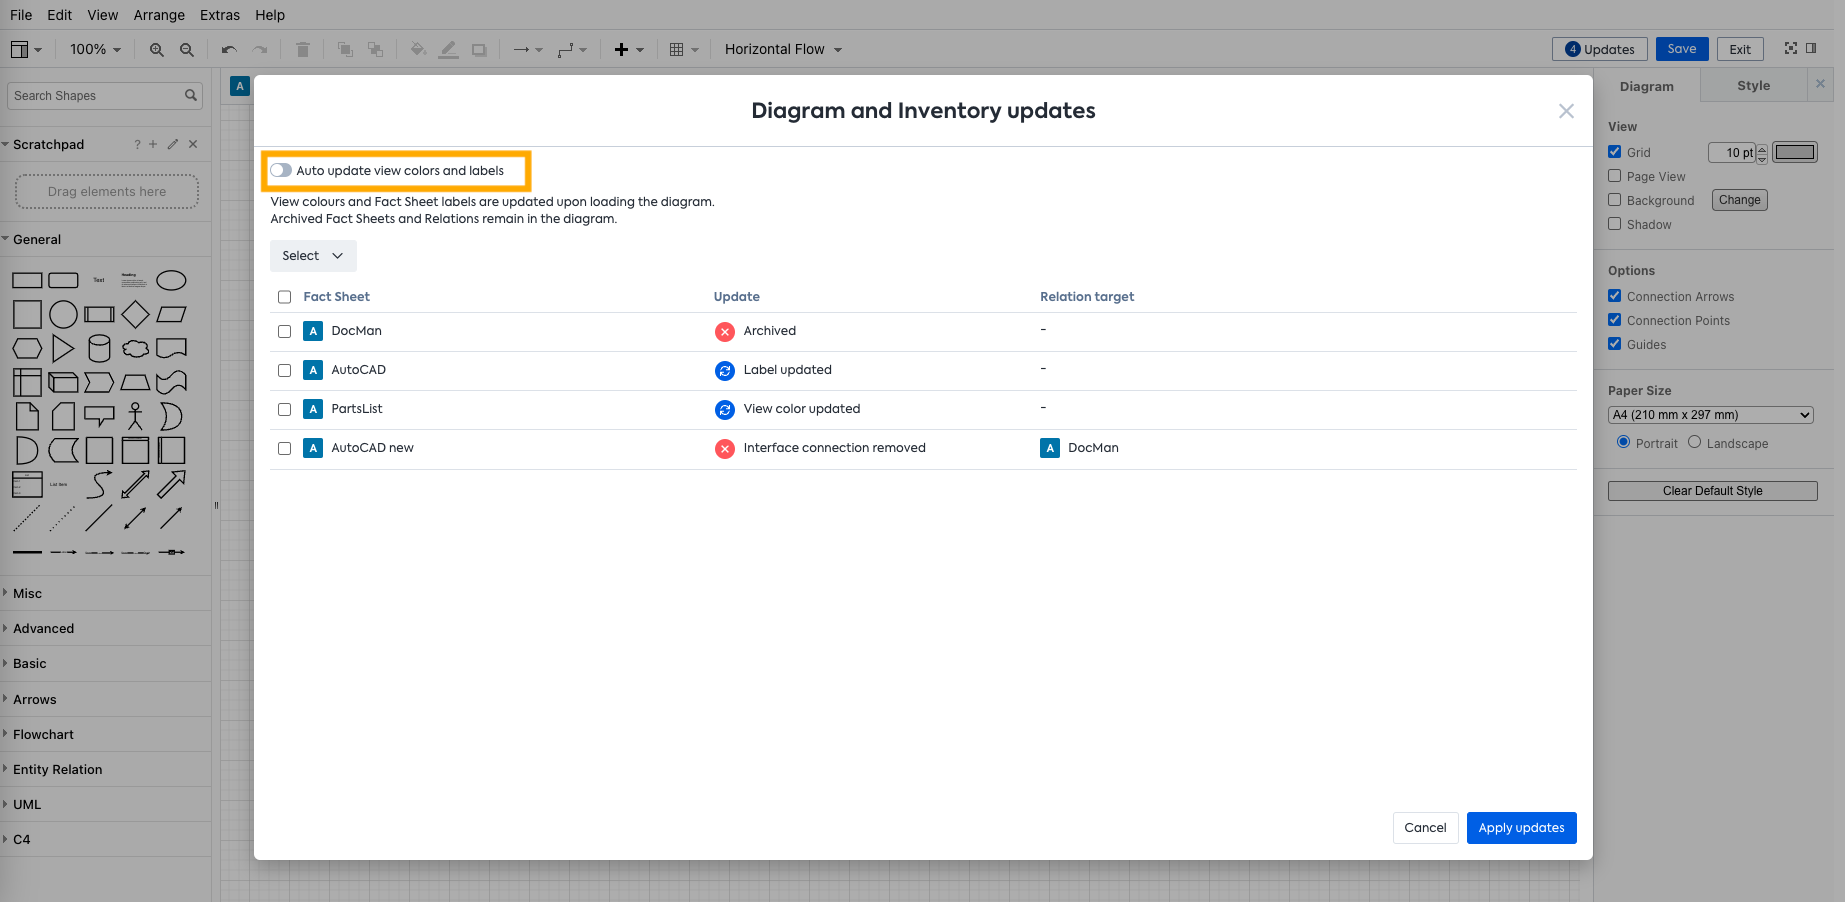
Updates appear in the top right corner of both the view and edit modes. A count of the available updates for the diagram is also displayed. To view more details for all available updates in the diagram, click Updates.

To apply updates, switch to the edit mode. There, you can click the Updates button to view all updates available for the diagram. Select the updates that you want to apply and click Apply Updates.
Labels and views are updated automatically unless Auto update view colors and labels is toggled off. It will also remove from the modal all updates related to updating Fact Sheet view colors and labels. This setting is enabled by default on new diagrams but can be turned off and on as needed.
If auto-update is applied after the diagram is opened, and the user doesn't have the need to save it, then they can click Exit and Discard changes, and the diagram will be in the same state as before the auto-update.
"Updating Diagram" spinner
In the view mode, "Updating diagram" spinner icon indicates data is currently loading for views and/or an automatic update is in progress in the backend. Once the update concludes, the spinner disappears, and the view toolbar becomes functional again. Throughout the spinner display, other functionalities such as zooming, changing the viewport, clicking on diagrams or Fact Sheets, and using filters remain accessible.
This allows users to swiftly view and interact with diagrams on the dashboard and in the view mode without waiting for the backend updates to finish.
Exporting diagrams
The diagrams can be exported to other formats, such as PDF, SVG, PNG, HTML embed code, and XML file, which is compatible with Flowchart Maker & Online Diagram Software. Check the documentation on Exporting diagrams for more details.
Fact Sheet and Relation Creation from the Diagram
Fact Sheet and Relation Creation features are only available in Free Draw. Although we envision enabling the creation of Applications and Interfaces directly from the Data Flow editor, this is currently not yet available.
Updated about 1 month ago